Ash Flat Healthcare and Rehabilitation Center
Nursing Home, Hospice Care, Memory Care, Palliative Care & Respite Care · Ash Flat, AR
CMS overall rating Info CMS (the Centers for Medicare & Medicaid Services) is the federal agency that rates nursing home quality. Its Overall Rating runs from 1 to 5 stars, combining health inspections, staffing, and quality measures, with inspections weighted most heavily.

Ash Flat Healthcare and Rehabilitation Center

Nursing Home, Hospice Care, Memory Care, Palliative Care & Respite Care · Ash Flat, AR
CMS overall rating Info CMS (the Centers for Medicare & Medicaid Services) is the federal agency that rates nursing home quality. Its Overall Rating runs from 1 to 5 stars, combining health inspections, staffing, and quality measures, with inspections weighted most heavily.
Calculator: See prices in your area
Ash Flat Healthcare and Rehabilitation Center accepts Medicaid, Medicare, and private pay.

Overview of Ash Flat Healthcare and Rehabilitation Center

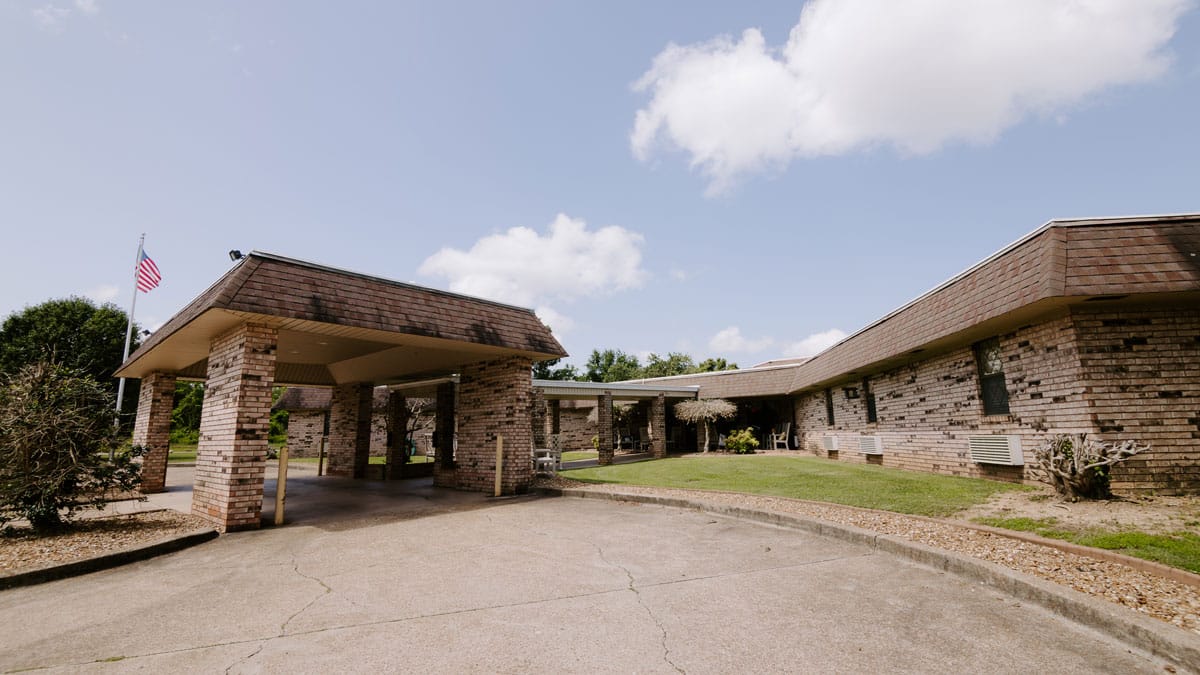
Misty French owns Ash Flat Healthcare and Rehabilitation Center, a 105-bed nursing facility run by Sharp SNF Operations, LLC in Ash Flat, Arkansas. The building serves an average resident stay of about 133 days, meaning the day-to-day workload balances short-term post-hospital therapy with intermediate residential care. To process room rates and care costs, the billing desk accepts standard private pay, traditional Medicare, and state Medicaid.

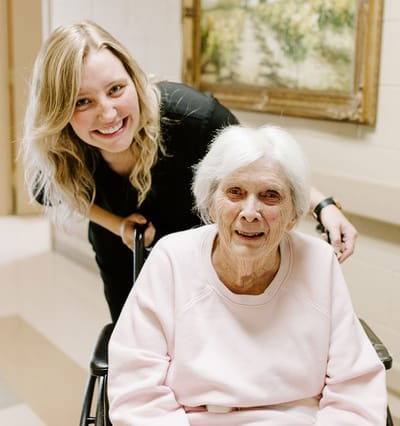
On the floor, the nursing crew delivers an average of 4 hours and 52 minutes of direct care to each resident daily. This 24-hour team of registered nurses, practical nurses, and assistants coordinates physical therapy routines, manages an on-staff doctor, and operates an Enhanced Care Unit for residents with complex clinical needs.

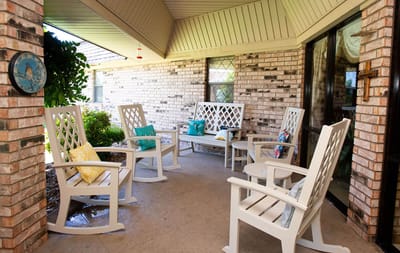
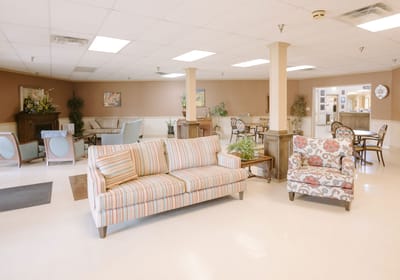
For daily life, the rural campus features whirlpool baths and high-speed internet access. Because the surrounding area requires a vehicle for almost all errands, visiting families will need to drive when traveling to and from the property.

Prospective residents can call the administrative office to ask how the admissions process works or to check on current bed openings. The front desk staff can also provide details on how the team has addressed recent safety surveys from government health inspectors, who previously noted compliance issues here with clinical documentation, medication safety, and care planning processes.

Quality ratings

Measured by Centers for Medicare & Medicaid Services (CMS)

Overall rating Info The Overall CMS Rating combines results from health inspections, staffing levels and quality measures. Health inspections carry the most weight. Staffing and quality scores can increase or decrease the final rating based on performance compared to state and national standards.
Health Inspection Info Based on the results of the facility's three most recent standard inspections and any complaint investigations. CMS reviews the number, scope, and severity of deficiencies, with more recent findings weighted more heavily.
Staffing Info Measures average nursing staff hours per resident per day, including Registered Nurses (RNs) and total nursing staff. Ratings are adjusted based on the level of care residents require and are compared to state and national benchmarks.
Quality Measures Info Based on clinical and physical health indicators reported to CMS, such as hospital readmissions, falls, pressure ulcers, and improvements in mobility. These measures reflect how well residents' health needs are being managed.

Staffing hours breakdown

Info Daily nursing hours per resident by staff type, reported to CMS. Higher is generally better — compare this facility to state and national averages to see where staffing stands.

Hours per resident per day — compared to state averages

Total nursing care / resident Info Total adjusted nursing hours per resident per day, combining RN, LPN, and aide time. CMS adjusts this for case-mix so facilities can be fairly compared.
4h 52m per day
vs avg

4 of 6 metrics below state avg

Staff type Hours / Day / Resident vs state avg
Registered Nurse (RN) Info RNs hold the highest nursing license and can assess residents, interpret test results, and direct care plans. More RN hours per day often signals stronger clinical oversight and faster response to health changes. 24m per day ■ Avg State avg: 24m per day · National avg: 41m per day
LPN / LVN Info Licensed Practical Nurses (LPNs) or Licensed Vocational Nurses (LVNs) deliver routine hands-on care — medication administration, wound dressing, and monitoring vital signs. They work under RN supervision and make up a large share of daily bedside care. 56m per day ■ Avg State avg: 57m per day · National avg: 52m per day
Nurse Aide Info Certified Nurse Aides (CNAs) provide the most direct day-to-day assistance: bathing, dressing, feeding, and mobility. Nurse aide hours are typically the largest staffing category and directly affect residents' quality of life. 2h 29m per day ▼ 9% State avg: 2h 43m per day · National avg: 2h 20m per day
Weekend Total Nursing Info Combined nursing hours (RN + LPN + Nurse Aide) per resident per day on weekends. Staffing often drops on weekends — this figure reveals whether the facility maintains adequate coverage outside of weekday hours. 3h 18m per day ▼ 5% State avg: 3h 29m per day · National avg: 3h 26m per day
Physical Therapist Info Hours per resident per day provided by licensed Physical Therapists (PTs) or PT Assistants. PT services help residents recover mobility after injury or illness and are especially important for post-acute (short-stay) rehabilitation. 1m per day ▼ 62% State avg: 2m per day · National avg: 4m per day
Weekend RN Info Registered nurse hours specifically on weekends. Facilities sometimes reduce RN presence on Saturdays and Sundays — a low weekend RN figure compared to weekday hours can indicate reduced clinical oversight when most administrative staff are absent. 11m per day ▼ 33% State avg: 16m per day · National avg: 28m per day

Capacity and availability

Avg. Length of Stay
133 days
Bed community size
105-bed community Rank #108 / 330Bed count — State benchmarkedThis home is ranked 108th out of 330 homes in Arkansas. Shows this facility's certified or reported bed count compared to other Arkansas facilities. Larger communities may offer more amenities, programs, and on-site services for residents and families.Rankings are based only on facilities in Arkansas that report data for that category. Facilities without available data are excluded from the ranking.Click the rank badge to see the full State ranking.Click here to see the full State ranking.
A larger shared setting that may offer more common spaces and organized community services.
Walk Score
Walk Score: 16 / 100 Rank #308 / 419Walk Score — State benchmarkedThis home is ranked 308th out of 419 homes in Arkansas. Shows how walkable this facility's neighborhood is compared to the average Walk Score across Arkansas facilities. Higher scores benefit residents, families, and staff.Rankings are based only on facilities in Arkansas that report data for that category. Facilities without available data are excluded from the ranking.Click the rank badge to see the full State ranking.Click here to see the full State ranking.
Car-dependent. Most errands require a car, with limited nearby walkable options.

About this community

License Details

Facility TypeSkilled Nursing Facility With Dual Certified Beds (medicaid / Medicare)
CountySharp
CMS Certification Number045155
Certification TypeMedicaid / Medicare
AccreditationsCMS 5-Star Quality Rating

Ownership & Operating Entity

Ash Flat Healthcare and Rehabilitation Center is legally operated by Sharp SNF Operations, LLC, and administered by Misty French.

Owner NameSharp Snf Operations, LLC
Profit StatusFor-profit

Type Of Units

Medicaid and Medicare
105 units
Total beds
105 units

Payment & Insurance

1 service
Accept Medicaid

Therapy & Rehabilitation

1 service
Rehabilitation Services

Staffing & Medical

2 services
Doctor on Staff
24-Hour Staffing

Contact Information

Fax870-994-2325

Amenities & Lifestyle

High-Speed Internet
Whirlpool Baths
Specific ProgramsEnhanced Care Unit

Contact Ash Flat Healthcare and Rehabilitation Center

Inspection History

In Arkansas, the Department of Human Services, Office of Long Term Care is authorized to conduct unannounced inspections and issue official quality of care reports for all senior living providers.

Since 2022 · 4 years of data 18 deficiencies

Inspection Scorecard Info This scorecard compares key inspection, deficiency, and complaint metrics at this facility against the Arkansas state average. Metrics rated ≥15% worse than average are highlighted in red; those ≥15% better are highlighted in green.

Since 2022 vs. Arkansas state average
Overall vs. AR average 0 Worse No metrics in this bucket. 2 Better Metrics better than Arkansas average:
• Total deficiencies (14% below)
• Deficiencies per year (15% below)
Latest Inspection June 12, 2025 Annual Inspection

Deficiencies Info Deficiencies are formal regulatory issues recorded during state inspections.

This Facility AR Average vs. AR Avg
Total deficiencies Info Formal regulatory issues recorded by inspectors across all inspection types. 18 21 This facility has 14% fewer total deficiencies than a typical Arkansas assisted living residence (18 vs. AR avg 21).↓ 14% better
Deficiencies per year Info Average deficiencies per year since 2022. 4.5 5.3 This facility has 15% fewer deficiencies per year than a typical Arkansas assisted living residence (4.5 vs. AR avg 5.3).↓ 15% better

Inspection Reports Summary Info An editor-reviewed summary of the themes and findings across this facility's recent inspection reports.

  • The June 12, 2025 annual inspection found no health deficiencies and no complaints.
  • The March 21, 2024 inspection cited 11 deficiencies including unsafe oxygen therapy, poor food safety, incomplete care plans, and unsecured cigarettes.
  • A May 5, 2023 complaint investigation substantiated a medication administration error where one resident consumed another’s medication mixed in food.

Health Inspection History

Inspections since 2022
Total health inspections 3

State average N/A


Last Health inspection on Mar 2024

Total health citations
18

State average N/A

Citations per inspection
6

State average N/A


Health citations are formal notices following inspections when they fail to comply with safety and care standards.

17 of 18 citations resulted from standard inspections; and 1 of 18 resulted from complaint investigations.

Breakdown of citation severity (last 4 years)
Critical health citations
0
In line with State average

State average: N/A


Serious health citations
0
In line with State average

State average: N/A

0 critical citations State average: N/A

0 serious citations State average: N/A

18 moderate citations State average: N/A

0 minor citations State average: N/A
Citations history (last 4 years)
Nutrition moderate citation Mar 21, 2024
Corrected

Nutrition moderate citation Mar 21, 2024
Corrected

Quality of Care moderate citation Mar 21, 2024
Corrected

Quality of Care moderate citation Mar 21, 2024
Corrected

Staffing Data

Reporting period: October 1 – December 31, 2025 (Q4 2025). Source: CMS Payroll-Based Journal report.

Total staff 82
Employees 65
Contractors 17
Staff to resident ratio 1.55 : 1
0% compared with State average

State average ratio: 0 : 0

Avg staff/day 31
Average shift 8.1 hours
0% compared with State average

State average: 0 hours

Total staff hours (quarter) 23,153

Nursing staff breakdown

Q4 2025 · Oct 1 – Dec 31 More info This data comes from the CMS Payroll-Based Journal report covering October 1 – December 31, 2025.
Registered Nurse

Manages medical care and health needs.

RN Staff Info All 4 RN Staff are full-time employees. No contractors work on this role. 4
Average shift length Info Average shift length. Calculated as total hours divided by days worked and average staff per day. 6.6 hours
Licensed Practical Nurse

Assists with medical care and medications.

LPN Staff Info All 12 LPN Staff are full-time employees. No contractors work on this role. 12
Average shift length Info Average shift length. Calculated as total hours divided by days worked and average staff per day. 9.2 hours
Certified Nursing Assistant

Helps with daily care and mobility.

CNA Staff Info All 34 CNA Staff are full-time employees. No contractors work on this role. 34
Average shift length Info Average shift length. Calculated as total hours divided by days worked and average staff per day. 8.3 hours

Contractor staffing

Q4 2025 · Oct 1 – Dec 31 More info This data comes from the CMS Payroll-Based Journal report covering October 1 – December 31, 2025.

Total hours from contractors

7.1%

1,642 contractor hours this quarter

Physical Therapy Aide: 3 Speech Language Pathologist: 3 Clinical Nurse Specialist: 3 Qualified Social Worker: 2 Physical Therapy Assistant: 2 Respiratory Therapy Technician: 1 Occupational Therapy Assistant: 1 Medical Director: 1 Occupational Therapy Aide: 1

Staff by category

Q4 2025 · Oct 1 – Dec 31 More info This data comes from the CMS Payroll-Based Journal report covering October 1 – December 31, 2025.
Certified Nursing Assistant 34 0 34 12,195 92 100% 8.3
Licensed Practical Nurse 12 0 12 4,513 92 100% 9.2
Clinical Nurse Specialist 4 3 7 1,505 91 99% 7.8
Medication Aide/Technician 4 0 4 1,168 92 100% 11.8
Nurse Practitioner 3 0 3 533 66 72% 7.9
Dietitian 1 0 1 519 64 70% 8.1
RN Director of Nursing 1 0 1 512 65 71% 7.9
Mental Health Service Worker 1 0 1 489 61 66% 8
Administrator 1 0 1 440 55 60% 8
Speech Language Pathologist 0 3 3 432 66 72% 6.4
Physical Therapy Aide 0 3 3 407 64 70% 6.2
Qualified Social Worker 0 2 2 163 39 42% 4
Registered Nurse 4 0 4 119 13 14% 6.6
Respiratory Therapy Technician 0 1 1 68 24 26% 2.8
Physical Therapy Assistant 0 2 2 57 26 28% 2.1
Occupational Therapy Aide 0 1 1 21 3 3% 6.8
Occupational Therapy Assistant 0 1 1 8 3 3% 2.5
Medical Director 0 1 1 7 3 3% 2.3
34 Certified Nursing Assistant
% of Days 100%
12 Licensed Practical Nurse
% of Days 100%
7 Clinical Nurse Specialist
% of Days 99%
4 Medication Aide/Technician
% of Days 100%
3 Nurse Practitioner
% of Days 72%
1 Dietitian
% of Days 70%
1 RN Director of Nursing
% of Days 71%
1 Mental Health Service Worker
% of Days 66%
1 Administrator
% of Days 60%
3 Speech Language Pathologist
% of Days 72%
3 Physical Therapy Aide
% of Days 70%
2 Qualified Social Worker
% of Days 42%
4 Registered Nurse
% of Days 14%
1 Respiratory Therapy Technician
% of Days 26%
2 Physical Therapy Assistant
% of Days 28%
1 Occupational Therapy Aide
% of Days 3%
1 Occupational Therapy Assistant
% of Days 3%
1 Medical Director
% of Days 3%

Penalties and fines

Federal penalties imposed by CMS for regulatory violations, including civil money penalties (fines) and denials of payment for new Medicare/Medicaid admissions.

Source: CMS Penalties Database

No penalties in the past 3 years

No civil money penalties or payment denials were reported in the last 3 years.

Quality of care over time

These measures show how residents usually do over time at this home, based on health outcomes and preventive care.

High-risk clinical events score Info A composite score based on pressure ulcers, falls with injury, weight loss, walking ability decline, and activities of daily living decline. 6.6
14% better than State average

State average: 7.7

Functional decline score Info A composite score based on activities of daily living decline, walking ability decline, and incontinence. 9.4
30% better than State average

State average: 13.3

Long-stay resident measures
Significantly above average State avg: 4.2 Info CMS star rating based on long-stay quality measure performance. 5 stars = significantly above average, 1 star = significantly below average.
Need for Help with Daily Activities Increased Info Percent of long-stay residents whose need for help with daily activities has increased 8.6%
25% better than State average

State average: 11.5%

Walking Ability Worsened Info Percent of long-stay residents whose ability to move independently worsened 8.0%
40% better than State average

State average: 13.4%

Low Risk Residents with Bowel/Bladder Incontinence Info Percent of low risk long-stay residents who lose control of their bowels or bladder 11.6%
23% better than State average

State average: 15.1%

Falls with Major Injury Info Percent of long-stay residents experiencing one or more falls with major injury 10.8%
174% worse than State average

State average: 3.9%

High Risk Residents with Pressure Ulcers Info Percent of long-stay high risk residents with pressure ulcers 4.8%
In line with State average

State average: 4.7%

Urinary Tract Infection Info Percent of long-stay residents with a urinary tract infection 0.0%
100% better than State average

State average: 1.3%

Lost Too Much Weight Info Percent of long-stay residents who lose too much weight 1.0%
80% better than State average

State average: 5.0%

Depressive Symptoms Info Percent of long-stay residents who have depressive symptoms 6.6%
324% worse than State average

State average: 1.5%

Antipsychotic Use Info Percent of long-stay residents who received an antipsychotic medication 1.7%
84% better than State average

State average: 10.5%

Pneumococcal Vaccine Info Percent of long-stay residents assessed and appropriately given the pneumococcal vaccine 97.2%
In line with State average

State average: 94.4%

Influenza Vaccine Info Percent of long-stay residents assessed and appropriately given the seasonal influenza vaccine 100.0%
In line with State average

State average: 96.2%

Hospitalizations per 1,000 days Info Number of hospitalizations per 1,000 long-stay resident days. 1.11
44% better than State average

State average: 1.97

ED visits per 1,000 days Info Number of outpatient emergency department visits per 1,000 long-stay resident days. 3.76
72% worse than State average

State average: 2.18

Short-stay resident measures
Above average State avg: 2.7 Info CMS star rating based on short-stay quality measure performance. 5 stars = much above average, 1 star = much below average.
Pneumococcal Vaccine Info Percent of short-stay residents assessed and appropriately given the pneumococcal vaccine 75.6%
7% worse than State average

State average: 80.9%

Antipsychotic medication increase Info Percent of short-stay residents who newly received an antipsychotic medication 1.1%
25% better than State average

State average: 1.5%

Influenza Vaccine Info Percent of short-stay residents assessed and appropriately given the seasonal influenza vaccine 84.1%
8% better than State average

State average: 77.7%

Re-hospitalized after SNF stay Info Percentage of short-stay residents who were re-hospitalized after their nursing home admission. 22.2%
12% better than State average

State average: 25.2%

Emergency department visits Info Percentage of short-stay residents who had an outpatient emergency department visit. 12.1%
12% better than State average

State average: 13.8%

Falls with major injury Info Percentage of SNF residents who experience falls with major injury during their stay. 0.0%
100% better than State average

State average: 0.8%

Ability to care for self at discharge Info Percentage of residents at or above expected ability to care for themselves at discharge. 64.0%
19% better than State average

State average: 53.7%

Successful return to home or community Info Rate of successful return to home or community from a skilled nursing facility. 49.0%
In line with State average

State average: 50.6%

Breakdown by payment type

Medicare

34% of new residents, usually for short-term rehab.

Typical stay 25 days

Private pay

53% of new residents, often for short stays.

Typical stay 2 - 3 months

Medicaid

14% of new residents, often for long-term daily care.

Typical stay 1 - 2 years

Facility Characteristics

Source: CMS Long-Term Care Facility Characteristics (Data as of Jan 2026)

Total residents 53
Medicare
1
1.9% of residents
Medicaid
29
54.7% of residents
Private pay or other
23
43.4% of residents
Programs & Services
Residents Group

Residents meet regularly to discuss policies, care quality, and activities

Active Resident Council

Organized group of residents that meets regularly to discuss facility policies, quality of life, and activities.

Finances and operations

Based on CMS SNF Cost Report for fiscal year ending in 12/2023.

For-profit
Operated by a single business entity.
Net patient revenue Info Net patient revenue — what the home actually collects for resident care, after contractual allowances, bad debt and discounts are subtracted from its gross charges (CMS cost report, Worksheet G-3). It covers resident care only; money the home earns from other sources is shown separately as "Other income."
$6.3M
Net patient income Info Net patient income: net patient revenue minus the home's total operating expenses. A positive figure means it earns more from resident care than it spends to deliver it; a negative figure means the opposite. It excludes non-operating "other income."
$329.0K
For-profit Operated by a single business entity.
Net patient revenue Info Net patient revenue — what the home actually collects for resident care, after contractual allowances, bad debt and discounts are subtracted from its gross charges (CMS cost report, Worksheet G-3). It covers resident care only; money the home earns from other sources is shown separately as "Other income."
$6.3M
Net patient income Info Net patient income: net patient revenue minus the home's total operating expenses. A positive figure means it earns more from resident care than it spends to deliver it; a negative figure means the opposite. It excludes non-operating "other income."
$329.0K
Other income Info Money the home earns outside of resident care — such as investments, grants, rentals and other non-operating sources (CMS cost report, Worksheet G-3). It is tracked separately from net patient revenue: it is not part of that figure, and it is not included in net patient income.
$223.6K
Payroll costs Info Staff salaries plus wage-related costs — benefits such as payroll taxes, health insurance and retirement — from the home's own accounting records (CMS cost report, Worksheet A). Contract or agency labor is counted separately, under other operating costs.
$2.4M 38.1% of net patient revenue Info Payroll as a share of revenue: staff salaries and wage-related benefits divided by net patient revenue. A higher figure means more of each revenue dollar goes to staff pay.
Other operating costs Info Everything it costs to run the home apart from payroll — food, utilities, supplies, maintenance, contract labor and administration. Calculated as total operating expense minus payroll (staff salaries and wage-related benefits).
$3.6M
Total costs Info The home's total operating expense for the year — all the costs of running it, salaries included (CMS cost report, Worksheet G-3).
$6.0M

Who this home usually serves

TYPE OF STAY

Mix of rehab and long-term care

This home supports both short-term rehab and long-term care, with residents staying for a wide range of durations.

Most new residents arrive under private pay (53% of admissions), and a typical private pay stay runs around 2 - 3 months.

Admissions
161 total

Coverage residents most often arrive under.

Medicare 34%
Private pay 53%
Medicaid 14%
Discharges
156 total

Coverage residents most often leave under.

Medicare 21%
Private pay 65%
Medicaid 14%

Places of interest near Ash Flat Healthcare and Rehabilitation Center

Address 66 Ozbirn Lane, Ash Flat, AR 72513

Calculate Travel Distance to Ash Flat Healthcare and Rehabilitation Center

Add your location

Address

Compare Nursing Homes around the area

The information below is reported by the Arkansas Department of Human Services, Office of Long Term Care.

Ash Flat Healthcare and Rehabilitation Center
NH
HC
MC
PC
RC
Ash Flat - 105 - 16 -
Barnes Healthcare
NH
MC
Lonoke - 141 A+ 38 Private / Shared Rooms
Timberlane Health & Rehab
NH
MC
RC
El Dorado - 106 A+ 33 -
Bear Creek Healthcare LLC
NH
De Queen - 131 - 35 -
Maple Healthcare
NH
Hazen - 70 - 21 Private / Shared Rooms

Frequently Asked Questions about Ash Flat Healthcare and Rehabilitation Center

Who is the owner of Ash Flat Healthcare and Rehabilitation Center?

Ash Flat Healthcare and Rehabilitation Center is legally operated by Sharp SNF Operations, LLC, and administered by Misty French.

Is Ash Flat Healthcare and Rehabilitation Center in a walkable area?

Ash Flat Healthcare and Rehabilitation Center has a walk score of 16. Car-dependent. Most errands require a car, with limited nearby walkable options.

What is the occupancy rate at Ash Flat Healthcare and Rehabilitation Center?

Ash Flat Healthcare and Rehabilitation Center's occupancy is 54.3%.

Does Ash Flat Healthcare and Rehabilitation Center operate as a for-profit or non-profit?

Ash Flat Healthcare and Rehabilitation Center is registered as a for-profit in AR.

Who is the administrator of Ash Flat Healthcare and Rehabilitation Center?

Misty French is the administrator of Ash Flat Healthcare and Rehabilitation Center.

How many beds does Ash Flat Healthcare and Rehabilitation Center have?

Ash Flat Healthcare and Rehabilitation Center has 105 beds.

Are there photos of Ash Flat Healthcare and Rehabilitation Center?

Yes — there are 4 photos of Ash Flat Healthcare and Rehabilitation Center in the photo gallery on this page.

Guides for Better Senior Living

Care Cost Calculator: See Prices in Your Area

Nursing Home Data Explorer

Don’t Wait Too Long: 7 Red Flag Signs Your Parent Needs Assisted Living Now

The True Cost of Assisted Living in 2025 – And How Families Are Paying For It

Understanding Senior Living Costs: Pricing Models, Discounts & Financial Assistance