North Hills Life Care and Rehab
Nursing Home, Memory Care & Respite Care · Fayetteville, AR
CMS overall rating Info CMS (the Centers for Medicare & Medicaid Services) is the federal agency that rates nursing home quality. Its Overall Rating runs from 1 to 5 stars, combining health inspections, staffing, and quality measures, with inspections weighted most heavily.

North Hills Life Care and Rehab

Nursing Home, Memory Care & Respite Care · Fayetteville, AR
CMS overall rating Info CMS (the Centers for Medicare & Medicaid Services) is the federal agency that rates nursing home quality. Its Overall Rating runs from 1 to 5 stars, combining health inspections, staffing, and quality measures, with inspections weighted most heavily.
Calculator: See prices in your area
North Hills Life Care and Rehab accepts Medicare, Medicaid, and private pay.

Overview of North Hills Life Care and Rehab

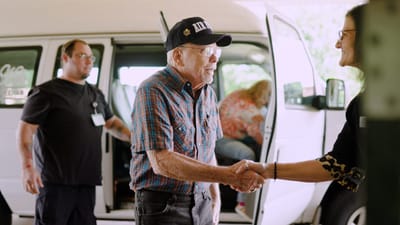
Mark Miller owns North Hills Life Care and Rehab, a 92-bed care facility run by Northwest Health and Rehab, Inc. on Appleby Road in Fayetteville, Arkansas. The building has been open for 21 years and currently runs at an 87 percent occupancy rate. Stays average about 93 days, a timeline that reflects a heavy daily focus on temporary post-hospital rehab and short-term recovery. To cover room rates and clinical costs, the business processes billing through standard private pay, traditional Medicare, and state Medicaid.

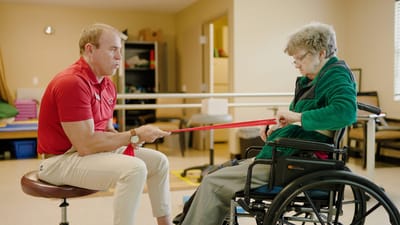
On the floor, the nursing crew delivers an average of 4 hours and 34 minutes of hands-on attention to each resident daily. This 24-hour staffing includes registered nurses, practical nurses, and assistants who run physical therapy routines in the on-site therapy gym and manage short-term respite stays.

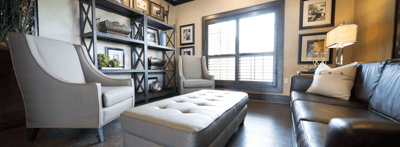
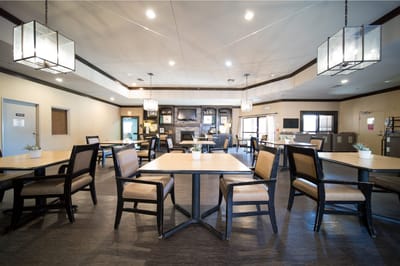
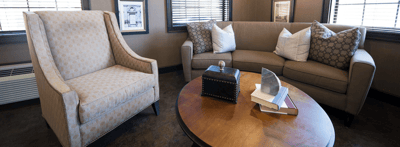
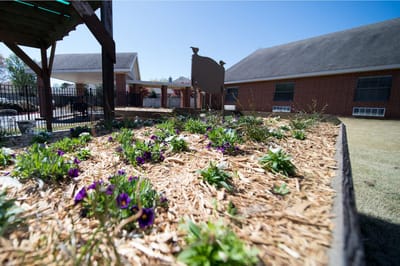
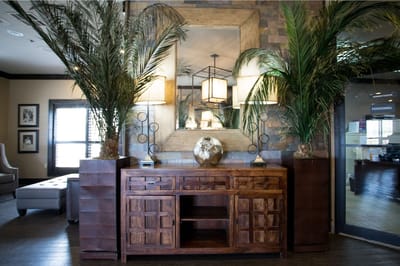
For day-to-day life, a certified dietary manager runs the kitchen to handle personal food allergies, while campus amenities include private rooms with showers, a social activities schedule, and an outdoor courtyard equipped with a gazebo. Because the surrounding neighborhood is car-dependent, visiting families will almost always need to drive to the property.

Interested individuals can call the front office to ask how the admissions process works or to check on current bed availability. The administrative coordinator can also provide information regarding recent health surveys from government inspectors, who previously noted compliance issues here with medication management, infection control protocols, care documentation, and resident safety procedures.

Quality ratings

Measured by Centers for Medicare & Medicaid Services (CMS)

Overall rating Info The Overall CMS Rating combines results from health inspections, staffing levels and quality measures. Health inspections carry the most weight. Staffing and quality scores can increase or decrease the final rating based on performance compared to state and national standards.
▲ 27.5% Above AR avg. ▲ 27.5% Above AR avg.AR average: 3.1Click the badge to see the full State ranking.Click here to see the full State ranking.
Health Inspection Info Based on the results of the facility's three most recent standard inspections and any complaint investigations. CMS reviews the number, scope, and severity of deficiencies, with more recent findings weighted more heavily.
▲ 3.8% Above AR avg. ▲ 3.8% Above AR avg.AR average: 2.9Click the badge to see the full State ranking.Click here to see the full State ranking.
Staffing Info Measures average nursing staff hours per resident per day, including Registered Nurses (RNs) and total nursing staff. Ratings are adjusted based on the level of care residents require and are compared to state and national benchmarks.
▼ 5.8% Below AR avg. ▼ 5.8% Below AR avg.AR average: 3.2Click the badge to see the full State ranking.Click here to see the full State ranking.
Quality Measures Info Based on clinical and physical health indicators reported to CMS, such as hospital readmissions, falls, pressure ulcers, and improvements in mobility. These measures reflect how well residents' health needs are being managed.
▲ 36.6% Above AR avg. ▲ 36.6% Above AR avg.AR average: 3.7Click the badge to see the full State ranking.Click here to see the full State ranking.

Staffing hours breakdown

Info Daily nursing hours per resident by staff type, reported to CMS. Higher is generally better — compare this facility to state and national averages to see where staffing stands.

Hours per resident per day — compared to Arkansas state averages

Total nursing care / resident Info Total adjusted nursing hours per resident per day, combining RN, LPN, and aide time. CMS adjusts this for case-mix so facilities can be fairly compared.
4h 34m per day
This facility Arkansas avg (4h 40m per day)
vs Arkansas avg
-2%

4 of 6 metrics below state avg

Standout metric LPN / LVN is +3% above state avg
Staff typeHours / Day / Residentvs state avg
Registered Nurse (RN) Info RNs hold the highest nursing license and can assess residents, interpret test results, and direct care plans. More RN hours per day often signals stronger clinical oversight and faster response to health changes. 23m per day ▼ 6% State avg: 24m per day · National avg: 41m per day
LPN / LVN Info Licensed Practical Nurses (LPNs) or Licensed Vocational Nurses (LVNs) deliver routine hands-on care — medication administration, wound dressing, and monitoring vital signs. They work under RN supervision and make up a large share of daily bedside care. 59m per day ▲ 3% State avg: 57m per day · National avg: 52m per day
Nurse Aide Info Certified Nurse Aides (CNAs) provide the most direct day-to-day assistance: bathing, dressing, feeding, and mobility. Nurse aide hours are typically the largest staffing category and directly affect residents' quality of life. 2h 41m per day ■ Avg State avg: 2h 44m per day · National avg: 2h 21m per day
Weekend Total Nursing Info Combined nursing hours (RN + LPN + Nurse Aide) per resident per day on weekends. Staffing often drops on weekends — this figure reveals whether the facility maintains adequate coverage outside of weekday hours. 3h 18m per day ▼ 5% State avg: 3h 29m per day · National avg: 3h 26m per day
Physical Therapist Info Hours per resident per day provided by licensed Physical Therapists (PTs) or PT Assistants. PT services help residents recover mobility after injury or illness and are especially important for post-acute (short-stay) rehabilitation. 1m per day ▼ 65% State avg: 2m per day · National avg: 4m per day
Weekend RN Info Registered nurse hours specifically on weekends. Facilities sometimes reduce RN presence on Saturdays and Sundays — a low weekend RN figure compared to weekday hours can indicate reduced clinical oversight when most administrative staff are absent. 15m per day ▼ 6% State avg: 16m per day · National avg: 29m per day

Capacity and availability

Avg. Length of Stay
93 days
Bed community size
92-bed community Rank #156 / 330Bed count — State benchmarkedThis home is ranked 156th out of 330 homes in Arkansas. Shows this facility's certified or reported bed count compared to other Arkansas facilities. Larger communities may offer more amenities, programs, and on-site services for residents and families.Rankings are based only on facilities in Arkansas that report data for that category. Facilities without available data are excluded from the ranking.Click the rank badge to see the full State ranking.Click here to see the full State ranking.
A larger shared setting that may offer more common spaces and organized community services.
Years in operation
21 years in operation
A longer operating history, which may indicate experience navigating regulations and delivering ongoing care.
Walk Score
Walk Score: 0 / 100 Rank #405 / 419Walk Score — State benchmarkedThis home is ranked 405th out of 419 homes in Arkansas. Shows how walkable this facility's neighborhood is compared to the average Walk Score across Arkansas facilities. Higher scores benefit residents, families, and staff.Rankings are based only on facilities in Arkansas that report data for that category. Facilities without available data are excluded from the ranking.Click the rank badge to see the full State ranking.Click here to see the full State ranking.
Car-dependent. Most errands require a car, with limited nearby walkable options.

About this community

Occupancy

Occupancy rate
87%
Higher than the Arkansas average: 71.3%
Occupied beds
80 / 92
Average occupied beds in Arkansas homes 77 beds

License Details

Facility TypeSkilled Nursing Facility With Dual Certified Beds (medicaid/medicare)
CountyWashington
CMS Certification Number045398
Certification TypeMedicaid / Medicare

Ownership & Operating Entity

North Hills Life Care and Rehab is legally operated by Northwest Health and Rehab, Inc., and administered by Rochelle Johnson.

Owner NameNorthwest Health And Rehab, Inc
Profit StatusFor-profit

Type Of Units

Medicaid and Medicare
92 units
Total beds
92 units

Staffing

Key information about the people who lead and staff this community.

Leadership

ContactMrs. Amy Rollins, Operations Coordinator

Therapy & Rehabilitation

2 services
Rehabilitation Services
Respite Care

Staffing & Medical

1 service
24-Hour Staffing

Contact Information

Fax479-444-9090

Amenities & Lifestyle

Private Rooms With Showers
Large Communal Dining Space
Dedicated Activity Area
Therapy Gym With State-Of-The-Art Equipment
Outdoor Courtyard With Gazebo
Activities
Specific ProgramsShort-Term Rehab, Additional Resources

Contact North Hills Life Care and Rehab

Inspection History

In Arkansas, the Department of Human Services, Office of Long Term Care is authorized to conduct unannounced inspections and issue official quality of care reports for all senior living providers.

Since 2022 · 4 years of data 43 deficiencies

Inspection Scorecard Info This scorecard compares key inspection, deficiency, and complaint metrics at this facility against the Arkansas state average. Metrics rated ≥15% worse than average are highlighted in red; those ≥15% better are highlighted in green.

Since 2022 vs. Arkansas state average
Overall vs. AR average 2 Worse Metrics worse than Arkansas average:
• Total deficiencies (105% above)
• Deficiencies per year (104% above)
0 Better No metrics in this bucket.
Latest Inspection August 22, 2024 Routine

Deficiencies Info Deficiencies are formal regulatory issues recorded during state inspections.

This FacilityAR Averagevs. AR Avg
Total deficiencies Info Formal regulatory issues recorded by inspectors across all inspection types. 4321 This facility has 105% more total deficiencies than a typical Arkansas nursing home (43 vs. AR avg 21).↑ 105% worse
Deficiencies per year Info Average deficiencies per year since 2022. 10.85.3 This facility has 104% more deficiencies per year than a typical Arkansas nursing home (10.8 vs. AR avg 5.3).↑ 104% worse

Inspection Reports Summary Info An editor-reviewed summary of the themes and findings across this facility's recent inspection reports.

  • August 22, 2024 inspection found 4 deficiencies including privacy violations, medication administration errors, improper medication storage, and infection control breaches during IV care.
  • May 7, 2024 complaint investigation identified failure to notify a resident’s representative about medication changes and missing surgical history documentation for a deep brain stimulator.
  • June 2, 2023 routine inspection cited 5 deficiencies in resident fund management, inaccurate assessments, incomplete oxygen therapy care plans, unsafe respiratory care, and unsanitary food service practices.

Health Inspection History

Inspections since 2022
Total health inspections 4

Arkansas average 4.2


Last Health inspection on Aug 2024

Total health citations
24

Arkansas average 21.8

Citations per inspection
6

Arkansas average 5.32


Health citations are formal notices following inspections when they fail to comply with safety and care standards.

22 of 24 citations resulted from standard inspections; and 2 of 24 resulted from complaint investigations.

Breakdown of citation severity (last 4 years)
Critical health citations
0
100% better than Arkansas average

Arkansas average: 0.4


Serious health citations
0
100% better than Arkansas average

Arkansas average: 0.2

0 critical citations Arkansas average: 0.4

0 serious citations Arkansas average: 0.2

24 moderate citations Arkansas average: 20.9

0 minor citations Arkansas average: 0.4
Citations history (last 4 years)
Infection Control moderate citation Aug 22, 2024
Corrected

Nutrition moderate citation Aug 22, 2024
Corrected

Pharmacy moderate citation Aug 22, 2024
Corrected

Quality of Care moderate citation Aug 22, 2024
Corrected

Staffing Data

Reporting period: October 1 – December 31, 2025 (Q4 2025). Source: CMS Payroll-Based Journal report.

Total staff 132
Employees 97
Contractors 35
Staff to resident ratio 1.57 : 1
0% compared with Arkansas average
Arkansas average ratio: 1.59 : 1 Arkansas average ratio: 1.59 : 1See full Arkansas ranking
Avg staff/day 45
Average shift 8 hours
0% compared with Arkansas average
Arkansas average: 8 hours Arkansas average shift: 8 hoursSee full Arkansas ranking
Total staff hours (quarter) 33,082

Nursing staff breakdown

Q4 2025 · Oct 1 – Dec 31 More info This data comes from the CMS Payroll-Based Journal report covering October 1 – December 31, 2025.
Registered Nurse

Manages medical care and health needs.

RN Staff Info All 8 RN Staff are full-time employees. No contractors work on this role. 8
Average shift length Info Average shift length. Calculated as total hours divided by days worked and average staff per day. 8.5 hours
Licensed Practical Nurse

Assists with medical care and medications.

LPN Staff Info All 16 LPN Staff are full-time employees. No contractors work on this role. 16
Average shift length Info Average shift length. Calculated as total hours divided by days worked and average staff per day. 8 hours
Certified Nursing Assistant

Helps with daily care and mobility.

CNA Staff Info All 53 CNA Staff are full-time employees. No contractors work on this role. 53
Average shift length Info Average shift length. Calculated as total hours divided by days worked and average staff per day. 8.5 hours

Contractor staffing

Q4 2025 · Oct 1 – Dec 31 More info This data comes from the CMS Payroll-Based Journal report covering October 1 – December 31, 2025.

Total hours from contractors

4.4%

1,453 contractor hours this quarter

Respiratory Therapy Technician: 7 Physical Therapy Assistant: 6 Physical Therapy Aide: 5 Clinical Nurse Specialist: 4 Speech Language Pathologist: 4 Qualified Social Worker: 4 Occupational Therapy Aide: 2 Occupational Therapy Assistant: 2 Medical Director: 1

Staff by category

Q4 2025 · Oct 1 – Dec 31 More info This data comes from the CMS Payroll-Based Journal report covering October 1 – December 31, 2025.
Certified Nursing Assistant5305318,16992100%8.5
Licensed Practical Nurse160165,00192100%8
RN Director of Nursing5052,2528289%8.3
Registered Nurse8081,3788896%8.5
Medication Aide/Technician2021,1298693%10
Clinical Nurse Specialist5499278491%6
Other Dietary Services Staff2028396773%7.6
Nurse Aide in Training3035796975%7.7
Dental Services Staff1015036368%8
Administrator1014886166%8
Nurse Practitioner1014886166%8
Speech Language Pathologist0444786773%6.2
Physical Therapy Aide0554466975%5.9
Qualified Social Worker0441366470%2.1
Respiratory Therapy Technician077874347%2
Physical Therapy Assistant066724751%1.4
Occupational Therapy Aide0225589%6.9
Occupational Therapy Assistant0222933%9.5
Medical Director011281415%2
53 Certified Nursing Assistant
% of Days 100%
16 Licensed Practical Nurse
% of Days 100%
5 RN Director of Nursing
% of Days 89%
8 Registered Nurse
% of Days 96%
2 Medication Aide/Technician
% of Days 93%
9 Clinical Nurse Specialist
% of Days 91%
2 Other Dietary Services Staff
% of Days 73%
3 Nurse Aide in Training
% of Days 75%
1 Dental Services Staff
% of Days 68%
1 Administrator
% of Days 66%
1 Nurse Practitioner
% of Days 66%
4 Speech Language Pathologist
% of Days 73%
5 Physical Therapy Aide
% of Days 75%
4 Qualified Social Worker
% of Days 70%
7 Respiratory Therapy Technician
% of Days 47%
6 Physical Therapy Assistant
% of Days 51%
2 Occupational Therapy Aide
% of Days 9%
2 Occupational Therapy Assistant
% of Days 3%
1 Medical Director
% of Days 15%

Penalties and fines

Federal penalties imposed by CMS for regulatory violations, including civil money penalties (fines) and denials of payment for new Medicare/Medicaid admissions.

Source: CMS Penalties Database

No penalties in the past 3 years

No civil money penalties or payment denials were reported in the last 3 years.

Quality of care over time

These measures show how residents usually do over time at this home, based on health outcomes and preventive care.

High-risk clinical events score Info A composite score based on pressure ulcers, falls with injury, weight loss, walking ability decline, and activities of daily living decline. 8.1
In line with Arkansas average

Arkansas average: 7.7

Functional decline score Info A composite score based on activities of daily living decline, walking ability decline, and incontinence. 13.9
In line with Arkansas average

Arkansas average: 13.3

Long-stay resident measures
Significantly above average Arkansas avg: 4.2 Info CMS star rating based on long-stay quality measure performance. 5 stars = significantly above average, 1 star = significantly below average.
Need for Help with Daily Activities Increased Info Percent of long-stay residents whose need for help with daily activities has increased 15.7%
37% worse than Arkansas average

Arkansas average: 11.5%

Walking Ability Worsened Info Percent of long-stay residents whose ability to move independently worsened 11.7%
12% better than Arkansas average

Arkansas average: 13.4%

Low Risk Residents with Bowel/Bladder Incontinence Info Percent of low risk long-stay residents who lose control of their bowels or bladder 14.1%
7% better than Arkansas average

Arkansas average: 15.1%

Falls with Major Injury Info Percent of long-stay residents experiencing one or more falls with major injury 4.6%
16% worse than Arkansas average

Arkansas average: 3.9%

High Risk Residents with Pressure Ulcers Info Percent of long-stay high risk residents with pressure ulcers 3.0%
37% better than Arkansas average

Arkansas average: 4.7%

Urinary Tract Infection Info Percent of long-stay residents with a urinary tract infection 0.7%
45% better than Arkansas average

Arkansas average: 1.3%

Lost Too Much Weight Info Percent of long-stay residents who lose too much weight 5.2%
5% worse than Arkansas average

Arkansas average: 5.0%

Depressive Symptoms Info Percent of long-stay residents who have depressive symptoms 0.0%
100% better than Arkansas average

Arkansas average: 1.5%

Antipsychotic Use Info Percent of long-stay residents who received an antipsychotic medication 4.4%
58% better than Arkansas average

Arkansas average: 10.5%

Pneumococcal Vaccine Info Percent of long-stay residents assessed and appropriately given the pneumococcal vaccine 99.7%
6% better than Arkansas average

Arkansas average: 94.4%

Influenza Vaccine Info Percent of long-stay residents assessed and appropriately given the seasonal influenza vaccine 97.4%
In line with Arkansas average

Arkansas average: 96.2%

Hospitalizations per 1,000 days Info Number of hospitalizations per 1,000 long-stay resident days. 1.19
40% better than Arkansas average

Arkansas average: 1.97

ED visits per 1,000 days Info Number of outpatient emergency department visits per 1,000 long-stay resident days. 1.46
33% better than Arkansas average

Arkansas average: 2.18

Short-stay resident measures
Significantly above average Arkansas avg: 2.7 Info CMS star rating based on short-stay quality measure performance. 5 stars = much above average, 1 star = much below average.
Pneumococcal Vaccine Info Percent of short-stay residents assessed and appropriately given the pneumococcal vaccine 100.0%
24% better than Arkansas average

Arkansas average: 80.9%

Antipsychotic medication increase Info Percent of short-stay residents who newly received an antipsychotic medication 0.0%
100% better than Arkansas average

Arkansas average: 1.5%

Influenza Vaccine Info Percent of short-stay residents assessed and appropriately given the seasonal influenza vaccine 84.4%
9% better than Arkansas average

Arkansas average: 77.7%

Re-hospitalized after SNF stay Info Percentage of short-stay residents who were re-hospitalized after their nursing home admission. 12.2%
52% better than Arkansas average

Arkansas average: 25.2%

Emergency department visits Info Percentage of short-stay residents who had an outpatient emergency department visit. 19.0%
38% worse than Arkansas average

Arkansas average: 13.8%

Falls with major injury Info Percentage of SNF residents who experience falls with major injury during their stay. 0.0%
100% better than Arkansas average

Arkansas average: 0.8%

Ability to care for self at discharge Info Percentage of residents at or above expected ability to care for themselves at discharge. 63.6%
19% better than Arkansas average

Arkansas average: 53.7%

Successful return to home or community Info Rate of successful return to home or community from a skilled nursing facility. 49.9%
In line with Arkansas average

Arkansas average: 50.6%

Breakdown by payment type

Medicare

32% of new residents, usually for short-term rehab.

Typical stay 27 days

Private pay

61% of new residents, often for short stays.

Typical stay 1 - 2 months

Medicaid

7% of new residents, often for long-term daily care.

Typical stay 2 - 3 years

Facility Characteristics

Source: CMS Long-Term Care Facility Characteristics (Data as of Jan 2026)

Total residents 84
Medicare
16
19% of residents
Medicaid
53
63.1% of residents
Private pay or other
15
17.9% of residents
Programs & Services
Residents Group

Residents meet regularly to discuss policies, care quality, and activities

Active Resident Council

Organized group of residents that meets regularly to discuss facility policies, quality of life, and activities.

Finances and operations

Based on CMS SNF Cost Report for fiscal year ending in 12/2023.

For-profit
Corporation
Net patient revenue Info Net patient revenue — what the home actually collects for resident care, after contractual allowances, bad debt and discounts are subtracted from its gross charges (CMS cost report, Worksheet G-3). It covers resident care only; money the home earns from other sources is shown separately as "Other income."
$9.1M
Net patient income Info Net patient income: net patient revenue minus the home's total operating expenses. A positive figure means it earns more from resident care than it spends to deliver it; a negative figure means the opposite. It excludes non-operating "other income."
$20.3K
For-profit Corporation
Net patient revenue Info Net patient revenue — what the home actually collects for resident care, after contractual allowances, bad debt and discounts are subtracted from its gross charges (CMS cost report, Worksheet G-3). It covers resident care only; money the home earns from other sources is shown separately as "Other income."
$9.1M
Net patient income Info Net patient income: net patient revenue minus the home's total operating expenses. A positive figure means it earns more from resident care than it spends to deliver it; a negative figure means the opposite. It excludes non-operating "other income."
$20.3K
Other income Info Money the home earns outside of resident care — such as investments, grants, rentals and other non-operating sources (CMS cost report, Worksheet G-3). It is tracked separately from net patient revenue: it is not part of that figure, and it is not included in net patient income.
$13.1K
Payroll costs Info Staff salaries plus wage-related costs — benefits such as payroll taxes, health insurance and retirement — from the home's own accounting records (CMS cost report, Worksheet A). Contract or agency labor is counted separately, under other operating costs.
$4.5M 49.4% of net patient revenue Info Payroll as a share of revenue: staff salaries and wage-related benefits divided by net patient revenue. A higher figure means more of each revenue dollar goes to staff pay.
Other operating costs Info Everything it costs to run the home apart from payroll — food, utilities, supplies, maintenance, contract labor and administration. Calculated as total operating expense minus payroll (staff salaries and wage-related benefits).
$4.6M
Total costs Info The home's total operating expense for the year — all the costs of running it, salaries included (CMS cost report, Worksheet G-3).
$9.0M

Who this home usually serves

TYPE OF STAY

Primarily short stays

Residents typically stay for brief periods, with frequent admissions and discharges throughout the year.

Most new residents arrive under private pay (61% of admissions), and a typical private pay stay runs around 1 - 2 months.

Admissions
314 total

Coverage residents most often arrive under.

Medicare 32%
Private pay 61%
Medicaid 7%
Discharges
315 total

Coverage residents most often leave under.

Medicare 34%
Private pay 58%
Medicaid 8%

Places of interest near North Hills Life Care and Rehab

Address 7.7 miles from city center Info Estimated distance in miles from Fayetteville's city center to North Hills Life Care and Rehab's address, calculated via Google Maps.

Calculate Travel Distance to North Hills Life Care and Rehab

Add your location

Address

Compare Nursing Homes around Fayetteville

The information below is reported by the Arkansas Department of Human Services, Office of Long Term Care.

5 facilities compared · CMS & AR Dept. of Health data

Katherines Place at Wedington
NH
MC
RC
Fayetteville
109
Facility 109
AR AVG 84
Rank #101 / 330
86.2% +21%4.61 +25%-1%$0266.5-104A+
0
Facility 0
AR AVG 34
Rank #405 / 419
Kelly Souza$11.3M$5.3M46.5%45434
North Hills Life Care and Rehab
NH
MC
RC
Fayetteville
92
Facility 92
AR AVG 84
Rank #156 / 330
86.8% +22%4.57 +12%-2%$0246.0-80-
0
Facility 0
AR AVG 34
Rank #405 / 419
Mark Miller$9.1M$4.5M49.4%45398
Fayetteville Health and Rehabilitation Center
NH
MC
Fayetteville (North Old Missouri Road)
140
Facility 140
AR AVG 84
Rank #17 / 330
65.7% -8%4.31 -23%-8%$0389.5-92-
15
Facility 15
AR AVG 34
Rank #314 / 419
Jesse White$11.5M$4.8M41.6%45220
Arkansas State Veterans Home at Fayetteville
NH
HC
NC
Fayetteville (Evelyn Hills Shopping Center)
90
Facility 90
AR AVG 84
Rank #160 / 330
52.3% -27%6.92 +56%+48%$04210.5-58-
61
Facility 61
AR AVG 34
Rank #44 / 419
State Of Arkansas---45417
Butterfield Trail Village
NH
AL
IL
Fayetteville (East Joyce Boulevard)
87
Facility 87
AR AVG 84
Rank #167 / 330
46.0% -35%7.73 +19%+65%$58.0k213.0338A+
39
Facility 39
AR AVG 34
Rank #165 / 419
Michael Spears$15.2M$9.6M63.2%45125

Financial Assistance for
Nursing Home in Arkansas

North Hills Life Care and Rehab is located in Fayetteville, Arkansas.
Here are the financial assistance programs available to residents in Arkansas.

Get Financial aid guidance

ARChoices

Arkansas Medicaid ARChoices

Age 65+ or 21+ with disability
General Arkansas resident, Medicaid- eligible, nursing home-level care need.
Income Limits (2025) ~$2,829/month 300% FBR, individual
Asset Limits $2,000 (individual), $3,000 (couple).
AR

Rural focus; possible waitlists.

Benefits
Personal care (5-7 hours/day) Meals ($7/meal) Respite care (240 hours/year) Adult day services ($60/day)

Choices in Living Resource Center

Arkansas Choices in Living

Age 60+
General Arkansas resident.
Income Limits No strict limit; prioritizes low-income.
Asset Limits Not applicable.
AR

Limited direct funding; mostly referral-based.

Benefits
Care coordination Limited respite (up to 5 days/year) Transportation assistance (~5 trips/month)

Living Choices Assisted Living Waiver

Arkansas Medicaid Living Choices Assisted Living Waiver

Age 65+
General Arkansas resident, requires nursing home-level care, lives in a Level II assisted living facility.
Income Limits (2025) ~$2,829/month 300% FBR, individual
Asset Limits $2,000 (individual), $3,000 (couple); spousal rules apply.
AR

Limited provider network; excludes Level I facilities (no nursing services).

Benefits
Personal care (~5 hours/day) Medication management Nursing Activities Transportation

Program of All-Inclusive Care for the Elderly (PACE)

Arkansas Medicaid PACE

Age 55+
General Arkansas resident, nursing home-level care, safe with PACE support.
Income Limits (2025) ~$2,829/month 300% FBR
Asset Limits $2,000 (individual), $3,000 (couple).
AR

Limited geographic availability.

Benefits
Primary/preventive care Personal care (5-7 hours/day) Meals Transportation Therapy

Arkansas State Plan Personal Care

Arkansas Medicaid Personal Care Program

Age
General Any age, Arkansas resident, needs ADL/IADL help, Medicaid-eligible.
Income Limits (2025) ~$1,004/month individual
Asset Limits $9,660 (individual), $14,470 (couple).
AR

No nursing home-level care requirement.

Benefits
Personal care (~4-6 hours/day) Homemaker services (e.g., meal prep)

Frequently Asked Questions about North Hills Life Care and Rehab

Who is the owner of North Hills Life Care and Rehab?

North Hills Life Care and Rehab is legally operated by Northwest Health and Rehab, Inc., and administered by Rochelle Johnson.

What is the occupancy rate at North Hills Life Care and Rehab?

North Hills Life Care and Rehab's occupancy is 87%.

Does North Hills Life Care and Rehab operate as a for-profit or non-profit?

North Hills Life Care and Rehab is registered as a for-profit in AR.

Who is the administrator of North Hills Life Care and Rehab?

Rochelle Johnson is the administrator of North Hills Life Care and Rehab.

How many beds does North Hills Life Care and Rehab have?

North Hills Life Care and Rehab has 92 beds.

Are there photos of North Hills Life Care and Rehab?

Yes — there are 14 photos of North Hills Life Care and Rehab in the photo gallery on this page.

What is the address of North Hills Life Care and Rehab?

North Hills Life Care and Rehab is located at 27 E. Appleby Road, Fayetteville, AR 72703.

Guides for Better Senior Living

Care Cost Calculator: See Prices in Your Area

Nursing Home Data Explorer

Don’t Wait Too Long: 7 Red Flag Signs Your Parent Needs Assisted Living Now

The True Cost of Assisted Living in 2025 – And How Families Are Paying For It

Understanding Senior Living Costs: Pricing Models, Discounts & Financial Assistance