


Total health inspections
15
Rhode Island average 8.3
Last Health inspection on Aug 2025


Located on Cumberland Hill Road in Woonsocket, Rhode Island, Oakland Grove Health Care Center is a nursing home operated by Girard Health Care Holdings. The 178-bed facility has served the community for 34 years. It’s located in a very walkable neighborhood with a Walk Score of 87. Medicare, Medicaid, and private pay are accepted, giving families several ways to cover care costs.
The facility focuses on rehabilitation and short-term recovery. There are dedicated rehabilitation services and respite care programs. Residents stay an average of 121 days, including post-acute rehabilitation residents recovering from surgery, hospitalization, or acute illness, along with some longer-term residents.
Daily nurse staffing averages 3 hours and 16 minutes per resident. Registered nurses, nurse aides, and licensed practical nurses provide consistent support throughout the day.
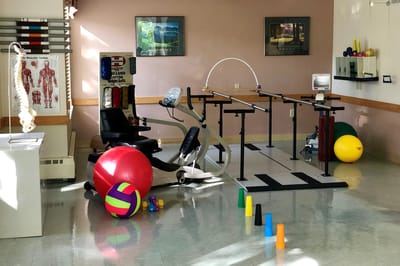
The Wellness Center gives residents space for therapeutic activities, while the recreation room supports social programs and resident engagement. Dining takes place in a restaurant-style setting where three meals are served daily. Menus feature local ingredients and seasonal specialties. Residents also have access to outdoor shaded seating, a hair salon, and common areas for visits and activities.
Its location in a very walkable neighborhood makes the facility accessible to visiting family members and close to local services.
| Staff type | Hours / Day / Resident | vs state avg |
|---|---|---|
|
Registered Nurse (RN)
| 24m per day | ▼ 48% State avg: 46m per day · National avg: 41m per day |
|
LPN / LVN
| 45m per day | ▲ 57% State avg: 29m per day · National avg: 52m per day |
|
Nurse Aide
| 2h 12m per day | ▼ 11% State avg: 2h 28m per day · National avg: 2h 21m per day |
|
Weekend Total Nursing
| 3h 3m per day | ▼ 8% State avg: 3h 18m per day · National avg: 3h 26m per day |
|
Physical Therapist
| 3m per day | ▲ 14% State avg: 3m per day · National avg: 4m per day |
|
Weekend RN
| 15m per day | ▼ 55% State avg: 34m per day · National avg: 29m per day |
In Rhode Island, the Department of Health, Center for Health Facilities Regulation is the primary authority for inspecting, licensing, and reporting on all long-term care facilities.
Deficiencies
| This Facility | RI Average | vs. RI Avg |
|---|---|---|---|
|
Total deficiencies
| 89 | 34 | This facility has 162% more total deficiencies than a typical Rhode Island nursing home (89 vs. RI avg 34).↑ 162% worse |
|
Deficiencies per year
| 17.8 | 6.8 | This facility has 162% more deficiencies per year than a typical Rhode Island nursing home (17.8 vs. RI avg 6.8).↑ 162% worse |
Rhode Island average 8.3
Last Health inspection on Aug 2025
Rhode Island average 28.1
Rhode Island average 3.48
Health citations are formal notices following inspections when they fail to comply with safety and care standards.
14 of 43 citations resulted from standard inspections; 20 of 43 resulted from complaint investigations; and 9 of 43 came from combined inspections (standard and complaint).
Rhode Island average: 1.6
Rhode Island average: 1.7
Reporting period: October 1 – December 31, 2025 (Q4 2025). Source: CMS Payroll-Based Journal report.
Manages medical care and health needs.
Assists with medical care and medications.
Helps with daily care and mobility.
Total hours from contractors
108 contractor hours this quarter
| Certified Nursing Assistant | 81 | 0 | 81 | 26,999 | 92 | 100% | 7.7 |
| Licensed Practical Nurse | 30 | 0 | 30 | 8,608 | 92 | 100% | 8 |
| Registered Nurse | 6 | 0 | 6 | 2,977 | 92 | 100% | 10.5 |
| Other Dietary Services Staff | 6 | 0 | 6 | 2,388 | 92 | 100% | 7.4 |
| Clinical Nurse Specialist | 6 | 0 | 6 | 2,002 | 82 | 89% | 7.7 |
| Mental Health Service Worker | 4 | 0 | 4 | 1,384 | 82 | 89% | 7.4 |
| Medication Aide/Technician | 2 | 0 | 2 | 1,211 | 88 | 96% | 8.3 |
| RN Director of Nursing | 3 | 0 | 3 | 1,127 | 65 | 71% | 7.7 |
| Speech Language Pathologist | 2 | 0 | 2 | 853 | 79 | 86% | 7 |
| Respiratory Therapy Technician | 2 | 0 | 2 | 736 | 64 | 70% | 6.8 |
| Physical Therapy Aide | 3 | 0 | 3 | 712 | 68 | 74% | 5.7 |
| Dietitian | 1 | 0 | 1 | 473 | 57 | 62% | 8.3 |
| Administrator | 1 | 0 | 1 | 416 | 52 | 57% | 8 |
| Occupational Therapy Aide | 2 | 0 | 2 | 197 | 32 | 35% | 5.7 |
| Nurse Practitioner | 1 | 0 | 1 | 157 | 18 | 20% | 8.7 |
| Physical Therapy Assistant | 1 | 0 | 1 | 147 | 30 | 33% | 4.9 |
| Occupational Therapy Assistant | 0 | 1 | 1 | 101 | 31 | 34% | 3.3 |
| Medical Director | 0 | 1 | 1 | 7 | 7 | 8% | 1 |
Includes penalties issued in 2024-2025
Federal penalties imposed by CMS for regulatory violations, including civil money penalties (fines) and denials of payment for new Medicare/Medicaid admissions.
Source: CMS Penalties Database (Data as of Jan 2026)
Rhode Island average: $94K
Rhode Island average: 2.8
Rhode Island average: 0.4
Penalties are imposed by CMS for violations of federal nursing home regulations.
3 penalties in the past 3 years
Multiple penalties were reported in the last 3 years.
Last updated: Jan 2026
These measures show how residents usually do over time at this home, based on health outcomes and preventive care.
Rhode Island average: 10.3
Rhode Island average: 20.2
Rhode Island average: 19.5%
Rhode Island average: 18.2%
Rhode Island average: 22.9%
Rhode Island average: 3.7%
Rhode Island average: 4.7%
Rhode Island average: 2.3%
Rhode Island average: 5.4%
Rhode Island average: 13.5%
Rhode Island average: 21.5%
Rhode Island average: 93.1%
Rhode Island average: 95.3%
Rhode Island average: 76.2%
Rhode Island average: 2.0%
Rhode Island average: 78.2%
Rhode Island average: 25.1%
Rhode Island average: 15.8%
Rhode Island average: 0.8%
Rhode Island average: 53.7%
Rhode Island average: 50.6%
Quality measures are calculated from Minimum Data Set (MDS) assessments. For most measures, lower percentages indicate better care quality.
17% of new residents, usually for short-term rehab.
67% of new residents, often for short stays.
16% of new residents, often for long-term daily care.
Source: CMS Long-Term Care Facility Characteristics (Data as of Jan 2026)
Residents meet regularly to discuss policies, care quality, and activities
Organized group of residents that meets regularly to discuss facility policies, quality of life, and activities.
Data sourced from CMS Long-Term Care Facility Characteristics quarterly report. Payer mix reflects the current resident census by primary payment source.
Historical financial and operational data for Oakland Grove Health Care Center from 2012–2023, based on CMS SNF Cost Reports.
Based on CMS SNF Cost Report for fiscal year ending in 09/2023.
Residents typically stay for brief periods, with frequent admissions and discharges throughout the year.
Most new residents arrive under private pay (67% of admissions), and a typical private pay stay runs around 27 days.
Coverage residents most often arrive under.
Coverage residents most often leave under.
![]() 0.0 miles from city center
0.0 miles from city center
![]() Estimated distance in miles from Woonsocket's city center to Oakland Grove Health Care Center's address, calculated via Google Maps.
Estimated distance in miles from Woonsocket's city center to Oakland Grove Health Care Center's address, calculated via Google Maps.
Add your location
Oakland Grove Health Care Center is located in WOONSOCKET, Rhode Island.
Here are the financial assistance programs available to residents in Rhode Island.
Oakland Grove Health Care Center is legally operated by Brian Mcguinness, Administrator.
Oakland Grove Health Care Center has a walk score of 87. Very walkable. Most errands can be accomplished on foot, and many essentials are within a short walk.
According to RI state health department records, Oakland Grove Health Care Center's license number is LTC00718.
Oakland Grove Health Care Center's occupancy is 64.9%.
Oakland Grove Health Care Center is registered as a for-profit in RI.
Oakland Grove Health Care Center has 178 beds.
Yes — there are 4 photos of Oakland Grove Health Care Center in the photo gallery on this page.
Care Cost Calculator: See Prices in Your Area
Nursing Home Data Explorer
Don’t Wait Too Long: 7 Red Flag Signs Your Parent Needs Assisted Living Now
The True Cost of Assisted Living in 2025 – And How Families Are Paying For It
Understanding Senior Living Costs: Pricing Models, Discounts & Financial Assistance


