Valley Springs Rehabilitation and Health Center
Nursing Home, Memory Care & Respite Care · Van Buren, AR
CMS overall rating Info CMS (the Centers for Medicare & Medicaid Services) is the federal agency that rates nursing home quality. Its Overall Rating runs from 1 to 5 stars, combining health inspections, staffing, and quality measures, with inspections weighted most heavily.

Valley Springs Rehabilitation and Health Center

Nursing Home, Memory Care & Respite Care · Van Buren, AR
CMS overall rating Info CMS (the Centers for Medicare & Medicaid Services) is the federal agency that rates nursing home quality. Its Overall Rating runs from 1 to 5 stars, combining health inspections, staffing, and quality measures, with inspections weighted most heavily.
Calculator: See prices in your area
Valley Springs Rehabilitation and Health Center accepts Medicaid, Medicare, and private pay.

Overview of Valley Springs Rehabilitation and Health Center

Operated by Van Buren SNF Operations, LLC under owner Judy Digiacinto, Valley Springs Rehabilitation and Health Center is a skilled nursing facility in Van Buren, Arkansas. Medicaid, Medicare, and private pay are accepted, so families have several ways to arrange coverage for rehabilitation services and ongoing nursing care. With 105 beds, occupancy is at 91%. The average resident stay is 341 days, which includes post-acute recovery residents and those needing longer-term skilled nursing support.

Residents recovering from surgery, orthopedic procedures, or a hospital stay can access rehabilitation services as part of their care. A doctor is on site, and nursing coverage is available around the clock. Total nurse staffing averages about 4 hours and 33 minutes per resident each day. That staffing presence supports both daily clinical needs and ongoing medical oversight.

Inspection findings over time have included documentation practices and compliance with care-planning and infection-control protocols. The facility has addressed those findings without receiving immediate jeopardy citations or fines. Formal complaints have not been substantiated. During a tour, families should ask how these operational areas are monitored and what processes are used to stay compliant.

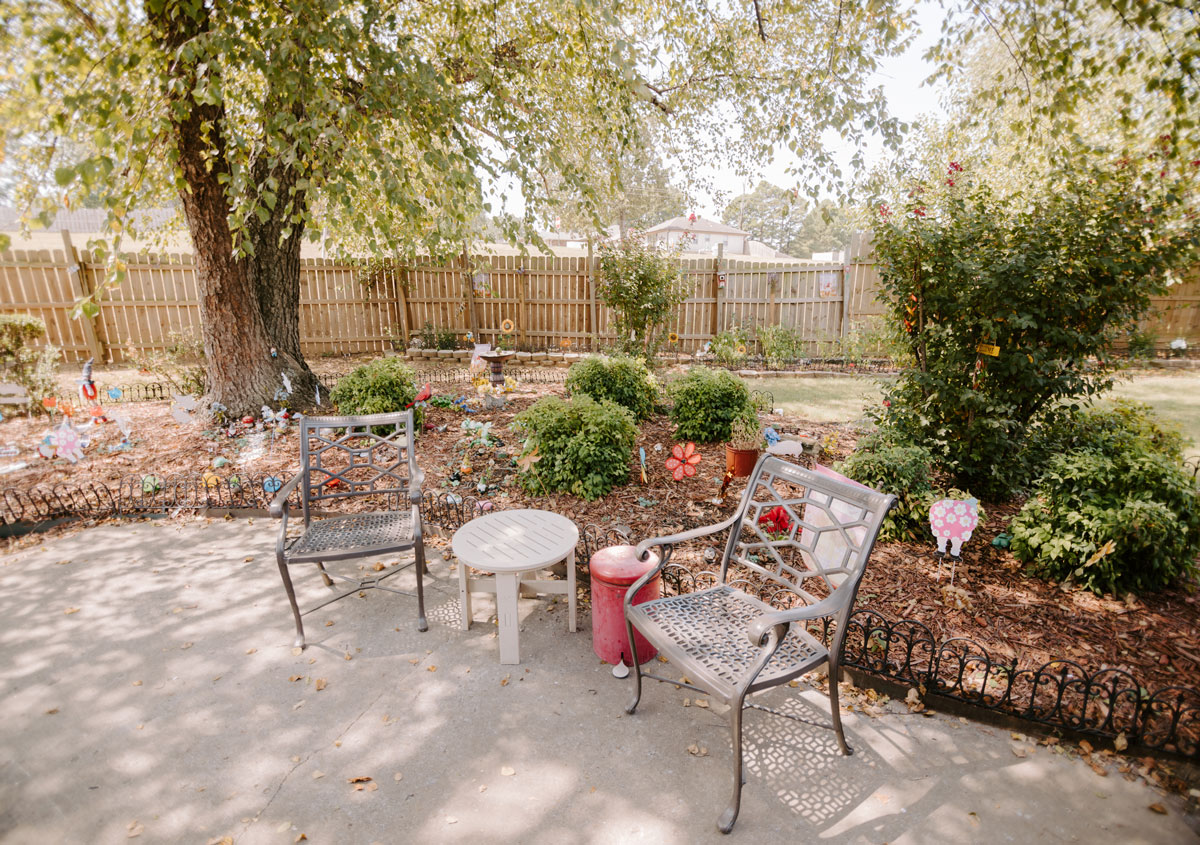
The facility is on Pointer Trail West in a moderately walkable area. Some errands can be managed on foot. Others require transportation. Family members visiting from nearby areas may find the location convenient. Van Buren also provides access to local medical services and community resources.

Quality ratings

Measured by Centers for Medicare & Medicaid Services (CMS)

Overall rating Info The Overall CMS Rating combines results from health inspections, staffing levels and quality measures. Health inspections carry the most weight. Staffing and quality scores can increase or decrease the final rating based on performance compared to state and national standards.
Health Inspection Info Based on the results of the facility's three most recent standard inspections and any complaint investigations. CMS reviews the number, scope, and severity of deficiencies, with more recent findings weighted more heavily.
Staffing Info Measures average nursing staff hours per resident per day, including Registered Nurses (RNs) and total nursing staff. Ratings are adjusted based on the level of care residents require and are compared to state and national benchmarks.
Quality Measures Info Based on clinical and physical health indicators reported to CMS, such as hospital readmissions, falls, pressure ulcers, and improvements in mobility. These measures reflect how well residents' health needs are being managed.

Staffing hours breakdown

Info Daily nursing hours per resident by staff type, reported to CMS. Higher is generally better — compare this facility to state and national averages to see where staffing stands.

Hours per resident per day — compared to state averages

Total nursing care / resident Info Total adjusted nursing hours per resident per day, combining RN, LPN, and aide time. CMS adjusts this for case-mix so facilities can be fairly compared.
4h 33m per day
vs avg

6 of 6 metrics below state avg

Staff typeHours / Day / Residentvs state avg
Registered Nurse (RN) Info RNs hold the highest nursing license and can assess residents, interpret test results, and direct care plans. More RN hours per day often signals stronger clinical oversight and faster response to health changes. 23m per day ▼ 4% State avg: 24m per day · National avg: 41m per day
LPN / LVN Info Licensed Practical Nurses (LPNs) or Licensed Vocational Nurses (LVNs) deliver routine hands-on care — medication administration, wound dressing, and monitoring vital signs. They work under RN supervision and make up a large share of daily bedside care. 52m per day ▼ 9% State avg: 57m per day · National avg: 52m per day
Nurse Aide Info Certified Nurse Aides (CNAs) provide the most direct day-to-day assistance: bathing, dressing, feeding, and mobility. Nurse aide hours are typically the largest staffing category and directly affect residents' quality of life. 2h 33m per day ▼ 6% State avg: 2h 43m per day · National avg: 2h 20m per day
Weekend Total Nursing Info Combined nursing hours (RN + LPN + Nurse Aide) per resident per day on weekends. Staffing often drops on weekends — this figure reveals whether the facility maintains adequate coverage outside of weekday hours. 3h 19m per day ▼ 5% State avg: 3h 29m per day · National avg: 3h 26m per day
Physical Therapist Info Hours per resident per day provided by licensed Physical Therapists (PTs) or PT Assistants. PT services help residents recover mobility after injury or illness and are especially important for post-acute (short-stay) rehabilitation. 1m per day ▼ 72% State avg: 2m per day · National avg: 4m per day
Weekend RN Info Registered nurse hours specifically on weekends. Facilities sometimes reduce RN presence on Saturdays and Sundays — a low weekend RN figure compared to weekday hours can indicate reduced clinical oversight when most administrative staff are absent. 10m per day ▼ 39% State avg: 16m per day · National avg: 28m per day

Capacity and availability

Avg. Length of Stay
341 days
Bed community size
105-bed community Rank #108 / 330Bed count — State benchmarkedThis home is ranked 108th out of 330 homes in Arkansas. Shows this facility's certified or reported bed count compared to other Arkansas facilities. Larger communities may offer more amenities, programs, and on-site services for residents and families.Rankings are based only on facilities in Arkansas that report data for that category. Facilities without available data are excluded from the ranking.Click the rank badge to see the full State ranking.Click here to see the full State ranking.
A larger shared setting that may offer more common spaces and organized community services.
Walk Score
Walk Score: 56 / 100 Rank #73 / 419Walk Score — State benchmarkedThis home is ranked 73rd out of 419 homes in Arkansas. Shows how walkable this facility's neighborhood is compared to the average Walk Score across Arkansas facilities. Higher scores benefit residents, families, and staff.Rankings are based only on facilities in Arkansas that report data for that category. Facilities without available data are excluded from the ranking.Click the rank badge to see the full State ranking.Click here to see the full State ranking.
Moderately walkable. Some errands can be accomplished on foot, with a mix of nearby amenities.

About this community

Occupancy

Occupancy rate
91%
Higher than the Arkansas average: 71.3%
Occupied beds
96 / 105
Average occupied beds in Arkansas homes 77 beds

License Details

Facility TypeSkilled Nursing Facility With Dual Certified Beds (medicaid / Medicare)
CountyCrawford
CMS Certification Number045138
Certification TypeMedicaid / Medicare

Ownership & Operating Entity

Valley Springs Rehabilitation and Health Center is legally operated by Van Buren SNF Operations, LLC., and administered by Judy Digiacinto.

Owner NameVan Buren Snf Operations, LLC
Profit StatusFor-profit

Type Of Units

Medicaid and Medicare
105 units
Total beds
105 units

Payment & Insurance

1 service
Accept Medicaid

Therapy & Rehabilitation

1 service
Rehabilitation Services

Staffing & Medical

2 services
Doctor on Staff
24-Hour Staffing

Contact Information

Fax479-474-2640

Contact Valley Springs Rehabilitation and Health Center

Inspection History

In Arkansas, the Department of Human Services, Office of Long Term Care is authorized to conduct unannounced inspections and issue official quality of care reports for all senior living providers.

Since 2022 · 4 years of data 30 deficiencies

Inspection Scorecard Info This scorecard compares key inspection, deficiency, and complaint metrics at this facility against the Arkansas state average. Metrics rated ≥15% worse than average are highlighted in red; those ≥15% better are highlighted in green.

Since 2022 vs. Arkansas state average
Overall vs. AR average 2 Worse Metrics worse than Arkansas average:
• Total deficiencies (43% above)
• Deficiencies per year (42% above)
0 Better No metrics in this bucket.
Latest Inspection January 24, 2025 Routine

Deficiencies Info Deficiencies are formal regulatory issues recorded during state inspections.

This FacilityAR Averagevs. AR Avg
Total deficiencies Info Formal regulatory issues recorded by inspectors across all inspection types. 3021 This facility has 43% more total deficiencies than a typical Arkansas assisted living residence (30 vs. AR avg 21).↑ 43% worse
Deficiencies per year Info Average deficiencies per year since 2022. 7.55.3 This facility has 42% more deficiencies per year than a typical Arkansas assisted living residence (7.5 vs. AR avg 5.3).↑ 42% worse

Inspection Reports Summary Info An editor-reviewed summary of the themes and findings across this facility's recent inspection reports.

  • January 24, 2025 inspection found 8 deficiencies including inaccurate resident assessments, incomplete PASRR screenings, poor dementia and wound care planning, unsafe fall mats, food safety violations, and infection control lapses.
  • December 21, 2023 inspections noted 10 deficiencies across two surveys, including hazardous items in resident areas, unsafe medication practices, poor food storage, missing Ombudsman info, and damaged window blinds.
  • No immediate jeopardy or fines were cited in any inspections, and complaint investigations were not substantiated.

Health Inspection History

Inspections since 2022
Total health inspections 3

State average N/A


Last Health inspection on Jan 2025

Total health citations
26

State average N/A

Citations per inspection
8.67

State average N/A


Health citations are formal notices following inspections when they fail to comply with safety and care standards.

24 of 26 citations resulted from standard inspections; and 2 of 26 came from combined inspections (standard and complaint).

Breakdown of citation severity (last 4 years)
Critical health citations
1
In line with State average

State average: N/A


Serious health citations
0
In line with State average

State average: N/A

1 critical citation State average: N/A

0 serious citations State average: N/A

24 moderate citations State average: N/A

1 minor citation State average: N/A
Citations history (last 4 years)
Infection Control moderate citation Jan 24, 2025
Corrected

Nutrition moderate citation Jan 24, 2025
Corrected

Quality of Care moderate citation Jan 24, 2025
Corrected

Quality of Care moderate citation Jan 24, 2025
Corrected

Staffing Data

Reporting period: October 1 – December 31, 2025 (Q4 2025). Source: CMS Payroll-Based Journal report.

Total staff 103
Employees 89
Contractors 14
Staff to resident ratio 1.21 : 1
0% compared with State average

State average ratio: 0 : 0

Avg staff/day 47
Average shift 7.4 hours
0% compared with State average

State average: 0 hours

Total staff hours (quarter) 32,180

Nursing staff breakdown

Q4 2025 · Oct 1 – Dec 31 More info This data comes from the CMS Payroll-Based Journal report covering October 1 – December 31, 2025.
Registered Nurse

Manages medical care and health needs.

RN Staff Info All 2 RN Staff are full-time employees. No contractors work on this role. 2
Average shift length Info Average shift length. Calculated as total hours divided by days worked and average staff per day. 7.6 hours
Licensed Practical Nurse

Assists with medical care and medications.

LPN Staff Info All 13 LPN Staff are full-time employees. No contractors work on this role. 13
Average shift length Info Average shift length. Calculated as total hours divided by days worked and average staff per day. 8.3 hours
Certified Nursing Assistant

Helps with daily care and mobility.

CNA Staff Info All 52 CNA Staff are full-time employees. No contractors work on this role. 52
Average shift length Info Average shift length. Calculated as total hours divided by days worked and average staff per day. 7.6 hours

Contractor staffing

Q4 2025 · Oct 1 – Dec 31 More info This data comes from the CMS Payroll-Based Journal report covering October 1 – December 31, 2025.

Total hours from contractors

7.1%

2,290 contractor hours this quarter

Clinical Nurse Specialist: 3 Physical Therapy Assistant: 3 Speech Language Pathologist: 2 Physical Therapy Aide: 1 Qualified Social Worker: 1 Respiratory Therapy Technician: 1 Medical Director: 1 Occupational Therapy Aide: 1 Occupational Therapy Assistant: 1

Staff by category

Q4 2025 · Oct 1 – Dec 31 More info This data comes from the CMS Payroll-Based Journal report covering October 1 – December 31, 2025.
Certified Nursing Assistant5205218,43092100%7.6
Licensed Practical Nurse130135,59692100%8.3
Clinical Nurse Specialist5381,7229199%7
RN Director of Nursing2029146470%7.6
Dietitian2029046571%7.4
Speech Language Pathologist0228986874%7.6
Medication Aide/Technician6068138188%5.8
Registered Nurse2026258188%7.6
Nurse Practitioner5055446672%7.2
Physical Therapy Aide0114586368%7.3
Mental Health Service Worker1014386166%7.2
Administrator1014305459%8
Physical Therapy Assistant0331463942%3.7
Qualified Social Worker0111454953%3
Respiratory Therapy Technician011692729%2.6
Occupational Therapy Aide0112955%5.7
Medical Director011141112%1.2
Occupational Therapy Assistant011533%1.8
52 Certified Nursing Assistant
% of Days 100%
13 Licensed Practical Nurse
% of Days 100%
8 Clinical Nurse Specialist
% of Days 99%
2 RN Director of Nursing
% of Days 70%
2 Dietitian
% of Days 71%
2 Speech Language Pathologist
% of Days 74%
6 Medication Aide/Technician
% of Days 88%
2 Registered Nurse
% of Days 88%
5 Nurse Practitioner
% of Days 72%
1 Physical Therapy Aide
% of Days 68%
1 Mental Health Service Worker
% of Days 66%
1 Administrator
% of Days 59%
3 Physical Therapy Assistant
% of Days 42%
1 Qualified Social Worker
% of Days 53%
1 Respiratory Therapy Technician
% of Days 29%
1 Occupational Therapy Aide
% of Days 5%
1 Medical Director
% of Days 12%
1 Occupational Therapy Assistant
% of Days 3%

Penalties and fines

Federal penalties imposed by CMS for regulatory violations, including civil money penalties (fines) and denials of payment for new Medicare/Medicaid admissions.

Source: CMS Penalties Database

No penalties in the past 3 years

No civil money penalties or payment denials were reported in the last 3 years.

Quality of care over time

These measures show how residents usually do over time at this home, based on health outcomes and preventive care.

High-risk clinical events score Info A composite score based on pressure ulcers, falls with injury, weight loss, walking ability decline, and activities of daily living decline. 5.8
24% better than State average

State average: 7.7

Functional decline score Info A composite score based on activities of daily living decline, walking ability decline, and incontinence. 8.4
37% better than State average

State average: 13.3

Long-stay resident measures
Significantly above average State avg: 4.2 Info CMS star rating based on long-stay quality measure performance. 5 stars = significantly above average, 1 star = significantly below average.
Need for Help with Daily Activities Increased Info Percent of long-stay residents whose need for help with daily activities has increased 7.4%
36% better than State average

State average: 11.5%

Walking Ability Worsened Info Percent of long-stay residents whose ability to move independently worsened 8.7%
35% better than State average

State average: 13.4%

Low Risk Residents with Bowel/Bladder Incontinence Info Percent of low risk long-stay residents who lose control of their bowels or bladder 9.0%
41% better than State average

State average: 15.1%

Falls with Major Injury Info Percent of long-stay residents experiencing one or more falls with major injury 8.9%
127% worse than State average

State average: 3.9%

High Risk Residents with Pressure Ulcers Info Percent of long-stay high risk residents with pressure ulcers 4.2%
12% better than State average

State average: 4.7%

Urinary Tract Infection Info Percent of long-stay residents with a urinary tract infection 0.0%
100% better than State average

State average: 1.3%

Lost Too Much Weight Info Percent of long-stay residents who lose too much weight 0.0%
100% better than State average

State average: 5.0%

Depressive Symptoms Info Percent of long-stay residents who have depressive symptoms 0.0%
100% better than State average

State average: 1.5%

Antipsychotic Use Info Percent of long-stay residents who received an antipsychotic medication 4.5%
57% better than State average

State average: 10.5%

Pneumococcal Vaccine Info Percent of long-stay residents assessed and appropriately given the pneumococcal vaccine 100.0%
6% better than State average

State average: 94.4%

Influenza Vaccine Info Percent of long-stay residents assessed and appropriately given the seasonal influenza vaccine 98.9%
In line with State average

State average: 96.2%

Hospitalizations per 1,000 days Info Number of hospitalizations per 1,000 long-stay resident days. 1.61
18% better than State average

State average: 1.97

ED visits per 1,000 days Info Number of outpatient emergency department visits per 1,000 long-stay resident days. 1.99
9% better than State average

State average: 2.18

Short-stay resident measures
Pneumococcal Vaccine Info Percent of short-stay residents assessed and appropriately given the pneumococcal vaccine 99.0%
22% better than State average

State average: 80.9%

Antipsychotic medication increase Info Percent of short-stay residents who newly received an antipsychotic medication 0.0%
100% better than State average

State average: 1.5%

Influenza Vaccine Info Percent of short-stay residents assessed and appropriately given the seasonal influenza vaccine 86.4%
11% better than State average

State average: 77.7%

Successful return to home or community Info Rate of successful return to home or community from a skilled nursing facility. 42.5%
16% worse than State average

State average: 50.6%

Breakdown by payment type

Medicare

25% of new residents, usually for short-term rehab.

Typical stay 1 - 2 months

Private pay

51% of new residents, often for short stays.

Typical stay 2 - 3 months

Medicaid

24% of new residents, often for long-term daily care.

Typical stay 3 years

Facility Characteristics

Source: CMS Long-Term Care Facility Characteristics (Data as of Jan 2026)

Total residents 85
Medicaid
78
91.8% of residents
Private pay or other
7
8.2% of residents
Programs & Services
Residents Group

Residents meet regularly to discuss policies, care quality, and activities

Family Member Group

Family members meet regularly to discuss policies, care quality, and activities

Active Family Council

Organized group of family members that meets regularly to discuss facility policies, resident care, and activities.

Active Resident Council

Organized group of residents that meets regularly to discuss facility policies, quality of life, and activities.

Finances and operations

Based on CMS SNF Cost Report for fiscal year ending in 12/2023.

For-profit
Operated by a single business entity.
Net patient revenue Info Net patient revenue — what the home actually collects for resident care, after contractual allowances, bad debt and discounts are subtracted from its gross charges (CMS cost report, Worksheet G-3). It covers resident care only; money the home earns from other sources is shown separately as "Other income."
$8.7M
Net patient income Info Net patient income: net patient revenue minus the home's total operating expenses. A positive figure means it earns more from resident care than it spends to deliver it; a negative figure means the opposite. It excludes non-operating "other income."
$1.3M
For-profit Operated by a single business entity.
Net patient revenue Info Net patient revenue — what the home actually collects for resident care, after contractual allowances, bad debt and discounts are subtracted from its gross charges (CMS cost report, Worksheet G-3). It covers resident care only; money the home earns from other sources is shown separately as "Other income."
$8.7M
Net patient income Info Net patient income: net patient revenue minus the home's total operating expenses. A positive figure means it earns more from resident care than it spends to deliver it; a negative figure means the opposite. It excludes non-operating "other income."
$1.3M
Other income Info Money the home earns outside of resident care — such as investments, grants, rentals and other non-operating sources (CMS cost report, Worksheet G-3). It is tracked separately from net patient revenue: it is not part of that figure, and it is not included in net patient income.
$412.0K
Payroll costs Info Staff salaries plus wage-related costs — benefits such as payroll taxes, health insurance and retirement — from the home's own accounting records (CMS cost report, Worksheet A). Contract or agency labor is counted separately, under other operating costs.
$3.8M 43.3% of net patient revenue Info Payroll as a share of revenue: staff salaries and wage-related benefits divided by net patient revenue. A higher figure means more of each revenue dollar goes to staff pay.
Other operating costs Info Everything it costs to run the home apart from payroll — food, utilities, supplies, maintenance, contract labor and administration. Calculated as total operating expense minus payroll (staff salaries and wage-related benefits).
$3.6M
Total costs Info The home's total operating expense for the year — all the costs of running it, salaries included (CMS cost report, Worksheet G-3).
$7.4M

Who this home usually serves

TYPE OF STAY

Mix of rehab and long-term care

This home supports both short-term rehab and long-term care, with residents staying for a wide range of durations.

Most new residents arrive under private pay (51% of admissions), and a typical private pay stay runs around 2 - 3 months.

Admissions
109 total

Coverage residents most often arrive under.

Medicare 25%
Private pay 51%
Medicaid 24%
Discharges
95 total

Coverage residents most often leave under.

Medicare 21%
Private pay 56%
Medicaid 23%

Places of interest near Valley Springs Rehabilitation and Health Center

Address 0.0 miles from city center Info Estimated distance in miles from Van Buren's city center to Valley Springs Rehabilitation and Health Center's address, calculated via Google Maps.

Calculate Travel Distance to Valley Springs Rehabilitation and Health Center

Add your location

Address

Compare Nursing Homes around the area

The information below is reported by the Arkansas Department of Human Services, Office of Long Term Care.

Valley Springs Rehabilitation and Health Center
NH
MC
RC
Van Buren -105 - 56 -
Barnes Healthcare
NH
MC
Lonoke -141 A+ 38 Private / Shared Rooms
Timberlane Health & Rehab
NH
MC
RC
El Dorado -106 A+ 33 -
Bear Creek Healthcare LLC
NH
De Queen -131 - 35 -
Maple Healthcare
NH
Hazen -70 - 21 Private / Shared Rooms

Frequently Asked Questions about Valley Springs Rehabilitation and Health Center

Who is the owner of Valley Springs Rehabilitation and Health Center?

Valley Springs Rehabilitation and Health Center is legally operated by Van Buren SNF Operations, LLC., and administered by Judy Digiacinto.

Is Valley Springs Rehabilitation and Health Center in a walkable area?

Valley Springs Rehabilitation and Health Center has a walk score of 56. Moderately walkable. Some errands can be accomplished on foot, with a mix of nearby amenities.

What is the occupancy rate at Valley Springs Rehabilitation and Health Center?

Valley Springs Rehabilitation and Health Center's occupancy is 91%.

Does Valley Springs Rehabilitation and Health Center operate as a for-profit or non-profit?

Valley Springs Rehabilitation and Health Center is registered as a for-profit in AR.

Who is the administrator of Valley Springs Rehabilitation and Health Center?

Judy Digiacinto is the administrator of Valley Springs Rehabilitation and Health Center.

How many beds does Valley Springs Rehabilitation and Health Center have?

Valley Springs Rehabilitation and Health Center has 105 beds.

Are there photos of Valley Springs Rehabilitation and Health Center?

Yes — there are 3 photos of Valley Springs Rehabilitation and Health Center in the photo gallery on this page.

Guides for Better Senior Living

Care Cost Calculator: See Prices in Your Area

Nursing Home Data Explorer

Don’t Wait Too Long: 7 Red Flag Signs Your Parent Needs Assisted Living Now

The True Cost of Assisted Living in 2025 – And How Families Are Paying For It

Understanding Senior Living Costs: Pricing Models, Discounts & Financial Assistance