Eaglecrest Nursing and Rehab
Nursing Home, Memory Care & Respite Care · Ash Flat, AR
CMS overall rating Info CMS (the Centers for Medicare & Medicaid Services) is the federal agency that rates nursing home quality. Its Overall Rating runs from 1 to 5 stars, combining health inspections, staffing, and quality measures, with inspections weighted most heavily.

Eaglecrest Nursing and Rehab

Nursing Home, Memory Care & Respite Care · Ash Flat, AR
CMS overall rating Info CMS (the Centers for Medicare & Medicaid Services) is the federal agency that rates nursing home quality. Its Overall Rating runs from 1 to 5 stars, combining health inspections, staffing, and quality measures, with inspections weighted most heavily.
Calculator: See prices in your area
Eaglecrest Nursing and Rehab accepts Medicare, Medicaid, and private pay.

Overview of Eaglecrest Nursing and Rehab

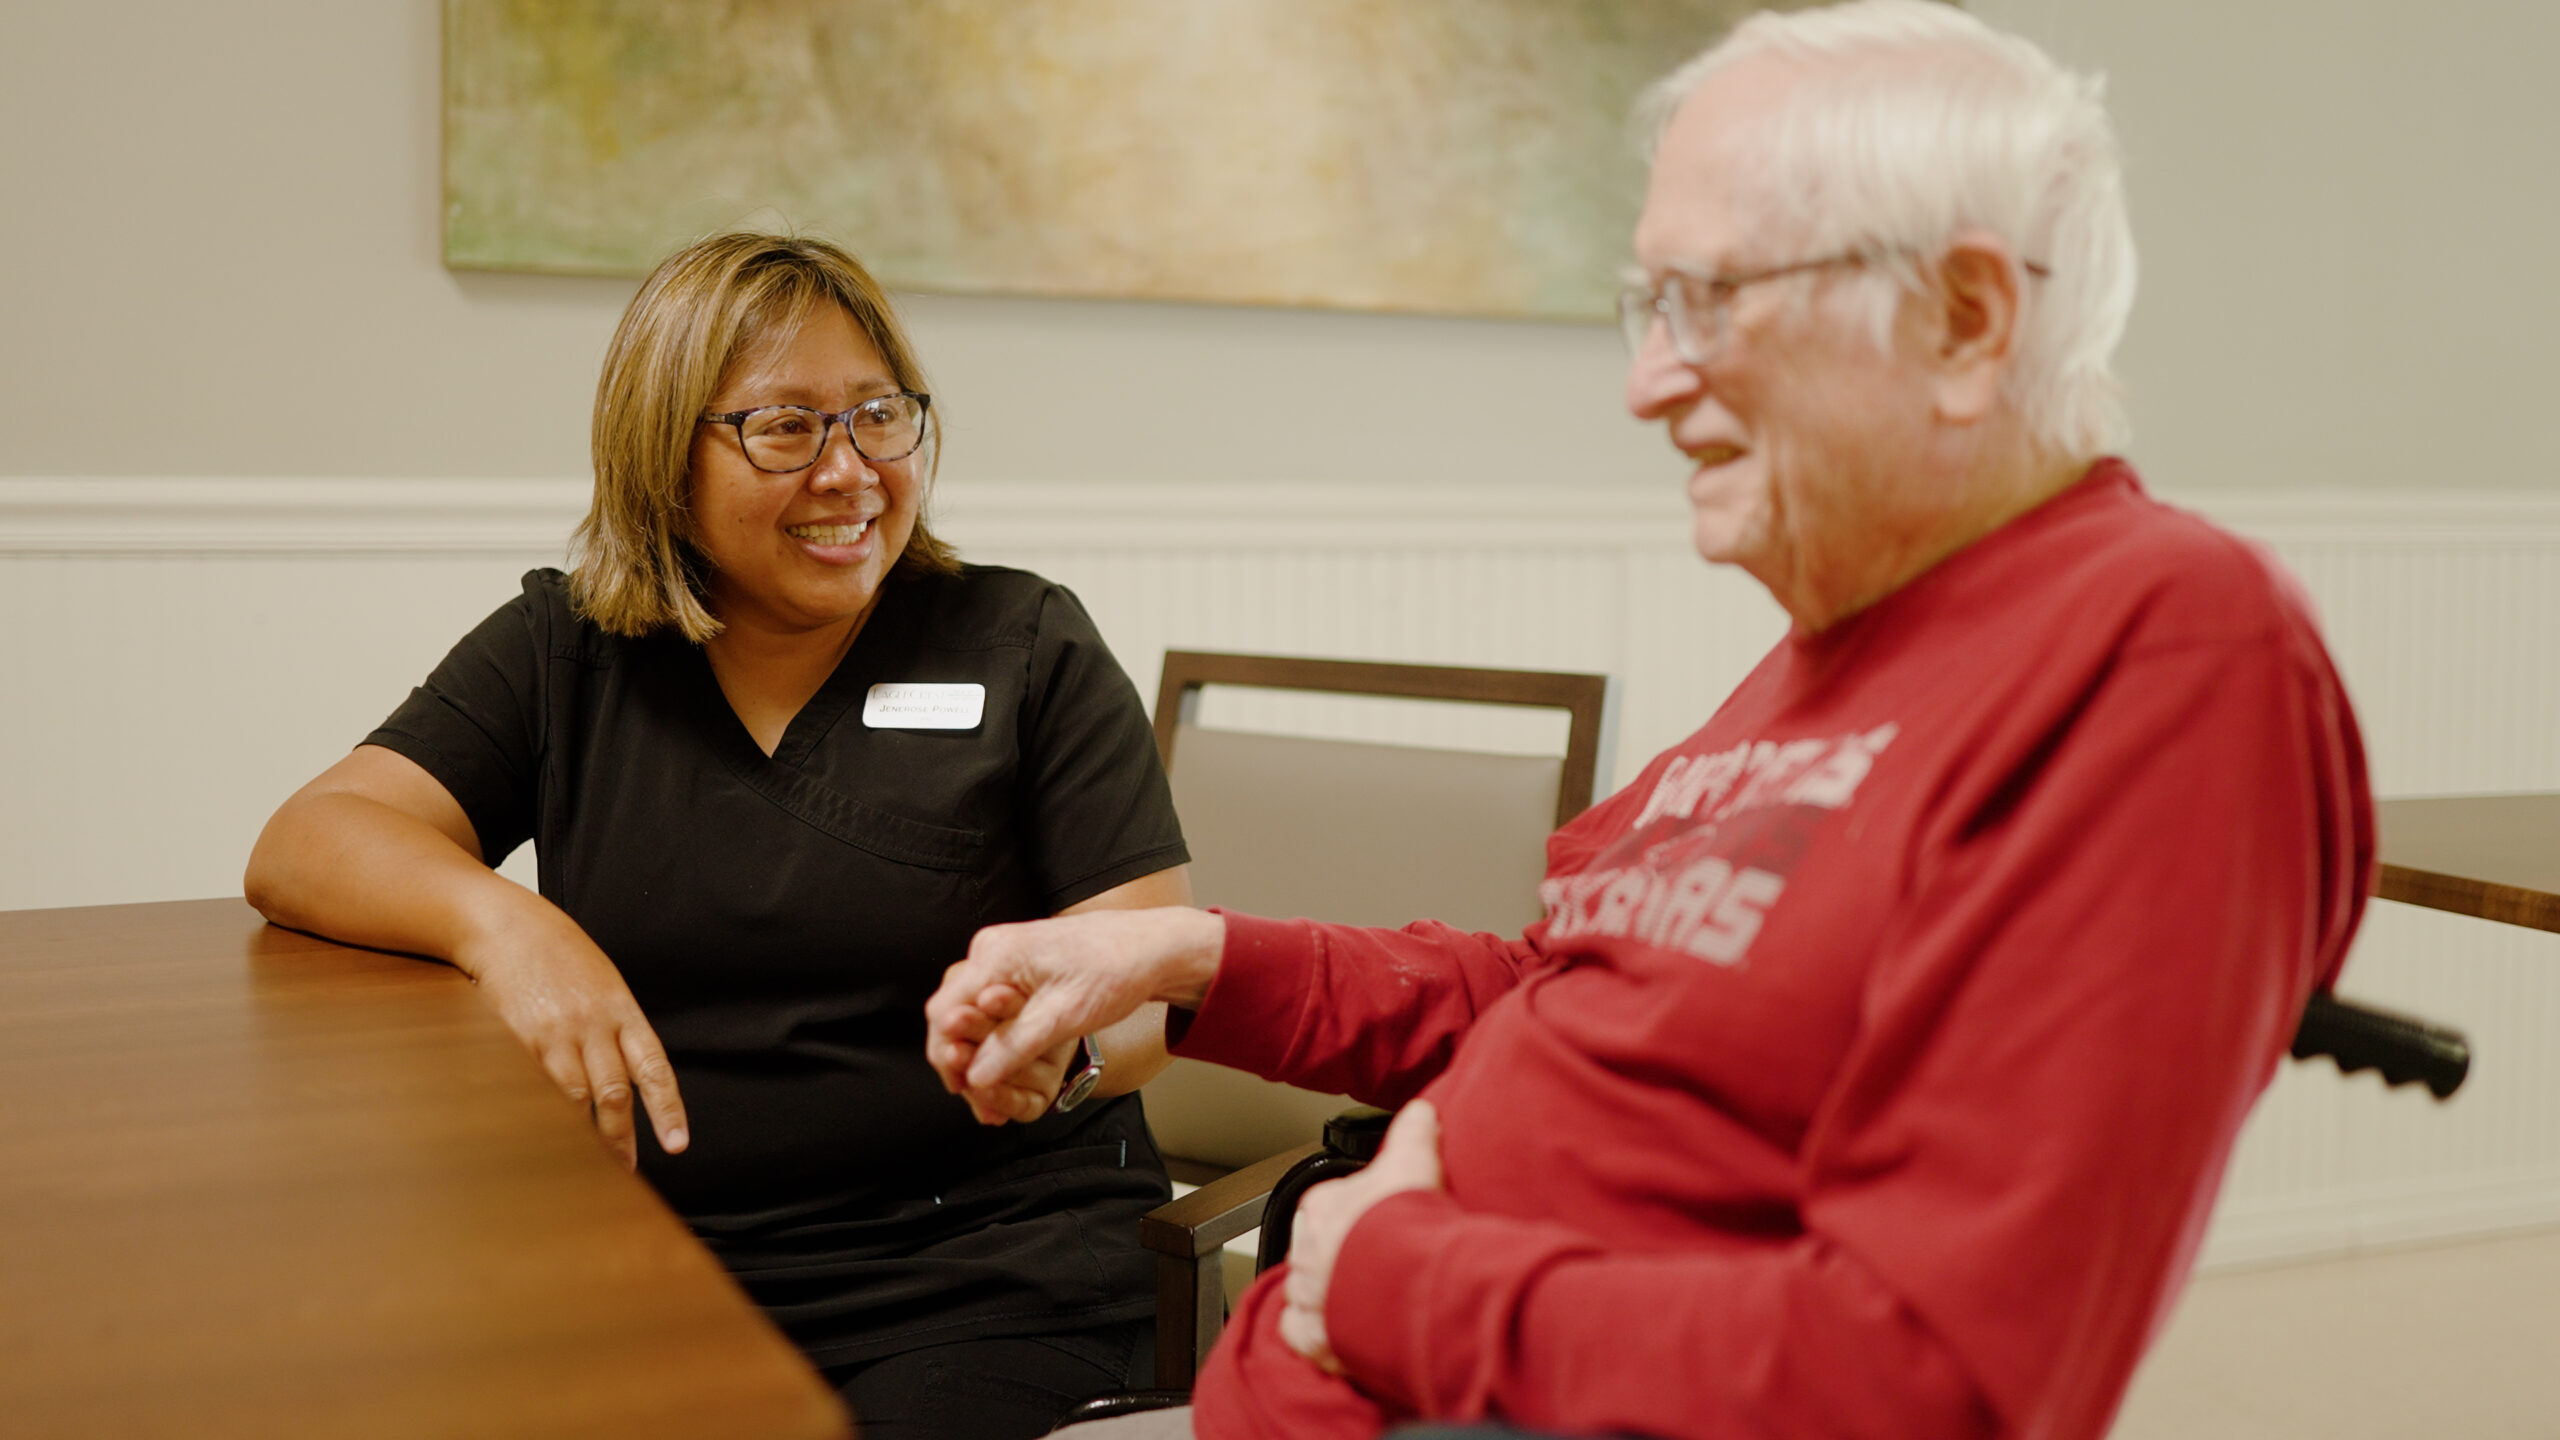
Operated by AFNC, Inc., under owner Maggie Cannon, Eaglecrest Nursing and Rehab is a skilled nursing community that serves both short-term rehabilitation residents and those needing longer-term nursing care. The facility accepts Medicare, Medicaid, and private pay, giving families several options when arranging coverage.

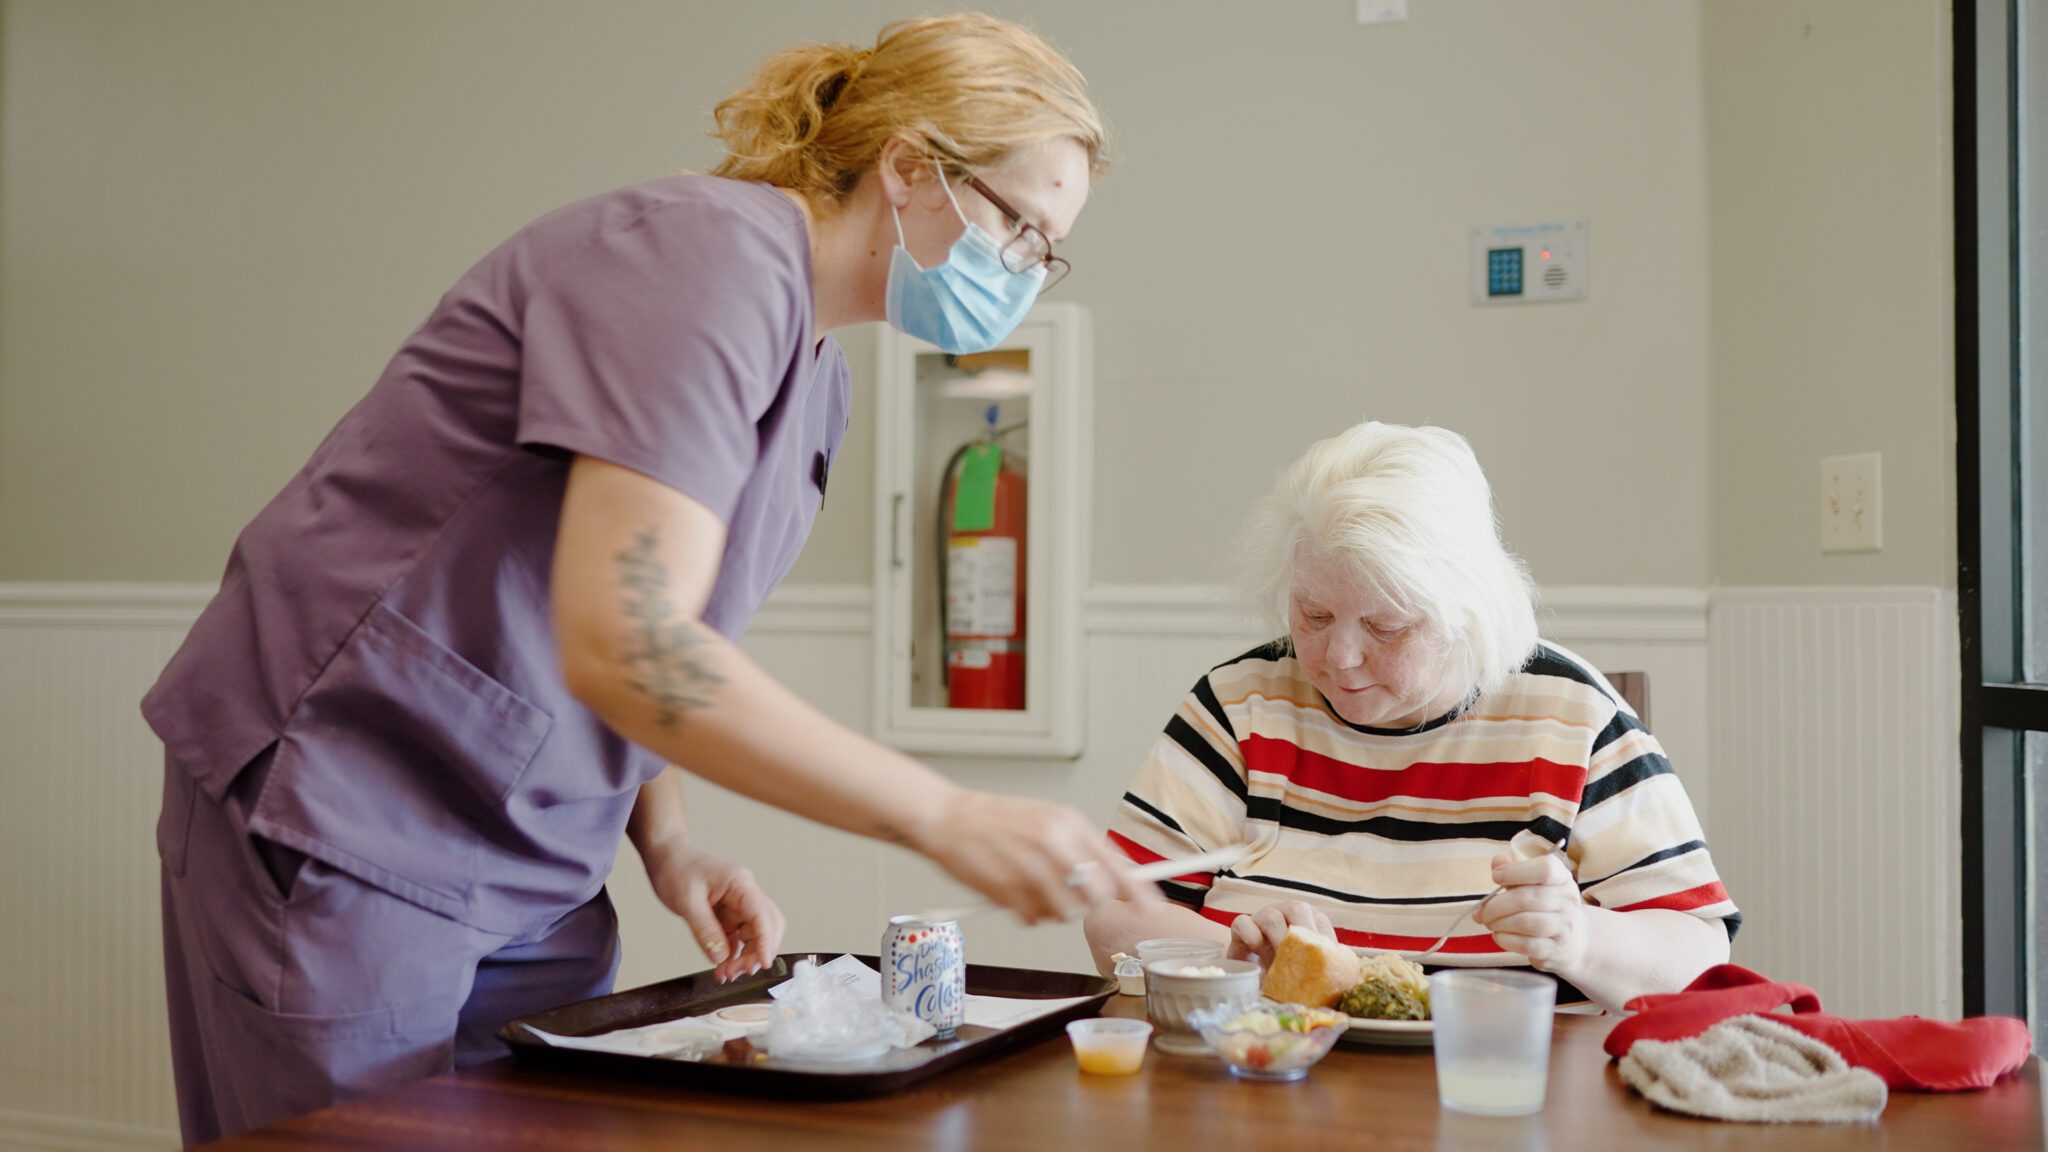
The community has 100 beds, with an occupancy rate of 74%. Residents stay an average of 179 days. That resident mix reflects the facility’s focus on post-acute recovery alongside ongoing skilled nursing care. Daily nurse staffing averages about 4 hours and 10 minutes per resident. Registered nurses, licensed practical nurses, nurse aides, and 24-hour staffing that provides daily hands-on assistance.

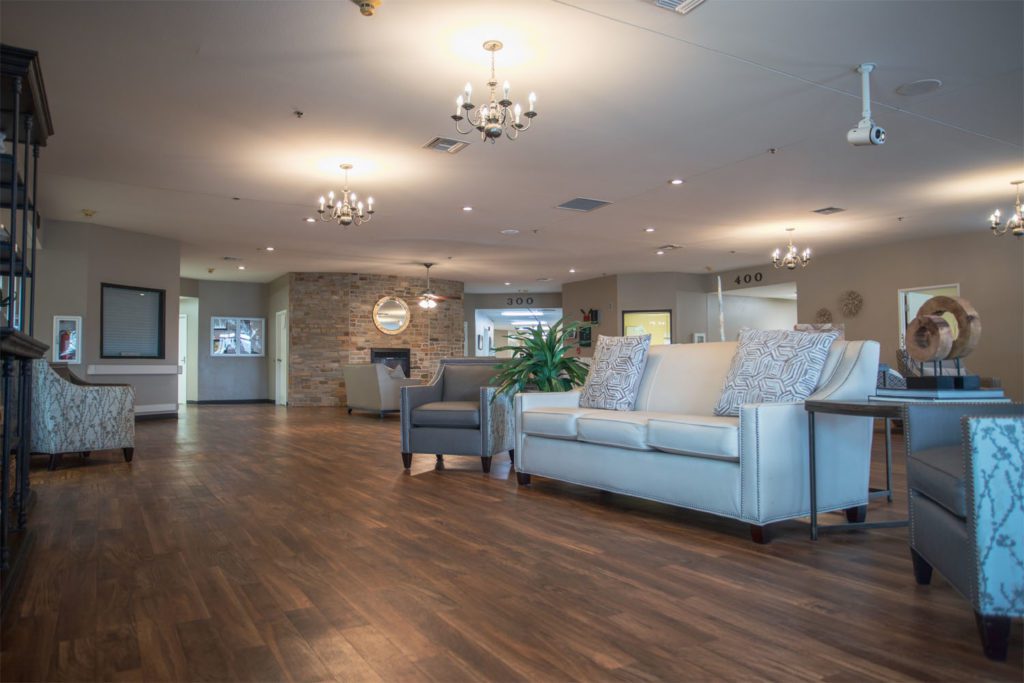
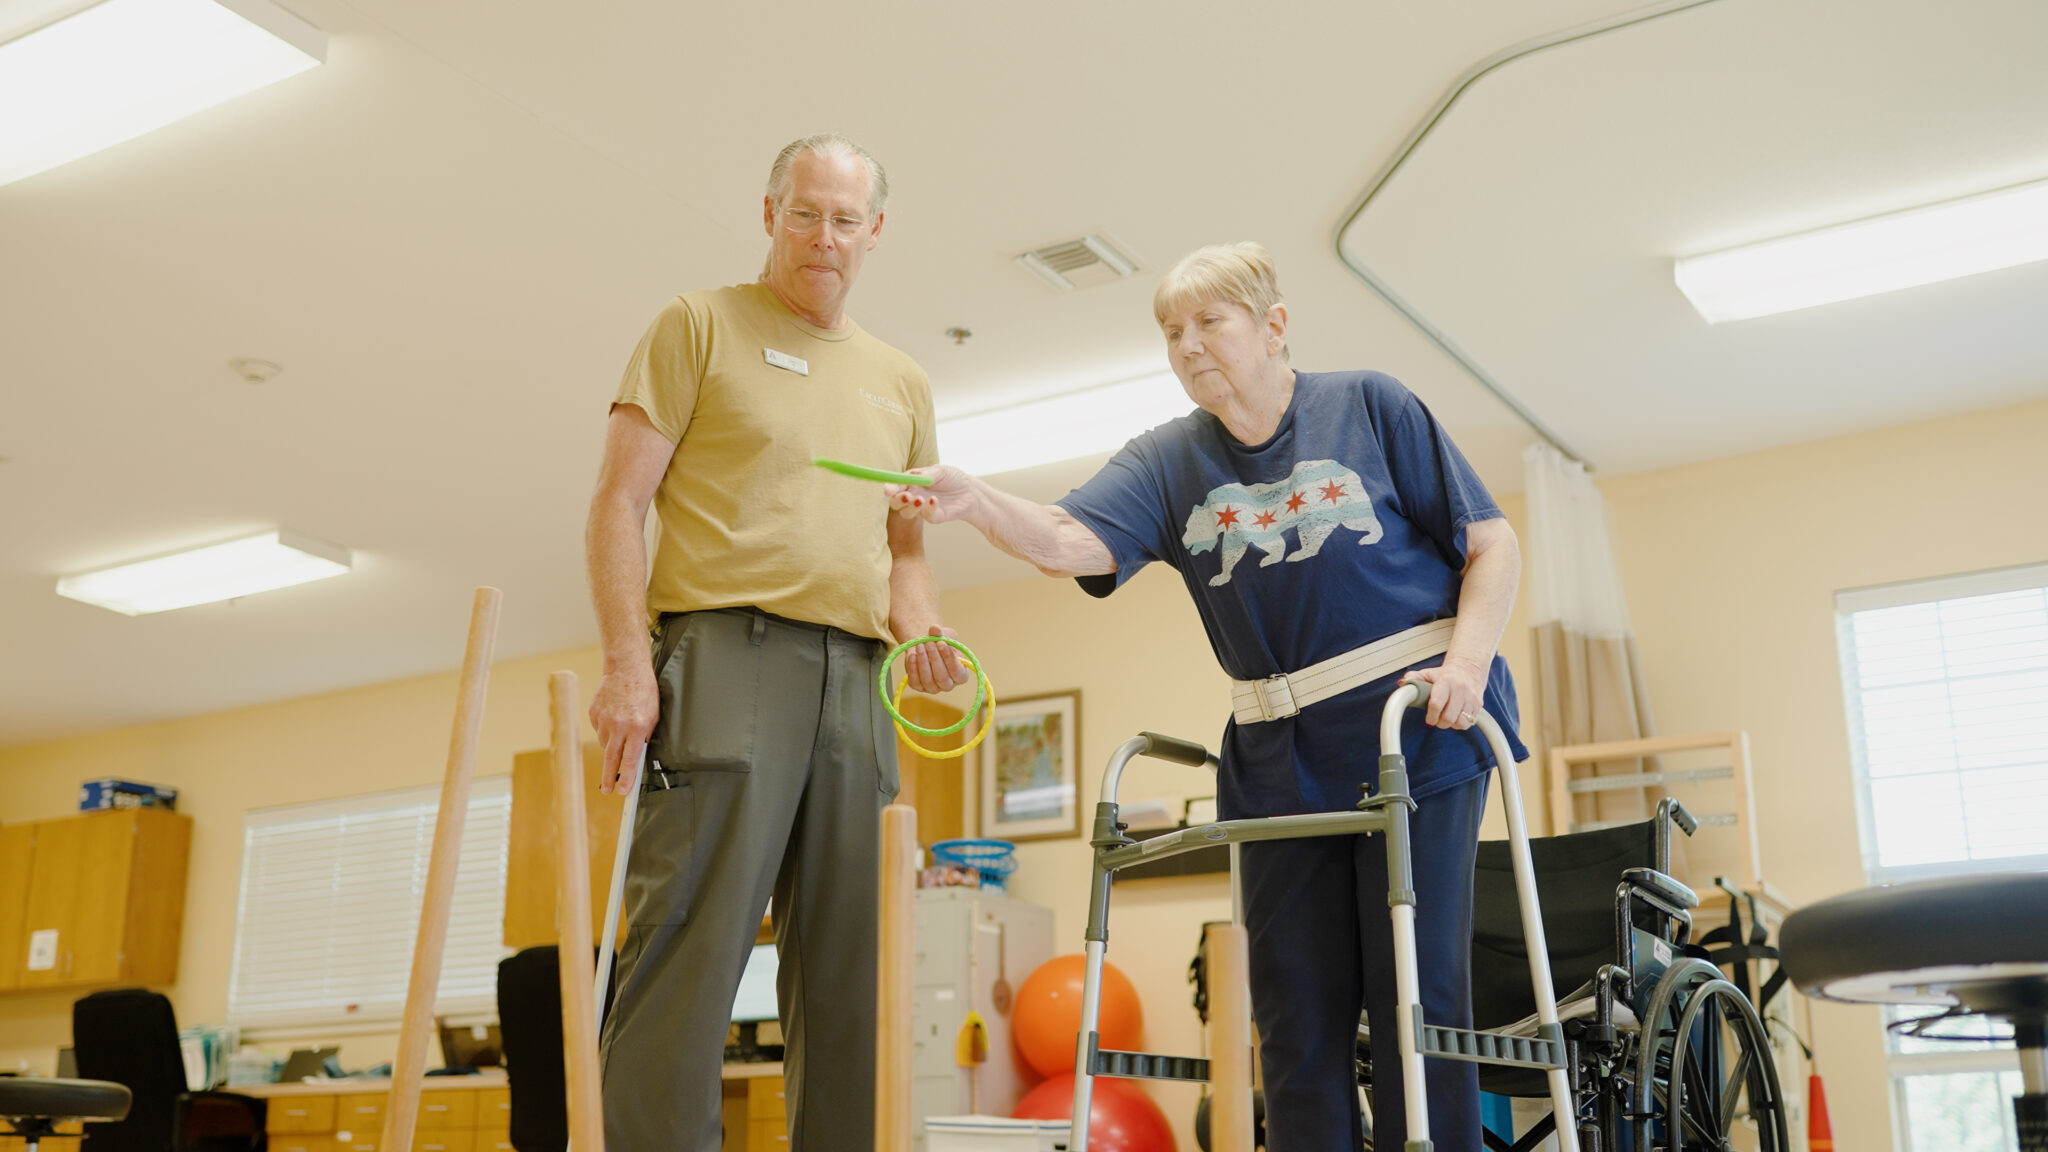
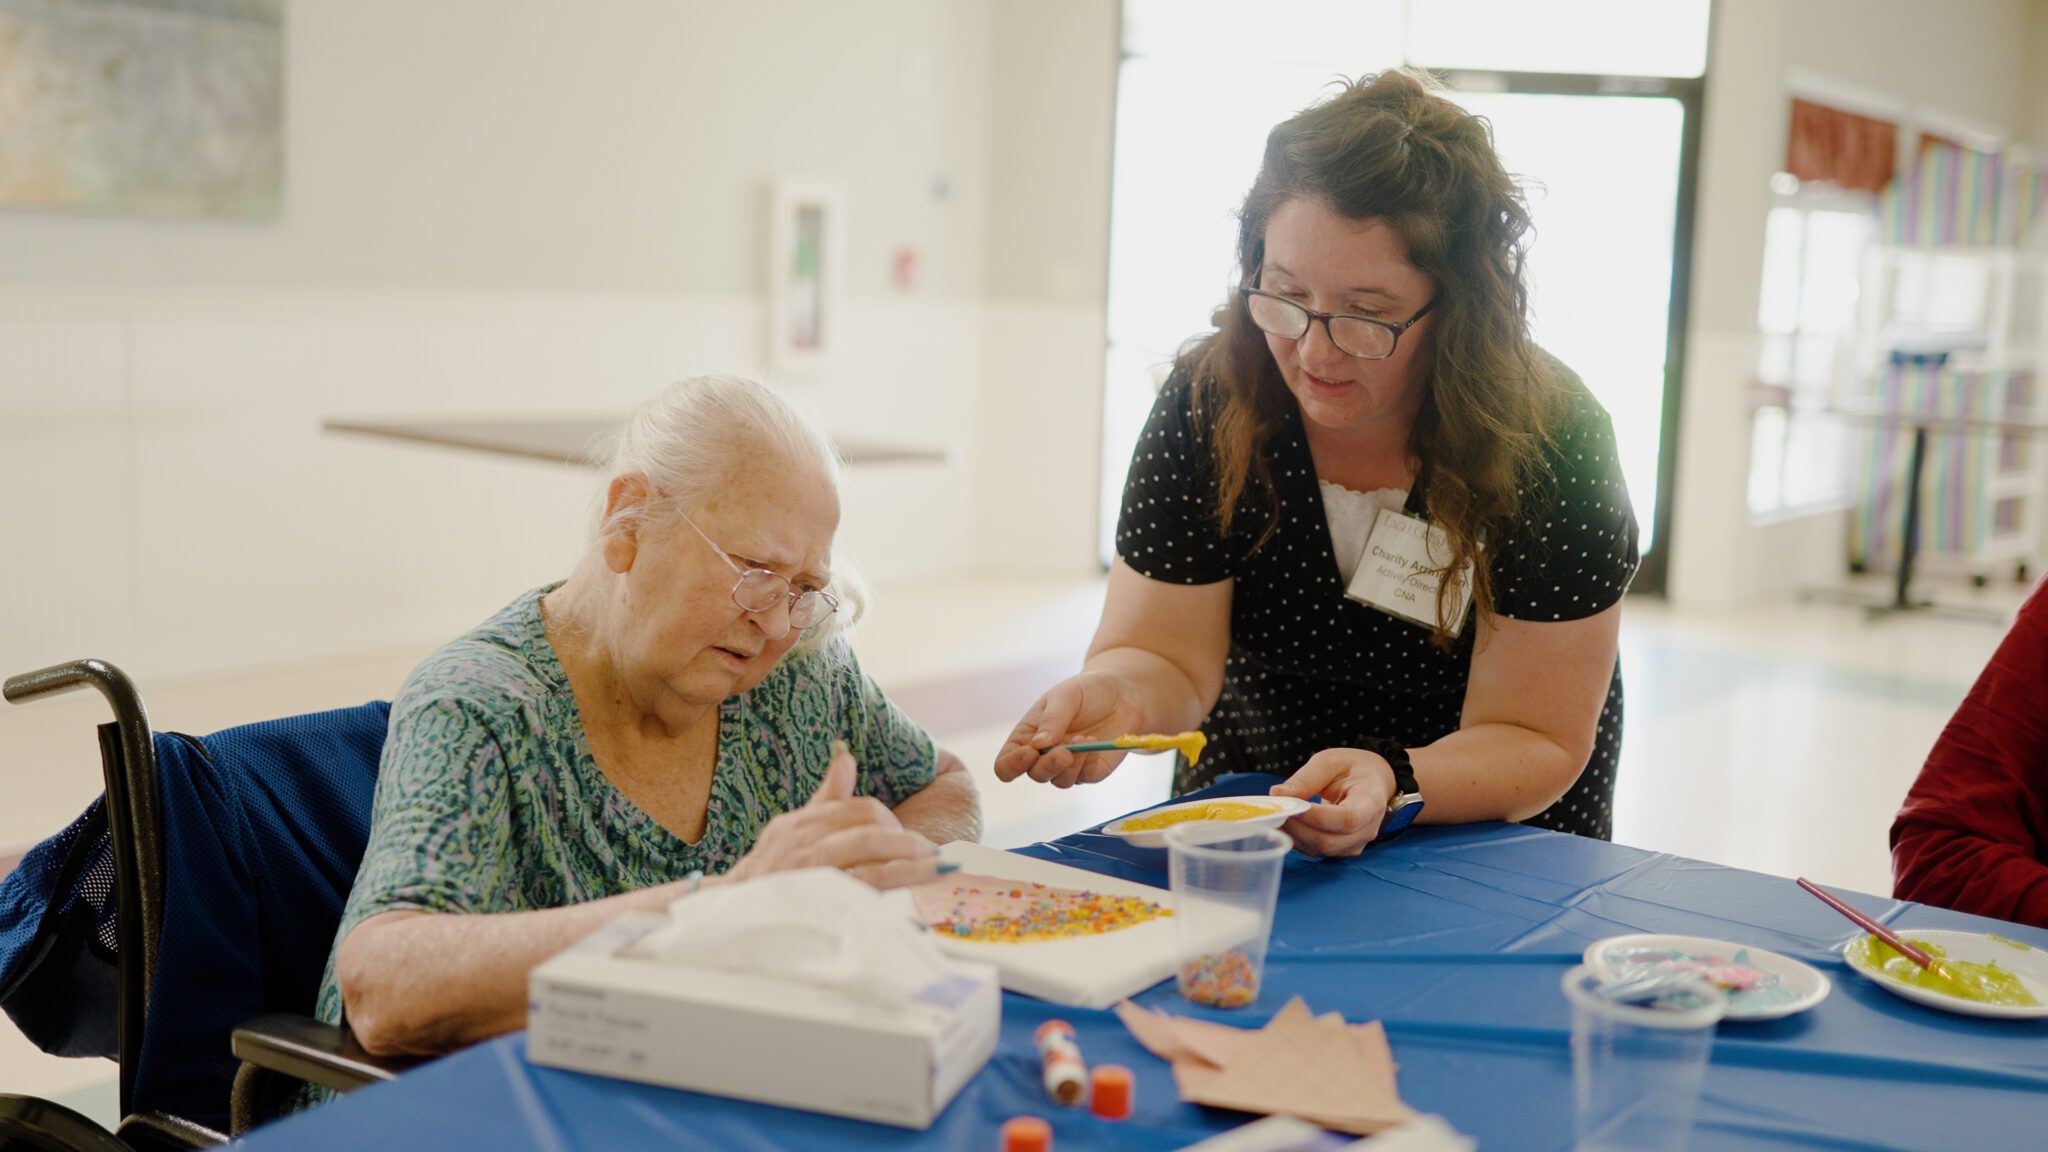
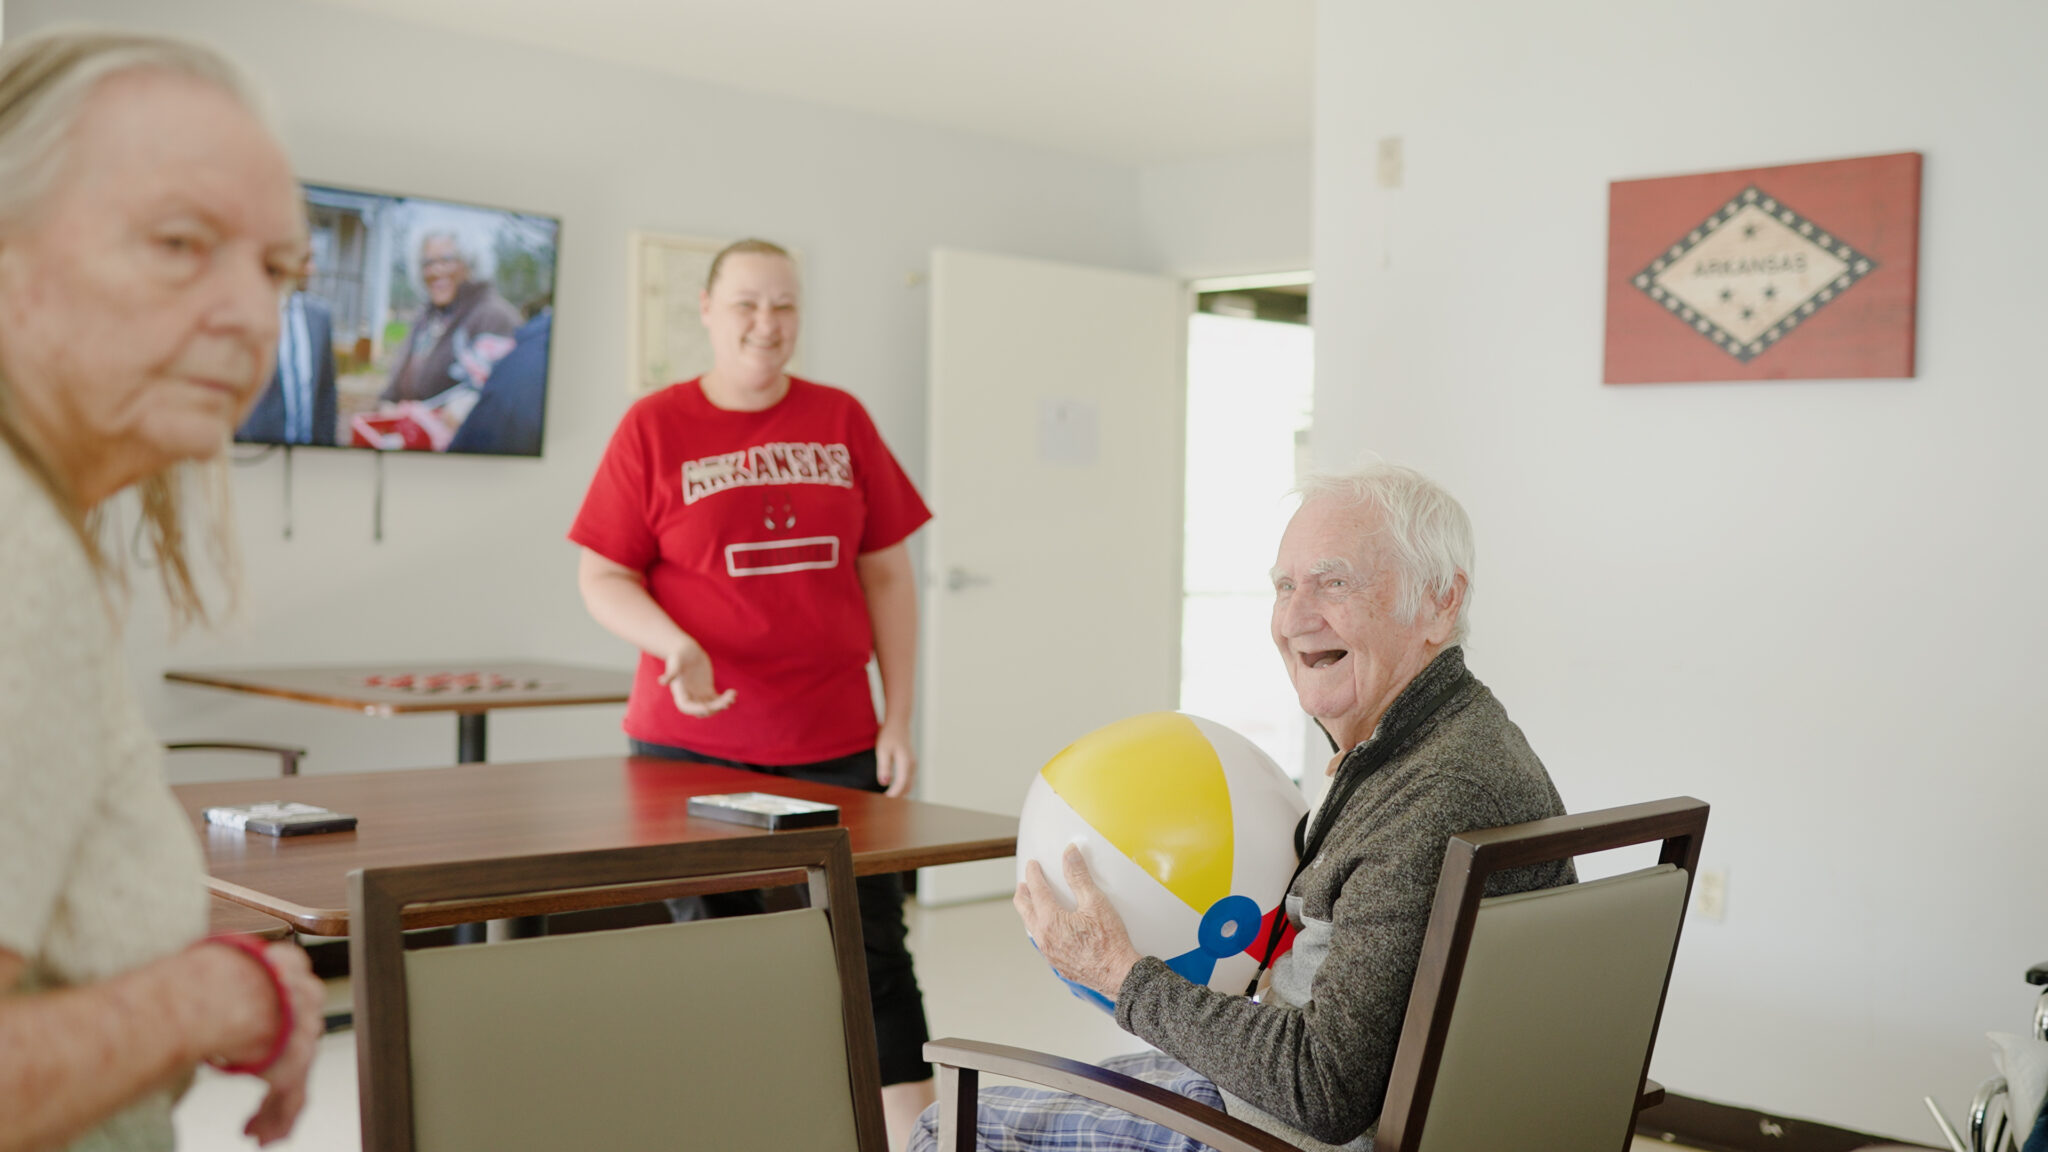
Rehabilitation services are a major part of daily operations. Respite care is available alongside traditional skilled nursing services. The therapy gym includes state-of-the-art equipment, and structured programs are designed around recovery and well-being. Daily activities include entertainment, social opportunities, and a rotating calendar of programs. Residents also have access to salon services. An outdoor courtyard with a gazebo provides space for fresh air and outdoor time.

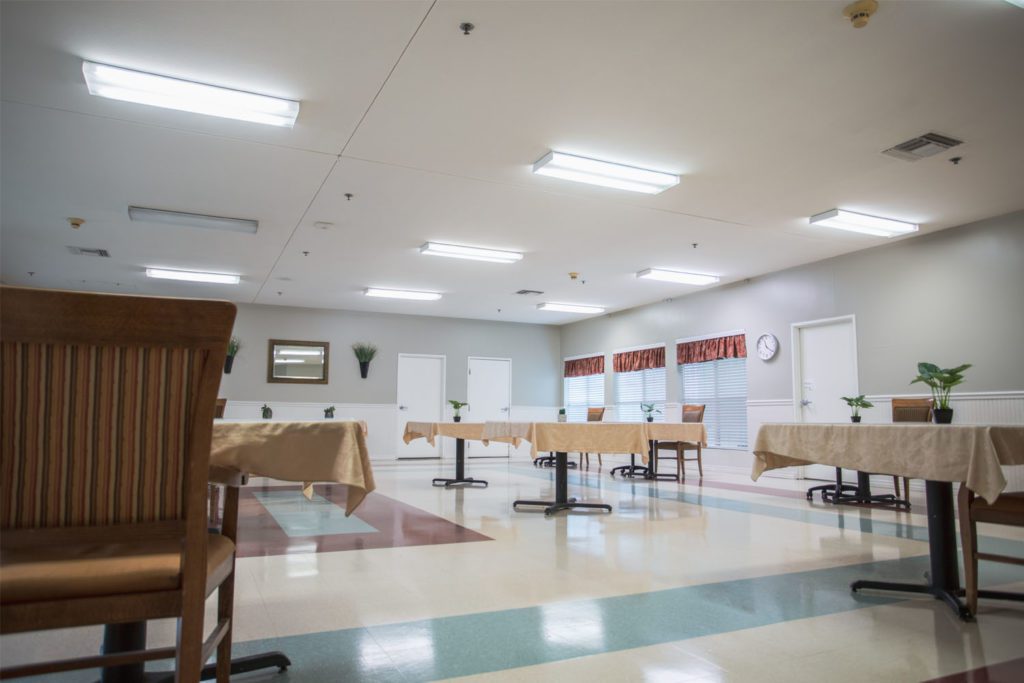
Meals are overseen by a certified dietary manager. Professional cooks prepare nutritious meals while accommodating food allergies and individual preferences. Residents can gather in a large communal dining room, and there’s a dedicated activity area for socialization and daily programming.

The facility is in a car-dependent area where most errands require transportation. However, the immediate neighborhood is quiet and residential.

State inspections have shown improvement over time. The most recent survey found no health deficiencies and no complaints. Earlier surveys identified areas involving resident privacy, medication security, care planning documentation, and environmental safety, reflecting compliance areas the facility has worked to address.

Quality ratings

Measured by Centers for Medicare & Medicaid Services (CMS)

Overall rating Info The Overall CMS Rating combines results from health inspections, staffing levels and quality measures. Health inspections carry the most weight. Staffing and quality scores can increase or decrease the final rating based on performance compared to state and national standards.
Health Inspection Info Based on the results of the facility's three most recent standard inspections and any complaint investigations. CMS reviews the number, scope, and severity of deficiencies, with more recent findings weighted more heavily.
Staffing Info Measures average nursing staff hours per resident per day, including Registered Nurses (RNs) and total nursing staff. Ratings are adjusted based on the level of care residents require and are compared to state and national benchmarks.
Quality Measures Info Based on clinical and physical health indicators reported to CMS, such as hospital readmissions, falls, pressure ulcers, and improvements in mobility. These measures reflect how well residents' health needs are being managed.

Staffing hours breakdown

Info Daily nursing hours per resident by staff type, reported to CMS. Higher is generally better — compare this facility to state and national averages to see where staffing stands.

Hours per resident per day — compared to state averages

Total nursing care / resident Info Total adjusted nursing hours per resident per day, combining RN, LPN, and aide time. CMS adjusts this for case-mix so facilities can be fairly compared.
4h 10m per day
vs avg

4 of 6 metrics below state avg

Standout metric Weekend RN is +19% above state avg
Staff type Hours / Day / Resident vs state avg
Registered Nurse (RN) Info RNs hold the highest nursing license and can assess residents, interpret test results, and direct care plans. More RN hours per day often signals stronger clinical oversight and faster response to health changes. 24m per day ■ Avg State avg: 24m per day · National avg: 41m per day
LPN / LVN Info Licensed Practical Nurses (LPNs) or Licensed Vocational Nurses (LVNs) deliver routine hands-on care — medication administration, wound dressing, and monitoring vital signs. They work under RN supervision and make up a large share of daily bedside care. 50m per day ▼ 13% State avg: 57m per day · National avg: 52m per day
Nurse Aide Info Certified Nurse Aides (CNAs) provide the most direct day-to-day assistance: bathing, dressing, feeding, and mobility. Nurse aide hours are typically the largest staffing category and directly affect residents' quality of life. 2h 33m per day ▼ 6% State avg: 2h 43m per day · National avg: 2h 20m per day
Weekend Total Nursing Info Combined nursing hours (RN + LPN + Nurse Aide) per resident per day on weekends. Staffing often drops on weekends — this figure reveals whether the facility maintains adequate coverage outside of weekday hours. 3h 10m per day ▼ 9% State avg: 3h 29m per day · National avg: 3h 26m per day
Physical Therapist Info Hours per resident per day provided by licensed Physical Therapists (PTs) or PT Assistants. PT services help residents recover mobility after injury or illness and are especially important for post-acute (short-stay) rehabilitation. 0m per day ▼ 77% State avg: 2m per day · National avg: 4m per day
Weekend RN Info Registered nurse hours specifically on weekends. Facilities sometimes reduce RN presence on Saturdays and Sundays — a low weekend RN figure compared to weekday hours can indicate reduced clinical oversight when most administrative staff are absent. 19m per day ▲ 19% State avg: 16m per day · National avg: 28m per day

Capacity and availability

Avg. Length of Stay
179 days
Bed community size
100-bed community Rank #131 / 330Bed count — State benchmarkedThis home is ranked 131st out of 330 homes in Arkansas. Shows this facility's certified or reported bed count compared to other Arkansas facilities. Larger communities may offer more amenities, programs, and on-site services for residents and families.Rankings are based only on facilities in Arkansas that report data for that category. Facilities without available data are excluded from the ranking.Click the rank badge to see the full State ranking.Click here to see the full State ranking.
A larger shared setting that may offer more common spaces and organized community services.
Walk Score
Walk Score: 16 / 100 Rank #308 / 419Walk Score — State benchmarkedThis home is ranked 308th out of 419 homes in Arkansas. Shows how walkable this facility's neighborhood is compared to the average Walk Score across Arkansas facilities. Higher scores benefit residents, families, and staff.Rankings are based only on facilities in Arkansas that report data for that category. Facilities without available data are excluded from the ranking.Click the rank badge to see the full State ranking.Click here to see the full State ranking.
Car-dependent. Most errands require a car, with limited nearby walkable options.

About this community

Occupancy

Occupancy rate
74%
Similar to the Arkansas average: 71.3%
Occupied beds
74 / 100
Average occupied beds in Arkansas homes 77 beds

License Details

Facility TypeSkilled Nursing Facility With Dual Certified Beds (medicaid / Medicare)
CountyFulton
CMS Certification Number045352
Certification TypeMedicaid / Medicare

Ownership & Operating Entity

Eaglecrest Nursing and Rehab is legally operated by AFNC, Inc., and administered by April Spurlock.

Owner NameAfnc, Inc
Profit StatusFor-profit

Type Of Units

Medicaid and Medicare
100 units
Total beds
100 units

Therapy & Rehabilitation

2 services
Rehabilitation Services
Respite Care

Staffing & Medical

1 service
24-Hour Staffing

Contact Information

Fax870-994-3041

Amenities & Lifestyle

Large Communal Dining Space
Dedicated Activity Area
Therapy Gym With State-Of-The-Art Equipment
Salon Services
Outdoor Courtyard With Gazebo
Activities
Specific ProgramsShort-Term Rehab, Additional Services

Contact Eaglecrest Nursing and Rehab

Inspection History

In Arkansas, the Department of Human Services, Office of Long Term Care is authorized to conduct unannounced inspections and issue official quality of care reports for all senior living providers.

Since 2022 · 4 years of data 12 deficiencies

Inspection Scorecard Info This scorecard compares key inspection, deficiency, and complaint metrics at this facility against the Arkansas state average. Metrics rated ≥15% worse than average are highlighted in red; those ≥15% better are highlighted in green.

Since 2022 vs. Arkansas state average
Overall vs. AR average 0 Worse No metrics in this bucket. 2 Better Metrics better than Arkansas average:
• Total deficiencies (43% below)
• Deficiencies per year (43% below)
Latest Inspection November 14, 2024 Other An inspection that falls outside standard annual surveys and formal complaint investigations. May include administrative compliance checks, documentation reviews, focused surveys on specific concerns, or revisit surveys to verify prior corrections.

Deficiencies Info Deficiencies are formal regulatory issues recorded during state inspections.

This Facility AR Average vs. AR Avg
Total deficiencies Info Formal regulatory issues recorded by inspectors across all inspection types. 12 21 This facility has 43% fewer total deficiencies than a typical Arkansas assisted living residence (12 vs. AR avg 21).↓ 43% better
Deficiencies per year Info Average deficiencies per year since 2022. 3 5.3 This facility has 43% fewer deficiencies per year than a typical Arkansas assisted living residence (3 vs. AR avg 5.3).↓ 43% better

Inspection Reports Summary Info An editor-reviewed summary of the themes and findings across this facility's recent inspection reports.

  • November 14, 2024 inspection found no health deficiencies and no complaints were reported.
  • December 14, 2023 survey cited 8 deficiencies including resident privacy breaches, medication cart security, care planning failures, and environmental safety hazards.
  • October 6, 2022 inspection found 4 deficiencies related to resident privacy, catheter care, and unsafe oxygen tank storage.

Health Inspection History

Inspections since 2022
Total health inspections 2

State average N/A


Last Health inspection on Dec 2023

Total health citations
12

State average N/A

Citations per inspection
6

State average N/A


Health citations are formal notices following inspections when they fail to comply with safety and care standards.

All 12 citations resulted from standard inspections.

Breakdown of citation severity (last 4 years)
Critical health citations
0
In line with State average

State average: N/A


Serious health citations
0
In line with State average

State average: N/A

0 critical citations State average: N/A

0 serious citations State average: N/A

11 moderate citations State average: N/A

1 minor citation State average: N/A
Citations history (last 4 years)
Administration moderate citation Dec 14, 2023
Corrected

Environmental moderate citation Dec 14, 2023
Corrected

Nursing Services moderate citation Dec 14, 2023
Corrected

Quality of Care moderate citation Dec 14, 2023
Corrected

Staffing Data

Reporting period: October 1 – December 31, 2025 (Q4 2025). Source: CMS Payroll-Based Journal report.

Total staff 90
Employees 69
Contractors 21
Staff to resident ratio 1.43 : 1
0% compared with State average

State average ratio: 0 : 0

Avg staff/day 37
Average shift 7.8 hours
0% compared with State average

State average: 0 hours

Total staff hours (quarter) 26,599

Nursing staff breakdown

Q4 2025 · Oct 1 – Dec 31 More info This data comes from the CMS Payroll-Based Journal report covering October 1 – December 31, 2025.
Registered Nurse

Manages medical care and health needs.

RN Staff Info All 2 RN Staff are full-time employees. No contractors work on this role. 2
Average shift length Info Average shift length. Calculated as total hours divided by days worked and average staff per day. 7.9 hours
Licensed Practical Nurse

Assists with medical care and medications.

LPN Staff Info All 11 LPN Staff are full-time employees. No contractors work on this role. 11
Average shift length Info Average shift length. Calculated as total hours divided by days worked and average staff per day. 9.9 hours
Certified Nursing Assistant

Helps with daily care and mobility.

CNA Staff Info All 39 CNA Staff are full-time employees. No contractors work on this role. 39
Average shift length Info Average shift length. Calculated as total hours divided by days worked and average staff per day. 7.9 hours

Contractor staffing

Q4 2025 · Oct 1 – Dec 31 More info This data comes from the CMS Payroll-Based Journal report covering October 1 – December 31, 2025.

Total hours from contractors

4%

1,067 contractor hours this quarter

Physical Therapy Aide: 6 Physical Therapy Assistant: 5 Qualified Social Worker: 3 Clinical Nurse Specialist: 3 Respiratory Therapy Technician: 3 Speech Language Pathologist: 1

Staff by category

Q4 2025 · Oct 1 – Dec 31 More info This data comes from the CMS Payroll-Based Journal report covering October 1 – December 31, 2025.
Certified Nursing Assistant 39 0 39 13,961 92 100% 7.9
Licensed Practical Nurse 11 0 11 4,560 92 100% 9.9
Medication Aide/Technician 6 0 6 2,464 92 100% 7.6
Clinical Nurse Specialist 4 3 7 1,401 88 96% 7.3
RN Director of Nursing 2 0 2 831 64 70% 7.7
Registered Nurse 2 0 2 636 69 75% 7.9
Nurse Practitioner 1 0 1 528 66 72% 8
Other Dietary Services Staff 1 0 1 491 64 70% 7.7
Mental Health Service Worker 1 0 1 453 60 65% 7.5
Speech Language Pathologist 0 1 1 394 66 72% 6
Physical Therapy Aide 0 6 6 315 65 71% 4.2
Administrator 1 0 1 304 38 41% 8
Qualified Social Worker 0 3 3 89 30 33% 3
Nurse Aide in Training 1 0 1 77 10 11% 7.7
Respiratory Therapy Technician 0 3 3 50 34 37% 1.5
Physical Therapy Assistant 0 5 5 47 35 38% 1.2
39 Certified Nursing Assistant
% of Days 100%
11 Licensed Practical Nurse
% of Days 100%
6 Medication Aide/Technician
% of Days 100%
7 Clinical Nurse Specialist
% of Days 96%
2 RN Director of Nursing
% of Days 70%
2 Registered Nurse
% of Days 75%
1 Nurse Practitioner
% of Days 72%
1 Other Dietary Services Staff
% of Days 70%
1 Mental Health Service Worker
% of Days 65%
1 Speech Language Pathologist
% of Days 72%
6 Physical Therapy Aide
% of Days 71%
1 Administrator
% of Days 41%
3 Qualified Social Worker
% of Days 33%
1 Nurse Aide in Training
% of Days 11%
3 Respiratory Therapy Technician
% of Days 37%
5 Physical Therapy Assistant
% of Days 38%

Penalties and fines

Federal penalties imposed by CMS for regulatory violations, including civil money penalties (fines) and denials of payment for new Medicare/Medicaid admissions.

Source: CMS Penalties Database

No penalties in the past 3 years

No civil money penalties or payment denials were reported in the last 3 years.

Quality of care over time

These measures show how residents usually do over time at this home, based on health outcomes and preventive care.

High-risk clinical events score Info A composite score based on pressure ulcers, falls with injury, weight loss, walking ability decline, and activities of daily living decline. 6.2
20% better than State average

State average: 7.7

Functional decline score Info A composite score based on activities of daily living decline, walking ability decline, and incontinence. 11.0
18% better than State average

State average: 13.3

Long-stay resident measures
Above average State avg: 4.2 Info CMS star rating based on long-stay quality measure performance. 5 stars = significantly above average, 1 star = significantly below average.
Need for Help with Daily Activities Increased Info Percent of long-stay residents whose need for help with daily activities has increased 8.3%
28% better than State average

State average: 11.5%

Walking Ability Worsened Info Percent of long-stay residents whose ability to move independently worsened 12.3%
8% better than State average

State average: 13.4%

Low Risk Residents with Bowel/Bladder Incontinence Info Percent of low risk long-stay residents who lose control of their bowels or bladder 12.3%
19% better than State average

State average: 15.1%

Falls with Major Injury Info Percent of long-stay residents experiencing one or more falls with major injury 5.0%
28% worse than State average

State average: 3.9%

High Risk Residents with Pressure Ulcers Info Percent of long-stay high risk residents with pressure ulcers 5.2%
9% worse than State average

State average: 4.7%

Urinary Tract Infection Info Percent of long-stay residents with a urinary tract infection 0.0%
100% better than State average

State average: 1.3%

Lost Too Much Weight Info Percent of long-stay residents who lose too much weight 0.0%
100% better than State average

State average: 5.0%

Depressive Symptoms Info Percent of long-stay residents who have depressive symptoms 1.4%
11% better than State average

State average: 1.5%

Antipsychotic Use Info Percent of long-stay residents who received an antipsychotic medication 1.7%
84% better than State average

State average: 10.5%

Pneumococcal Vaccine Info Percent of long-stay residents assessed and appropriately given the pneumococcal vaccine 100.0%
6% better than State average

State average: 94.4%

Influenza Vaccine Info Percent of long-stay residents assessed and appropriately given the seasonal influenza vaccine 98.4%
In line with State average

State average: 96.2%

Hospitalizations per 1,000 days Info Number of hospitalizations per 1,000 long-stay resident days. 2.58
31% worse than State average

State average: 1.97

ED visits per 1,000 days Info Number of outpatient emergency department visits per 1,000 long-stay resident days. 3.30
51% worse than State average

State average: 2.18

Short-stay resident measures
Below average State avg: 2.7 Info CMS star rating based on short-stay quality measure performance. 5 stars = much above average, 1 star = much below average.
Pneumococcal Vaccine Info Percent of short-stay residents assessed and appropriately given the pneumococcal vaccine 93.9%
16% better than State average

State average: 80.9%

Antipsychotic medication increase Info Percent of short-stay residents who newly received an antipsychotic medication 1.6%
7% worse than State average

State average: 1.5%

Influenza Vaccine Info Percent of short-stay residents assessed and appropriately given the seasonal influenza vaccine 91.1%
17% better than State average

State average: 77.7%

Re-hospitalized after SNF stay Info Percentage of short-stay residents who were re-hospitalized after their nursing home admission. 29.2%
16% worse than State average

State average: 25.2%

Emergency department visits Info Percentage of short-stay residents who had an outpatient emergency department visit. 18.9%
37% worse than State average

State average: 13.8%

Falls with major injury Info Percentage of SNF residents who experience falls with major injury during their stay. 0.0%
100% better than State average

State average: 0.8%

Ability to care for self at discharge Info Percentage of residents at or above expected ability to care for themselves at discharge. 59.7%
11% better than State average

State average: 53.7%

Successful return to home or community Info Rate of successful return to home or community from a skilled nursing facility. 59.5%
18% better than State average

State average: 50.6%

Breakdown by payment type

Medicare

34% of new residents, usually for short-term rehab.

Typical stay 1 - 2 months

Private pay

56% of new residents, often for short stays.

Typical stay 2 - 3 months

Medicaid

10% of new residents, often for long-term daily care.

Typical stay 3 - 4 years

Facility Characteristics

Source: CMS Long-Term Care Facility Characteristics (Data as of Jan 2026)

Total residents 63
Medicare
3
4.8% of residents
Medicaid
35
55.6% of residents
Private pay or other
25
39.7% of residents
Programs & Services
Residents Group

Residents meet regularly to discuss policies, care quality, and activities

Active Resident Council

Organized group of residents that meets regularly to discuss facility policies, quality of life, and activities.

Finances and operations

Based on CMS SNF Cost Report for fiscal year ending in 12/2023.

For-profit
Corporation
Net patient revenue Info Net patient revenue — what the home actually collects for resident care, after contractual allowances, bad debt and discounts are subtracted from its gross charges (CMS cost report, Worksheet G-3). It covers resident care only; money the home earns from other sources is shown separately as "Other income."
$7.9M
Net patient income Info Net patient income: net patient revenue minus the home's total operating expenses. A positive figure means it earns more from resident care than it spends to deliver it; a negative figure means the opposite. It excludes non-operating "other income."
$1.3M
For-profit Corporation
Net patient revenue Info Net patient revenue — what the home actually collects for resident care, after contractual allowances, bad debt and discounts are subtracted from its gross charges (CMS cost report, Worksheet G-3). It covers resident care only; money the home earns from other sources is shown separately as "Other income."
$7.9M
Net patient income Info Net patient income: net patient revenue minus the home's total operating expenses. A positive figure means it earns more from resident care than it spends to deliver it; a negative figure means the opposite. It excludes non-operating "other income."
$1.3M
Other income Info Money the home earns outside of resident care — such as investments, grants, rentals and other non-operating sources (CMS cost report, Worksheet G-3). It is tracked separately from net patient revenue: it is not part of that figure, and it is not included in net patient income.
$12.7K
Payroll costs Info Staff salaries plus wage-related costs — benefits such as payroll taxes, health insurance and retirement — from the home's own accounting records (CMS cost report, Worksheet A). Contract or agency labor is counted separately, under other operating costs.
$3.1M 39.8% of net patient revenue Info Payroll as a share of revenue: staff salaries and wage-related benefits divided by net patient revenue. A higher figure means more of each revenue dollar goes to staff pay.
Other operating costs Info Everything it costs to run the home apart from payroll — food, utilities, supplies, maintenance, contract labor and administration. Calculated as total operating expense minus payroll (staff salaries and wage-related benefits).
$3.4M
Total costs Info The home's total operating expense for the year — all the costs of running it, salaries included (CMS cost report, Worksheet G-3).
$6.6M

Who this home usually serves

TYPE OF STAY

Mix of rehab and long-term care

This home supports both short-term rehab and long-term care, with residents staying for a wide range of durations.

Most new residents arrive under private pay (56% of admissions), and a typical private pay stay runs around 2 - 3 months.

Admissions
148 total

Coverage residents most often arrive under.

Medicare 34%
Private pay 56%
Medicaid 10%
Discharges
149 total

Coverage residents most often leave under.

Medicare 38%
Private pay 56%
Medicaid 5%

Places of interest near Eaglecrest Nursing and Rehab

Address 0.0 miles from city center Info Estimated distance in miles from Ash Flat's city center to Eaglecrest Nursing and Rehab's address, calculated via Google Maps.

Calculate Travel Distance to Eaglecrest Nursing and Rehab

Add your location

Address

Compare Nursing Homes around the area

The information below is reported by the Arkansas Department of Human Services, Office of Long Term Care.

Eaglecrest Nursing and Rehab
NH
MC
RC
Ash Flat - 100 - 16 -
Barnes Healthcare
NH
MC
Lonoke - 141 A+ 38 Private / Shared Rooms
Timberlane Health & Rehab
NH
MC
RC
El Dorado - 106 A+ 33 -
Bear Creek Healthcare LLC
NH
De Queen - 131 - 35 -
Maple Healthcare
NH
Hazen - 70 - 21 Private / Shared Rooms

Frequently Asked Questions about Eaglecrest Nursing and Rehab

Who is the owner of Eaglecrest Nursing and Rehab?

Eaglecrest Nursing and Rehab is legally operated by AFNC, Inc., and administered by April Spurlock.

Is Eaglecrest Nursing and Rehab in a walkable area?

Eaglecrest Nursing and Rehab has a walk score of 16. Car-dependent. Most errands require a car, with limited nearby walkable options.

What is the occupancy rate at Eaglecrest Nursing and Rehab?

Eaglecrest Nursing and Rehab's occupancy is 74%.

Does Eaglecrest Nursing and Rehab operate as a for-profit or non-profit?

Eaglecrest Nursing and Rehab is registered as a for-profit in AR.

Who is the administrator of Eaglecrest Nursing and Rehab?

April Spurlock is the administrator of Eaglecrest Nursing and Rehab.

How many beds does Eaglecrest Nursing and Rehab have?

Eaglecrest Nursing and Rehab has 100 beds.

Are there photos of Eaglecrest Nursing and Rehab?

Yes — there are 9 photos of Eaglecrest Nursing and Rehab in the photo gallery on this page.

Guides for Better Senior Living

Care Cost Calculator: See Prices in Your Area

Nursing Home Data Explorer

Don’t Wait Too Long: 7 Red Flag Signs Your Parent Needs Assisted Living Now

The True Cost of Assisted Living in 2025 – And How Families Are Paying For It

Understanding Senior Living Costs: Pricing Models, Discounts & Financial Assistance