


Hospitalizations per 1,000 days
 Number of hospitalizations per 1,000 long-stay resident days.
2.70
Number of hospitalizations per 1,000 long-stay resident days.
2.70
Colorado average: 1.30

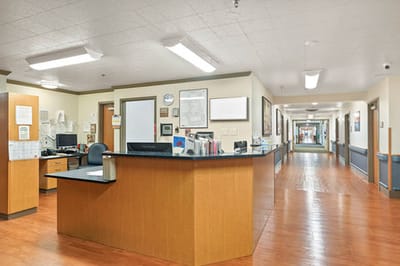
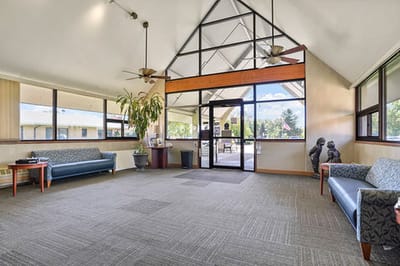
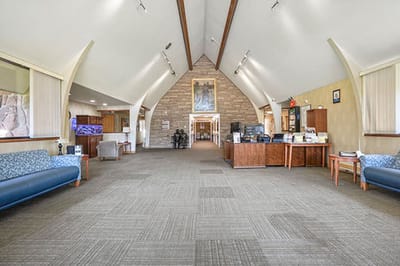
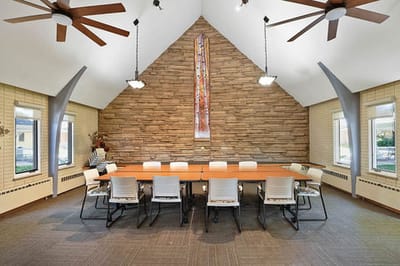
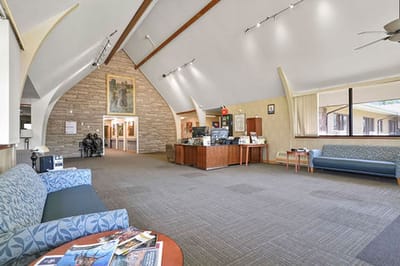
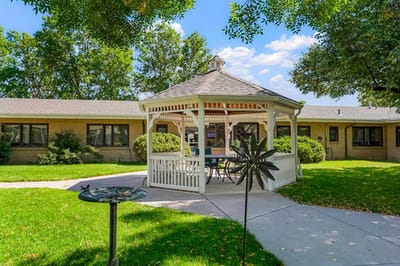
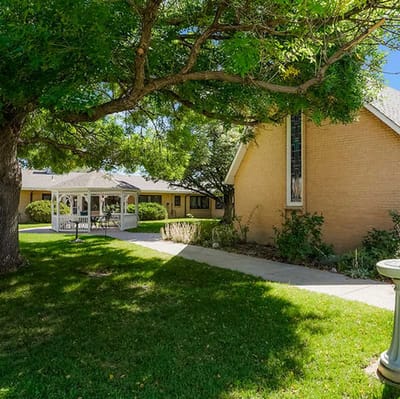
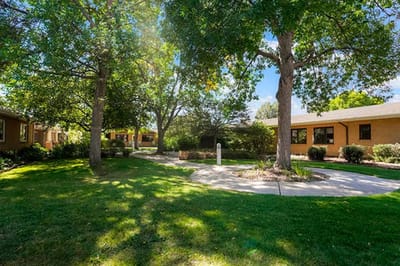
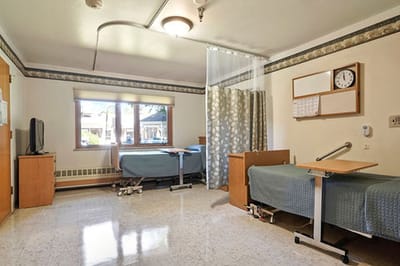
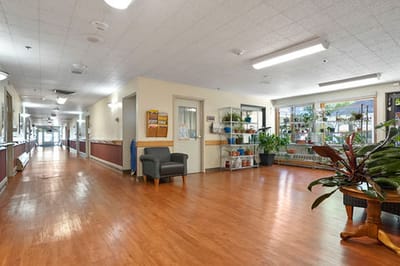
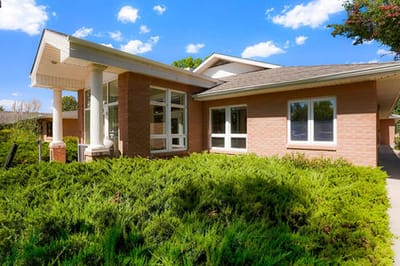
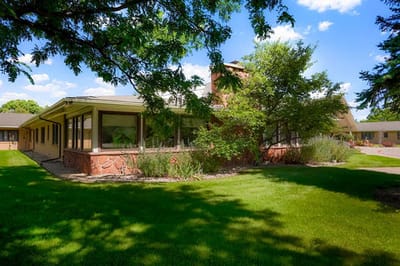
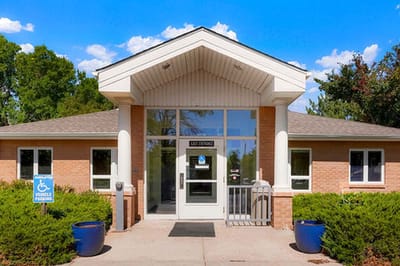

Owned by North Shore Manor, North Shore Health & Rehab Facility is a nursing home in Loveland, Colorado. Its location at West 29th Street is in a highly walkable neighborhood with a Walk Score of 88, making it easy for families and visitors to navigate the surrounding area while walking.
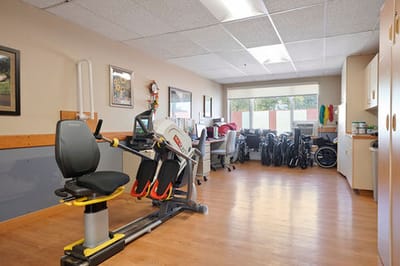
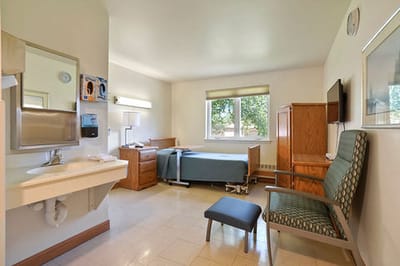
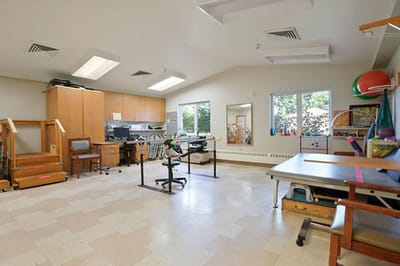
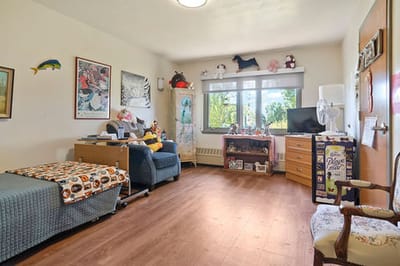
The 120-bed home specializes in rehabilitation and short-term post-acute care, with dedicated physical therapy services on-site. The care team includes registered nurses, nurse aides, and licensed practical nurses providing roughly 4 hours and 20 minutes of combined care per resident each day. This level of hands-on support helps residents recover from surgery, hospitalization, or illness.
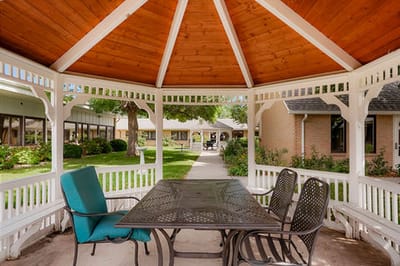
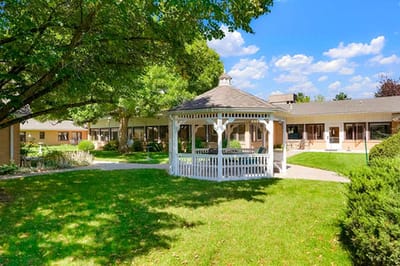
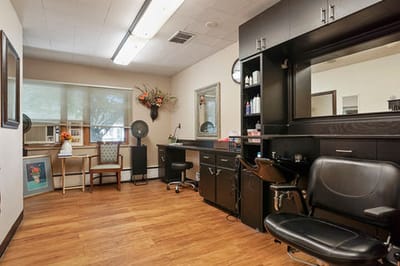
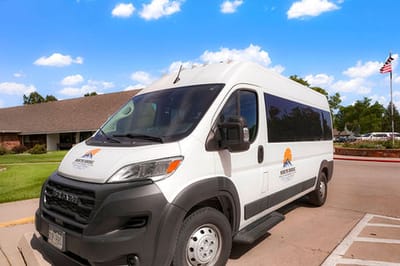
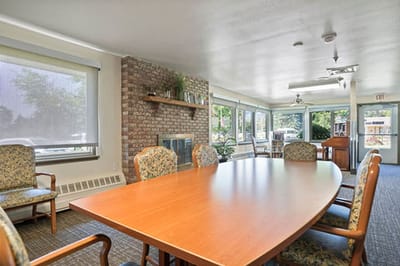
Residents are served with comforts and connection. An on-site chef prepares nutritious meals, with housekeeping and laundry services to support residents’ comfort. Amenities include a salon for hair and nail care, a chapel for residents who want to observe their faith, and transportation services for appointments and outings. There are also complimentary WiFi and landscaped gardens for residents who want to stay connected or spend quiet time outdoors.
State inspections reviewed clinical care and facility standards, with particular attention to infection control practices, pain management, and sanitation. Staffing responsiveness to resident needs and prompt care were also reviewed. These are ongoing areas of focus for the home, just like in other skilled nursing facilities.
| Staff type | Hours / Day / Resident | vs state avg |
|---|---|---|
|
Registered Nurse (RN)
| 1h 6m per day | ▲ 32% State avg: 50m per day · National avg: 41m per day |
|
LPN / LVN
| 42m per day | ■ Avg State avg: 41m per day · National avg: 52m per day |
|
Nurse Aide
| 2h 33m per day | ▲ 16% State avg: 2h 12m per day · National avg: 2h 20m per day |
|
Weekend Total Nursing
| 3h 47m per day | ▲ 16% State avg: 3h 16m per day · National avg: 3h 26m per day |
|
Physical Therapist
| 6m per day | ▲ 20% State avg: 5m per day · National avg: 4m per day |
|
Weekend RN
| 58m per day | ▲ 61% State avg: 36m per day · National avg: 28m per day |
North Shore Health &Amp; Rehab Facility is administered by Debra Lynn Majors.
In Colorado, the Department of Public Health and Environment, Health Facilities Division is the regulatory body that performs unannounced surveys and publishes facility inspection findings.
Deficiencies
| This Facility | CO Average | vs. CO Avg |
|---|---|---|---|
|
Total deficiencies
| 25 | 30 | This facility has 17% fewer total deficiencies than a typical Colorado nursing home (25 vs. CO avg 30).↓ 17% better |
|
Deficiencies per year
| 3.6 | 4.3 | This facility has 16% fewer deficiencies per year than a typical Colorado nursing home (3.6 vs. CO avg 4.3).↓ 16% better |
These measures show how residents usually do over time at this home, based on health outcomes and preventive care.
Colorado average: 1.30
Colorado average: 1.67
Colorado average: 20.3%
Colorado average: 12.8%
Colorado average: 0.8%
Colorado average: 53.7%
Colorado average: 50.6%
Quality measures are calculated from Minimum Data Set (MDS) assessments. For most measures, lower percentages indicate better care quality.
![]() 0.0 miles from city center
0.0 miles from city center
![]() Estimated distance in miles from Loveland's city center to North Shore Health &Amp; Rehab Facility's address, calculated via Google Maps.
Estimated distance in miles from Loveland's city center to North Shore Health &Amp; Rehab Facility's address, calculated via Google Maps.
Add your location
The information below is reported by the Colorado Department of Public Health and Environment, Health Facilities Division.
| The Green House Homes at Mirasol | NH HC PC | Loveland | 90
Facility
90
CO AVG
76
Rank
#198 / 533 |
91.0%
Facility
91.0%
CO AVG
76.5%
Rank
#36 / 221 | +19% | 6.27
Facility
6.27
CO AVG
3.86
Rank
#7 / 215 | -10% | +62% | $7.5k
Facility
$7.5k
CO AVG
$39.2k
Rank
#93 / 221 | 24
Facility
24
CO AVG
24.8
Rank
#120 / 221 | 6.0
Facility
6.0
CO AVG
5.2
Rank
#146 / 221 | - | 86 | - |
32
Facility
32
CO AVG
51
Rank
#664 / 872 | Loveland Elder Green House Homes For Life Enrichment A Colorado Non | $11.4M
Facility
$11.4M
CO AVG
$11.2M
Rank
#63 / 221 | $7.8M
Facility
$7.8M
CO AVG
$4.9M
Rank
#32 / 221 | 68.2%
Facility
68.2%
CO AVG
46.6%
Rank
#46 / 221 | 65412 | ||||
| North Shore Health and Rehabilitation Center | NH MC PC | Loveland | 120
Facility
120
CO AVG
76
Rank
#79 / 533 |
74.8%
Facility
74.8%
CO AVG
76.5%
Rank
#128 / 221 | -2% | 4.06
Facility
4.06
CO AVG
3.86
Rank
#58 / 215 | +12% | +5% | $0
Facility
$0
CO AVG
$39.2k
Rank
#1 / 221 | 22
Facility
22
CO AVG
24.8
Rank
#100 / 221 | 5.5
Facility
5.5
CO AVG
5.2
Rank
#132 / 221 | - | 90 | - |
35
Facility
35
CO AVG
51
Rank
#627 / 872 | John Wilson | $11.5M
Facility
$11.5M
CO AVG
$11.2M
Rank
#88 / 221 | $8.1M
Facility
$8.1M
CO AVG
$4.9M
Rank
#57 / 221 | 70.7%
Facility
70.7%
CO AVG
46.6%
Rank
#33 / 221 | 65129 | ||||
| Riverbend Health and Rehabilitation Center | NH NC | Loveland (Duffield Court) | 100
Facility
100
CO AVG
76
Rank
#161 / 533 |
72.4%
Facility
72.4%
CO AVG
76.5%
Rank
#137 / 221 | -5% | 3.28
Facility
3.28
CO AVG
3.86
Rank
#152 / 215 | +6% | -15% | $0
Facility
$0
CO AVG
$39.2k
Rank
#1 / 221 | 22
Facility
22
CO AVG
24.8
Rank
#100 / 221 | 7.3
Facility
7.3
CO AVG
5.2
Rank
#183 / 221 | 2 | 79 | - |
36
Facility
36
CO AVG
51
Rank
#616 / 872 | Rocky Mountain Snf Holdings LLC | $8.5M
Facility
$8.5M
CO AVG
$11.2M
Rank
#129 / 221 | $5.0M
Facility
$5.0M
CO AVG
$4.9M
Rank
#143 / 221 | 58.8%
Facility
58.8%
CO AVG
46.6%
Rank
#150 / 221 | 65165 |
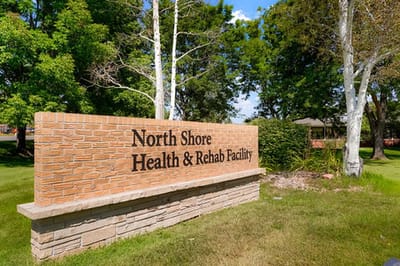
North Shore Health &Amp; Rehab Facility is located in LOVELAND, Colorado.
Here are the financial assistance programs available to residents in Colorado.
North Shore Health &Amp; Rehab Facility is legally operated by North Shore Manor, Inc., and administered by Debra Lynn Majors.
North Shore Health &Amp; Rehab Facility has a walk score of 88. Very walkable. Most errands can be accomplished on foot, and many essentials are within a short walk.
Debra Lynn Majors is the administrator of North Shore Health &Amp; Rehab Facility.
North Shore Health &Amp; Rehab Facility has 120 beds.
Yes — there are 27 photos of North Shore Health &Amp; Rehab Facility in the photo gallery on this page.
North Shore Health &Amp; Rehab Facility is located at 1365 W 29Th St, Loveland, CO 80538-2561.
(970) 667-6111 will put you in contact with the team at North Shore Health &Amp; Rehab Facility.
Care Cost Calculator: See Prices in Your Area
Nursing Home Data Explorer
Don’t Wait Too Long: 7 Red Flag Signs Your Parent Needs Assisted Living Now
The True Cost of Assisted Living in 2025 – And How Families Are Paying For It
Understanding Senior Living Costs: Pricing Models, Discounts & Financial Assistance


