


Total health inspections
3
State average 3.9
Last Health inspection on May 2025
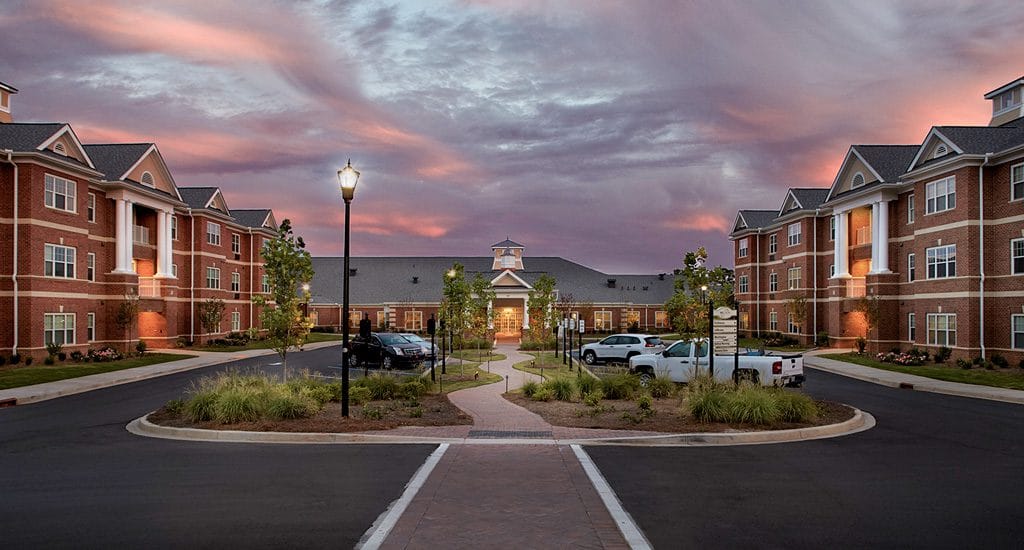
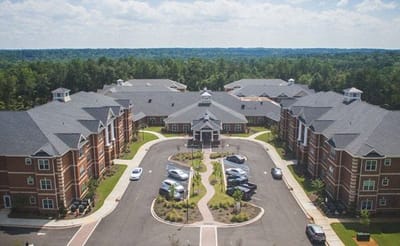
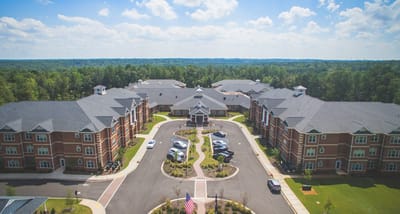
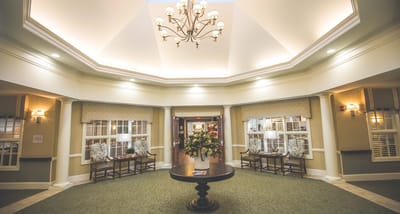
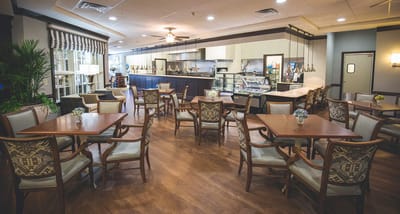
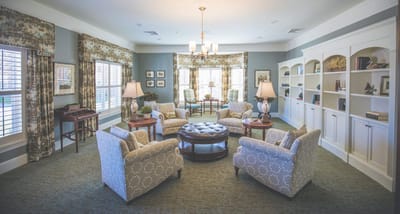
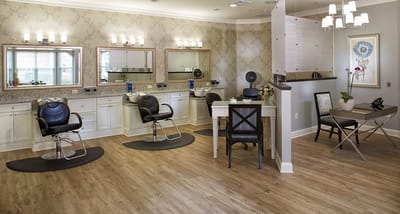
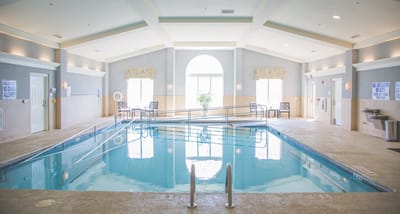
Wellmore of Lexington is a 174-bed continuing care retirement campus managed by administrator Crystal C. Butcher and operated by Wellmore of Lexington LLC. The facility blends independent living, assisted living, memory care, and 24-hour skilled nursing, leaning heavily on a short-term rehabilitation model. Admissions mirror this post-acute focus, with 76% using Medicare and 24% paying privately, generating a brief 51-day average stay. On-site features include an indoor therapy pool, a spa and salon, fine dining rooms, and dedicated workout spaces. However, the property faces severe occupancy challenges, sitting at 64.4%, and logged a 2023 operating loss of $1.6 million on $9.8 million in revenue.
Public health summaries show standard to solid daily attention, with overall nursing care averaging 4 hours and 9 minutes per resident to run slightly ahead of the South South Carolina baseline. This model keeps registered nurse coverage 32% above state averages, though the building relies on outside staffing agencies to fill about a quarter of its hours. Clinical tracking records detail a sharp split in patient outcomes; permanent residents maintain a zero percent depression rate and steady daily activity habits, but they experience high rates of pressure ulcers and urinary tract infections.
Short-stay rehab metrics also run behind state targets, with reports noting higher rates of emergency hospital readmissions and a major injury rate from short-term falls that tracks 60% worse than the state average. The operator’s regulatory history includes a low $16,000 in total federal fines over the past three years.
Interested individuals weighing local short-term rehab or extended senior care options can utilize these government tracking dossiers to view the provider’s overall operations. Since the public data notes above-average daily nursing times and strong behavioral health scores alongside clear multi-year financial losses, thin occupancy, and higher short-stay fall risks, the documentation calls for balancing the property’s amenities against its clinical trends.
| Staff type | Hours / Day / Resident | vs state avg |
|---|---|---|
|
Registered Nurse (RN)
|
48m per day | ▲ 27% State avg: 38m per day · National avg: 41m per day |
|
LPN / LVN
|
1h 12m per day | ▲ 18% State avg: 1h 1m per day · National avg: 52m per day |
|
Nurse Aide
|
2h 41m per day | ▲ 21% State avg: 2h 13m per day · National avg: 2h 20m per day |
|
Weekend Total Nursing
|
4h 28m per day | ▲ 33% State avg: 3h 21m per day · National avg: 3h 26m per day |
|
Physical Therapist
|
6m per day | ▲ 18% State avg: 5m per day · National avg: 4m per day |
|
Weekend RN
|
28m per day | ▲ 16% State avg: 24m per day · National avg: 28m per day |
Wellmore of Lexington is legally operated by Wellmore Of Lexington LLC, and administered by Crystal C Butcher.
State average 3.9
Last Health inspection on May 2025
State average 13.7
State average 3.44
Health citations are formal notices following inspections when they fail to comply with safety and care standards.
16 of 17 citations resulted from standard inspections; and 1 of 17 came from combined inspections (standard and complaint).
State average: 1
State average: 0.3
Reporting period: October 1 – December 31, 2025 (Q4 2025). Source: CMS Payroll-Based Journal report.
Manages medical care and health needs.
Assists with medical care and medications.
Helps with daily care and mobility.
Total hours from contractors
5,933 contractor hours this quarter
| Certified Nursing Assistant | 35 | 58 | 93 | 11,384 | 92 | 100% | 9 |
| Licensed Practical Nurse | 16 | 31 | 47 | 5,111 | 92 | 100% | 9.4 |
| Registered Nurse | 11 | 4 | 15 | 2,095 | 92 | 100% | 8.5 |
| Speech Language Pathologist | 0 | 7 | 7 | 1,051 | 70 | 76% | 4.6 |
| Clinical Nurse Specialist | 3 | 0 | 3 | 788 | 64 | 70% | 7.9 |
| Physical Therapy Aide | 0 | 4 | 4 | 726 | 70 | 76% | 4.2 |
| Other Dietary Services Staff | 2 | 0 | 2 | 557 | 68 | 74% | 7.7 |
| Nurse Practitioner | 2 | 1 | 3 | 527 | 55 | 60% | 8.3 |
| Administrator | 2 | 0 | 2 | 512 | 63 | 68% | 8 |
| Dental Services Staff | 1 | 0 | 1 | 479 | 66 | 72% | 7.3 |
| Respiratory Therapy Technician | 0 | 5 | 5 | 417 | 65 | 71% | 5 |
| Physical Therapy Assistant | 0 | 4 | 4 | 260 | 66 | 72% | 3.8 |
| Occupational Therapy Assistant | 0 | 1 | 1 | 41 | 6 | 7% | 6.8 |
| Therapeutic Recreation Specialist | 0 | 1 | 1 | 38 | 10 | 11% | 3.8 |
| Medical Director | 0 | 1 | 1 | 26 | 30 | 33% | 0.9 |
Includes penalties issued in 2025
Federal penalties imposed by CMS for regulatory violations, including civil money penalties (fines) and denials of payment for new Medicare/Medicaid admissions.
Source: CMS Penalties Database (Data as of Jan 2026)
South Carolina average: $34K
South Carolina average: 2.4
South Carolina average: 0.1
Penalties are imposed by CMS for violations of federal nursing home regulations.
1 penalty in the past 3 years
May 22, 2025 · $16K
Last updated: Jan 2026
These measures show how residents usually do over time at this home, based on health outcomes and preventive care.
South Carolina average: 8.7
South Carolina average: 15.5
South Carolina average: 13.1%
South Carolina average: 17.0%
South Carolina average: 3.0%
South Carolina average: 6.1%
South Carolina average: 1.6%
South Carolina average: 6.2%
South Carolina average: 2.8%
South Carolina average: 14.5%
South Carolina average: 90.5%
South Carolina average: 90.6%
South Carolina average: 2.03
South Carolina average: 1.91
South Carolina average: 79.5%
South Carolina average: 1.7%
South Carolina average: 78.0%
South Carolina average: 24.7%
South Carolina average: 14.1%
South Carolina average: 0.8%
South Carolina average: 53.7%
South Carolina average: 50.6%
Quality measures are calculated from Minimum Data Set (MDS) assessments. For most measures, lower percentages indicate better care quality.
76% of new residents, usually for short-term rehab.
24% of new residents, often for short stays.
Source: CMS Long-Term Care Facility Characteristics (Data as of Jan 2026)
Residents meet regularly to discuss policies, care quality, and activities
Part of a Continuing Care Retirement Community offering multiple care levels
Organized group of residents that meets regularly to discuss facility policies, quality of life, and activities.
Data sourced from CMS Long-Term Care Facility Characteristics quarterly report. Payer mix reflects the current resident census by primary payment source.
Historical financial and operational data for Wellmore of Lexington from 2019–2023, based on CMS SNF Cost Reports.
Key figures below are for fiscal year ending in 12/2023.
Based on CMS SNF Cost Report for fiscal year ending in 12/2023.
Pets Allowed
Most residents typically stay for a few weeks or months before returning home or moving on.
Most new residents arrive under Medicare (76% of admissions), and a typical Medicare stay runs around 28 days.
Coverage residents most often arrive under.
Coverage residents most often leave under.
![]() 200 Wellmore Dr, Lexington, SC 29072
200 Wellmore Dr, Lexington, SC 29072
Add your location
Info below is compiled from CMS reports & the SC Dept. of Public Health (DPH), senior community websites & trusted data sources such as Walk Score & BBB.
Communities are listed from highest to lowest based on our ranking methodology.
|
|
|
|
|
|
|
|
|
|
|
|
|
|
|
|
|
|
|
|
|
|
|
|
|
|
|---|---|---|---|---|---|---|---|---|---|---|---|---|---|---|---|---|---|---|---|---|---|---|---|---|
| The Village at Summerville |
NH
AL
IL
MC
RC
SNF
|
Summerville (Palmetto Park) |
48
Facility
48
SC AVG
90
Rank
#266 / 307
|
83.3%
Facility
83.3%
SC AVG
84.8
Rank
#73 / 94
| -2% |
4.14
Facility
4.14
SC AVG
4.00
Rank
#41 / 118
| +3% | +4% |
$0
Facility
$0
SC AVG
$34.8k
Rank
#1 / 120
|
2
Facility
2
SC AVG
13.7
Rank
#2 / 119
|
2.0
Facility
2.0
SC AVG
3.4
Rank
#14 / 119
| - | 40 | - |
45
Facility
45
SC AVG
32
Rank
#58 / 230
| Presbyterian Communities Of South Carolina |
$23.7MFiscal year ending 12/2023
Facility
$23.7MFiscal year ending 12/2023
SC AVG
$13.0M
Rank
#10 / 121
|
$11.7MFiscal year ending 12/2023
Facility
$11.7MFiscal year ending 12/2023
SC AVG
$5.4M
Rank
#6 / 121
|
49.2%Fiscal year ending 12/2023
Facility
49.2%Fiscal year ending 12/2023
SC AVG
44%
Rank
#75 / 121
| 425389 | ||||
| Nhc Healthcare Anderson |
NH
HC
HOS
SNF
|
Anderson |
290
Facility
290
SC AVG
90
Rank
#2 / 307
|
96.0%
Facility
96.0%
SC AVG
84.8
Rank
#17 / 94
| +13% |
3.53
Facility
3.53
SC AVG
4.00
Rank
#81 / 118
| -13% | -12% |
$0
Facility
$0
SC AVG
$34.8k
Rank
#1 / 120
|
6
Facility
6
SC AVG
13.7
Rank
#20 / 119
|
3.0
Facility
3.0
SC AVG
3.4
Rank
#54 / 119
| - | 278 | - | - | Bradley Moorhouse |
$28.4MFiscal year ending 12/2023
Facility
$28.4MFiscal year ending 12/2023
SC AVG
$13.0M
Rank
#3 / 121
|
$17.7MFiscal year ending 12/2023
Facility
$17.7MFiscal year ending 12/2023
SC AVG
$5.4M
Rank
#4 / 121
|
62.5%Fiscal year ending 12/2023
Facility
62.5%Fiscal year ending 12/2023
SC AVG
44%
Rank
#71 / 121
| 425052 | ||||
| Nhc Healthcare Clinton |
NH
HC
HOS
SNF
|
Clinton |
131
Facility
131
SC AVG
90
Rank
#53 / 307
|
96.6%
Facility
96.6%
SC AVG
84.8
Rank
#10 / 94
| +14% |
3.83
Facility
3.83
SC AVG
4.00
Rank
#60 / 118
| +20% | -4% |
$0
Facility
$0
SC AVG
$34.8k
Rank
#1 / 120
|
5
Facility
5
SC AVG
13.7
Rank
#14 / 119
|
1.7
Facility
1.7
SC AVG
3.4
Rank
#11 / 119
| - | 127 | - | - | Charles Holder |
$12.8MFiscal year ending 12/2023
Facility
$12.8MFiscal year ending 12/2023
SC AVG
$13.0M
Rank
#46 / 121
|
$8.3MFiscal year ending 12/2023
Facility
$8.3MFiscal year ending 12/2023
SC AVG
$5.4M
Rank
#36 / 121
|
64.7%Fiscal year ending 12/2023
Facility
64.7%Fiscal year ending 12/2023
SC AVG
44%
Rank
#68 / 121
| 425071 | ||||
| Lakes at Litchfield Assisted Living |
NH
AL
IL
MC
SNF
|
Pawleys Island |
79
Facility
79
SC AVG
90
Rank
#172 / 307
| - | - |
4.83
Facility
4.83
SC AVG
4.00
Rank
#20 / 118
| -57% | +21% |
$5.2k
Facility
$5.2k
SC AVG
$34.8k
Rank
#59 / 120
|
9
Facility
9
SC AVG
13.7
Rank
#44 / 119
|
2.3
Facility
2.3
SC AVG
3.4
Rank
#29 / 119
| - | 14 | A+ | - | Litchfield Retirement LLC |
$3.9MFiscal year ending 12/2023
Facility
$3.9MFiscal year ending 12/2023
SC AVG
$13.0M
Rank
#34 / 121
|
$5.5MFiscal year ending 12/2023
Facility
$5.5MFiscal year ending 12/2023
SC AVG
$5.4M
Rank
#75 / 121
|
141.7%Fiscal year ending 12/2023
Facility
141.7%Fiscal year ending 12/2023
SC AVG
44%
Rank
#110 / 121
| 425380 | ||||
| Wellmore of Lexington |
NH
AL
IL
MC
SNF
|
Lexington |
174
Facility
174
SC AVG
90
Rank
#16 / 307
| - | - |
4.15
Facility
4.15
SC AVG
4.00
Rank
#36 / 118
| -15% | +4% |
$16.2k
Facility
$16.2k
SC AVG
$34.8k
Rank
#92 / 120
|
17
Facility
17
SC AVG
13.7
Rank
#88 / 119
|
5.7
Facility
5.7
SC AVG
3.4
Rank
#110 / 119
| 1 | 46 | - | - | Wellmore Of Lexington LLC |
$7.8MFiscal year ending 12/2023
Facility
$7.8MFiscal year ending 12/2023
SC AVG
$13.0M
Rank
#25 / 121
|
$7.5MFiscal year ending 12/2023
Facility
$7.5MFiscal year ending 12/2023
SC AVG
$5.4M
Rank
#27 / 121
|
96.3%Fiscal year ending 12/2023
Facility
96.3%Fiscal year ending 12/2023
SC AVG
44%
Rank
#90 / 121
| 425412 |
According to SC state health department records, Wellmore of Lexington's license number is CRC-1557.
Wellmore of Lexington's occupancy is 64.4%.
Yes, Wellmore of Lexington allows residents to bring their pets.
Wellmore of Lexington is registered as a for-profit in SC.
Crystal C. Butcher is the administrator of Wellmore of Lexington.
Wellmore of Lexington has 174 beds.
Yes — there are 9 photos of Wellmore of Lexington in the photo gallery on this page.
Care Cost Calculator: See Prices in Your Area
Nursing Home Data Explorer
Don’t Wait Too Long: 7 Red Flag Signs Your Parent Needs Assisted Living Now
The True Cost of Assisted Living in 2025 – And How Families Are Paying For It
Understanding Senior Living Costs: Pricing Models, Discounts & Financial Assistance


