


Arbor Terrace Senior Living
Assisted Living & Memory Care · Hyattsville, MD


Arbor Terrace Senior Living
Assisted Living & Memory Care · Hyattsville, MD
Overview of Arbor Terrace Senior Living
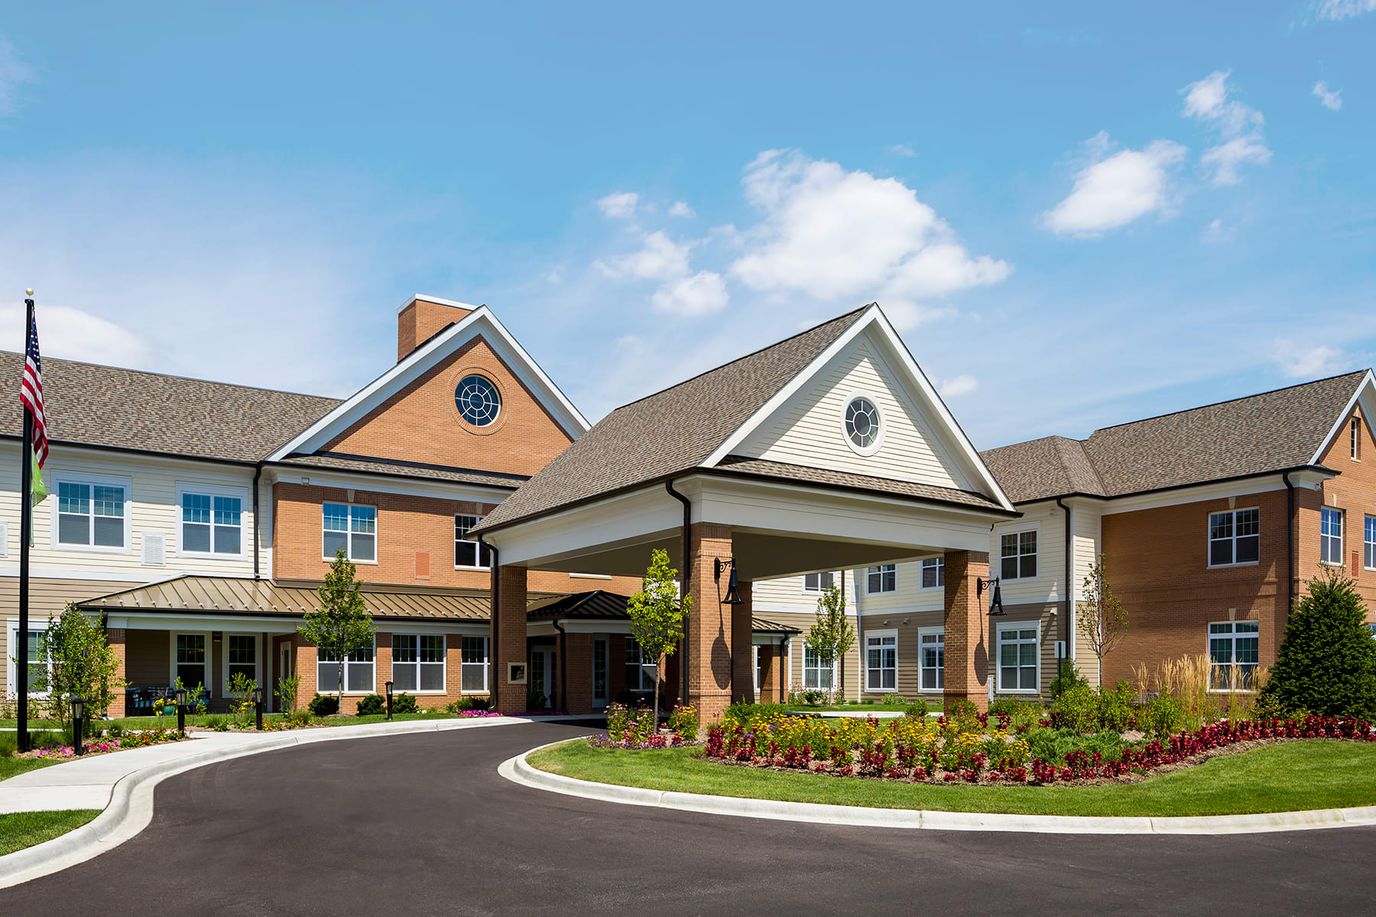
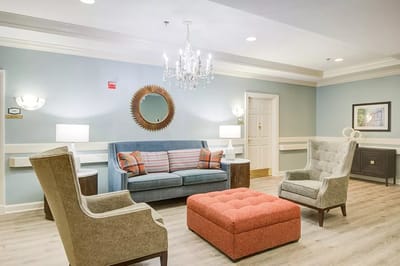
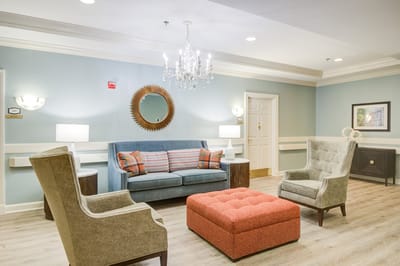
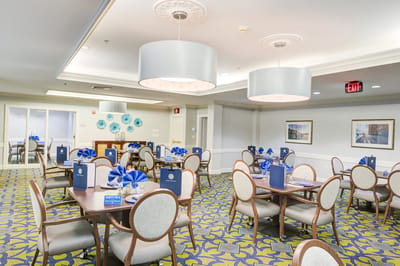
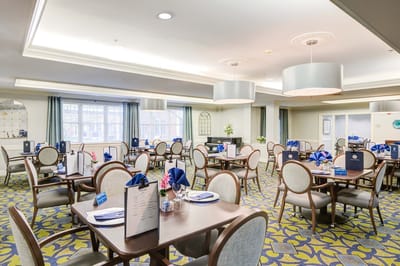
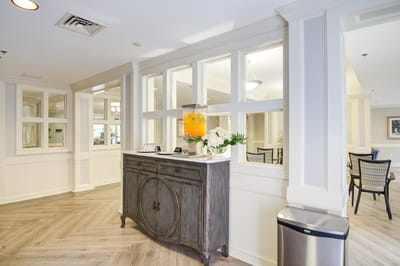
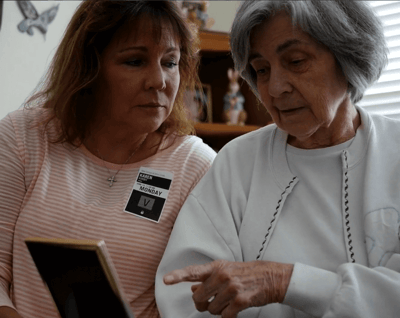
Arbor Terrace Senior Living, located in Lanham, Maryland, is a distinguished community that epitomizes luxury and an active lifestyle for seniors. Their unwavering commitment is to provide residents with an abundance of positive experiences and engaging activities. With a variety of living options available, such as independent living, assisted living, bridges care, and memory care, Arbor Terrace caters to the unique needs of each individual. The dedicated team at Arbor Terrace is well-equipped to assist residents with medication management and provide specialized diabetic care.
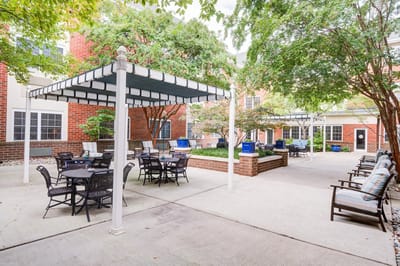
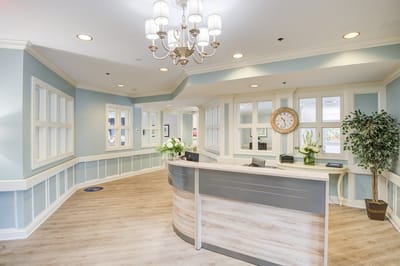
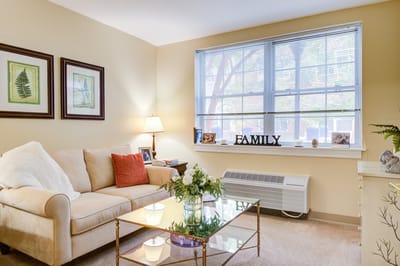
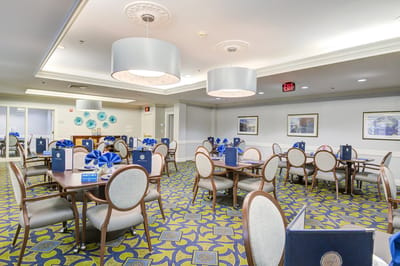
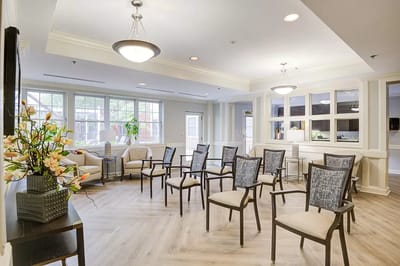
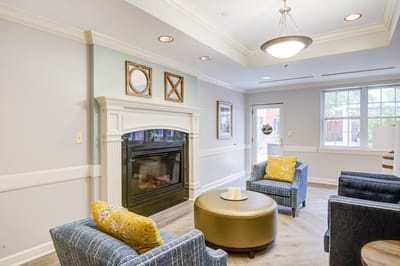
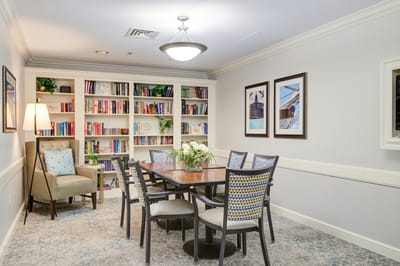
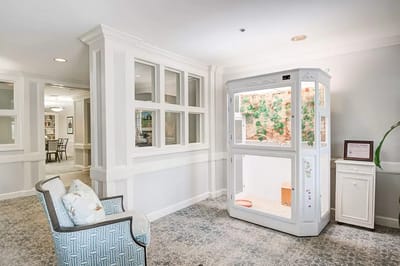
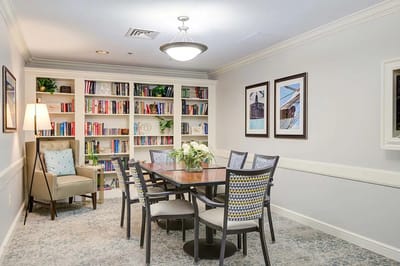
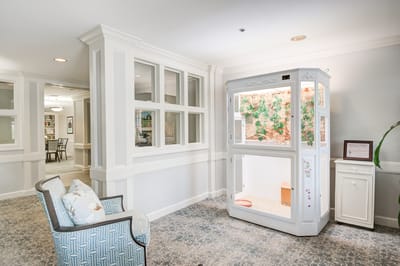
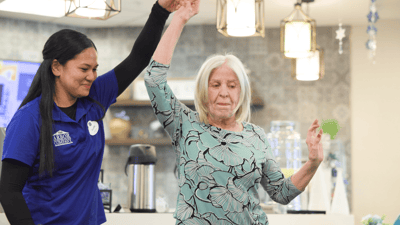
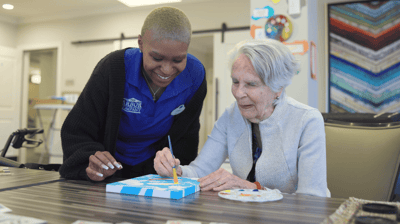
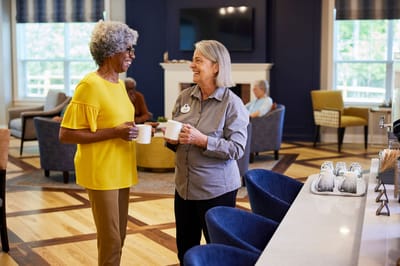
Arbor Terrace also takes pride in being a pet-friendly community, recognizing the importance of pets in the lives of their residents. With a comprehensive range of services, including concierge services, housekeeping, and delectable chef-prepared meals, Arbor Terrace ensures a truly remarkable senior living experience. Beyond the comfort of their apartments, residents can explore the captivating butterfly garden and serene indoor atrium. Indoor and outdoor common areas provide opportunities for socialization and engagement, whether it’s playing the piano, enjoying the game room, or discovering their artistic side in the arts and crafts center.
125-bed community Rank #74 / 697Bed count — State benchmarkedThis home is ranked 74th out of 697 homes in Maryland. Shows this facility's certified or reported bed count compared to other Maryland facilities. Larger communities may offer more amenities, programs, and on-site services for residents and families.Click the rank badge to see the full State ranking.Click here to see the full State ranking.
A larger shared setting that may offer more common spaces and organized community services.
27 years in operation Rank #61 / 208Years in operation — State benchmarkedThis home is ranked 61st out of 208 homes in Maryland. Shows how long this facility has been in operation compared to other Maryland facilities. Longer operating histories may benefit residents, families, and staff.Click the rank badge to see the full State ranking.Click here to see the full State ranking.
A longer operating history, which may indicate experience navigating regulations and delivering ongoing care.
Walk Score: 52 / 100 Rank #402 / 985Walk Score — State benchmarkedThis home is ranked 402nd out of 985 homes in Maryland. Shows how walkable this facility's neighborhood is compared to the average Walk Score across Maryland facilities. Higher scores benefit residents, families, and staff.Click the rank badge to see the full State ranking.Click here to see the full State ranking.
Moderately walkable. Some errands can be accomplished on foot, with a mix of nearby amenities.
About this community
AwardsBest of the Best by Argentum, Great Place to Work certified
Facility TypeAl
CountyPrince George's
Profit StatusTrue
Private Room
$130 - $130 per day
Semi-Private Room
$141 - $141 per day
Hospice Affiliations
Staffing
Key information about the people who lead and staff this community.
No CNA training program
Does not accept Medicare
Licensed Nurses/CNAs
Dedicated Alzheimer's Unit
Mild Alzheimer's Level
Moderate Alzheimer's Level
Severe Alzheimer's Level
Pets Allowed
HousekeepingYes
Linen ServiceYes
Utilities IncludedYes
Dining Options
Concierge Services
Exercise And Wellness Programs
Personal Linen And Laundry Services
Housekeeping Services
Full Range Of Activities For Engaging Residents
Assisted Living$3,500 per month
Memory Care$6,400 per month
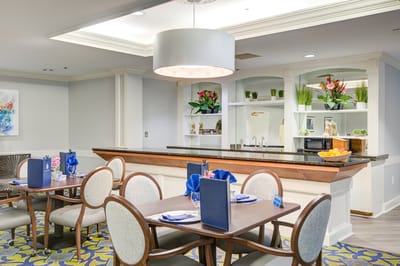
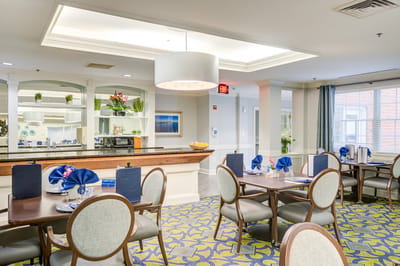
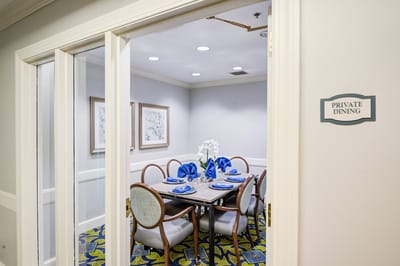
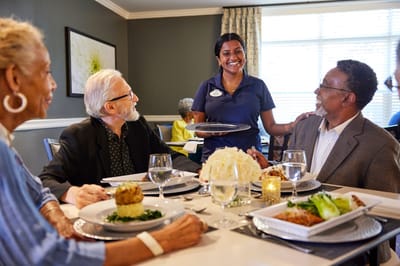
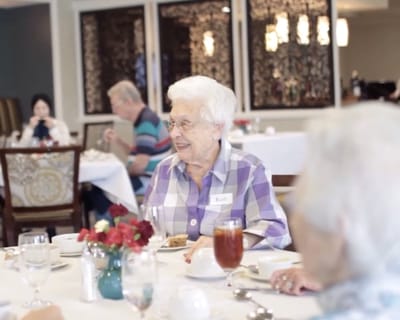
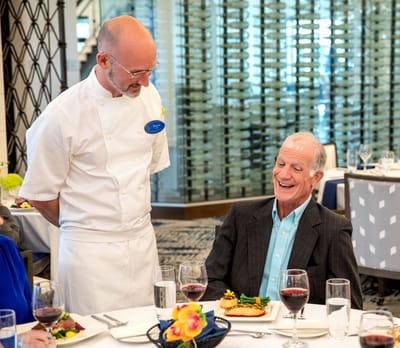
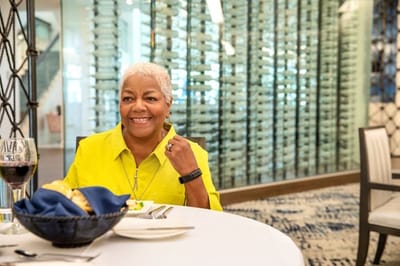
Food DescriptionDining at Arbor Terrace Senior Living is vibrant, social, and full of flavor, featuring chef-prepared meals with fresh, local ingredients.
Demographics
Resident demographic information for this facility.
Gender
- Female 70.6%
- Male 29.4%
Age Distribution
- 85-94 36.8%
- 75-84 29.4%
- 65-74 14.7%
- 95+ 14.7%
- ≤64 4.4%
Ethnicity
- African American 95.6%
- White 4.4%
Places of interest near Arbor Terrace Senior Living
![]() 8.5 miles from city center
8.5 miles from city center
![]() Estimated distance in miles from Lanham's city center to Arbor Terrace Senior Living's address, calculated via Google Maps.
— 7.06 miles to nearest hospital (UM Laurel Medical Center)
Estimated distance in miles from Lanham's city center to Arbor Terrace Senior Living's address, calculated via Google Maps.
— 7.06 miles to nearest hospital (UM Laurel Medical Center)
Calculate Travel Distance to Arbor Terrace Senior Living
Add your location
Financial Assistance for
Assisted Living in Maryland
Arbor Terrace Senior Living is located in Lanham, Maryland.
Here are the financial assistance programs available to residents in Maryland.
Compare Assisted Living around Hyattsville
The information below is reported by the Maryland Department of Health, Office of Health Care Quality.
| Independence Court of Hyattsville |
AL Assisted Living A licensed, long-term care setting for seniors or individuals with disabilities who need help with daily activities — like bathing, dressing, and medication management — but not 24-hour skilled nursing. Offers housing, meals, and around-the-clock support while aiming to maximize resident independence.
MC Memory Care Secured, specialized care for people living with Alzheimer's or dementia. Staff trained in cognitive impairment, with higher staff-to-resident ratios and an environment designed to reduce confusion and wandering risk.
RC Respite Care Short-term temporary care — days to weeks — to give family caregivers a break. Full care provided during the stay. Often used after hospitalization or to trial a facility before a permanent placement decision. | Hyattsville (Queens Chapel Manor) | 130
Facility
130
MD AVG
43
Rank
#66 / 697 | Yes |
64
Facility
64
MD AVG
43
Rank
#261 / 985 | - | 35
Facility
35
MD AVG
21
Rank
#18 / 208 |
44% Male Residents — State Benchmarked 44% of residents are male, compared to the Maryland average of 31%. A relatively balanced gender mix for assisted living, where facilities typically skew heavily female. |
56% Female Residents — State Benchmarked 56% of residents are female, compared to the Maryland average of 69%. Closer to an even gender split than most assisted living facilities, which typically have 65–75% female residents. |
24% White Residents — State Benchmarked 24% of residents are reported as White, compared to the Maryland average of 81%. A lower White share than the Maryland average — the community may draw a more diverse resident mix relative to other facilities in Maryland. |
68% African American Residents — State Benchmarked 68% of residents are reported as African American or Black, compared to the Maryland average of 13%. A higher African American share than the typical Maryland average — useful context when comparing cultural fit and community composition. |
8% Other Ethnicity Residents — State Benchmarked 8% of residents fall into categories other than White or African American (combined), compared to the Maryland average of 6%. This column aggregates Hispanic, Asian, multiracial, and any other labeled groups that are not classified as White or African American. Reported subgroups in this total: Other (6%), Asian (2%). |
18% Residents Age 65–74 — State Benchmarked 18% of residents are 65–74, compared to the Maryland average of 13%. A higher share of younger seniors often signals a more independent, active resident community with lower acuity care needs. |
42% Residents Age 75–84 — State Benchmarked 42% of residents are 75–84, compared to the Maryland average of 31%. A high concentration in this mid-range bracket, where residents typically need moderate support with daily activities. |
22% Residents Age 85–94 — State Benchmarked 22% of residents are 85–94, compared to the Maryland average of 44%. The population here skews younger than the statewide norm, which may indicate a more active, lower-acuity community. |
14% Residents Age 95+ — State Benchmarked 14% of residents are 95 or older, compared to the Maryland average of 16%. In line with the statewide profile for the oldest resident bracket. |
| Arbor Terrace Senior Living |
AL Assisted Living A licensed, long-term care setting for seniors or individuals with disabilities who need help with daily activities — like bathing, dressing, and medication management — but not 24-hour skilled nursing. Offers housing, meals, and around-the-clock support while aiming to maximize resident independence.
MC Memory Care Secured, specialized care for people living with Alzheimer's or dementia. Staff trained in cognitive impairment, with higher staff-to-resident ratios and an environment designed to reduce confusion and wandering risk. | Lanham | 125
Facility
125
MD AVG
43
Rank
#74 / 697 | No |
52
Facility
52
MD AVG
43
Rank
#402 / 985 | - | 27
Facility
27
MD AVG
21
Rank
#61 / 208 |
29% Male Residents — State Benchmarked 29% of residents are male, compared to the Maryland average of 31%. This facility caters to a majority female resident pool (71% female), consistent with the broader assisted living trend where women significantly outnumber men. |
71% Female Residents — State Benchmarked 71% of residents are female, compared to the Maryland average of 69%. Women comprise the large majority, consistent with national assisted living demographics where women live longer and enter care facilities at higher rates. |
4% White Residents — State Benchmarked 4% of residents are reported as White, compared to the Maryland average of 81%. A lower White share than the Maryland average — the community may draw a more diverse resident mix relative to other facilities in Maryland. |
96% African American Residents — State Benchmarked 96% of residents are reported as African American or Black, compared to the Maryland average of 13%. A higher African American share than the typical Maryland average — useful context when comparing cultural fit and community composition. |
0% Other Ethnicity Residents — State Benchmarked 0% of residents fall into categories other than White or African American (combined), compared to the Maryland average of 6%. This column aggregates Hispanic, Asian, multiracial, and any other labeled groups that are not classified as White or African American. |
15% Residents Age 65–74 — State Benchmarked 15% of residents are 65–74, compared to the Maryland average of 13%. In line with the statewide profile for this youngest senior bracket in assisted living. |
29% Residents Age 75–84 — State Benchmarked 29% of residents are 75–84, compared to the Maryland average of 31%. This is the second most common age bracket in assisted living, representing residents with moderate care needs. |
37% Residents Age 85–94 — State Benchmarked 37% of residents are 85–94, compared to the Maryland average of 44%. The population here skews younger than the statewide norm, which may indicate a more active, lower-acuity community. |
15% Residents Age 95+ — State Benchmarked 15% of residents are 95 or older, compared to the Maryland average of 16%. In line with the statewide profile for the oldest resident bracket. |
| The Terraces at Tuckerman Lane |
AL Assisted Living A licensed, long-term care setting for seniors or individuals with disabilities who need help with daily activities — like bathing, dressing, and medication management — but not 24-hour skilled nursing. Offers housing, meals, and around-the-clock support while aiming to maximize resident independence.
MC Memory Care Secured, specialized care for people living with Alzheimer's or dementia. Staff trained in cognitive impairment, with higher staff-to-resident ratios and an environment designed to reduce confusion and wandering risk.
NH Nursing Home Licensed facility providing 24/7 skilled nursing care for residents with complex, ongoing medical needs. Staffed by RNs, LPNs, and CNAs. Inspected and star-rated annually by CMS. Accepts Medicare (short-term rehab) and Medicaid (long-term care).
RC Respite Care Short-term temporary care — days to weeks — to give family caregivers a break. Full care provided during the stay. Often used after hospitalization or to trial a facility before a permanent placement decision.
NH Nursing Home Licensed facility providing 24/7 skilled nursing care for residents with complex, ongoing medical needs. Staffed by RNs, LPNs, and CNAs. Inspected and star-rated annually by CMS. Accepts Medicare (short-term rehab) and Medicaid (long-term care). | North Bethesda | 101
Facility
101
MD AVG
43
Rank
#116 / 697 | No |
39
Facility
39
MD AVG
43
Rank
#534 / 985 | studio / suite / 1 bed | 28
Facility
28
MD AVG
21
Rank
#53 / 208 |
45% Male Residents — State Benchmarked 45% of residents are male, compared to the Maryland average of 31%. A relatively balanced gender mix for assisted living, where facilities typically skew heavily female. |
55% Female Residents — State Benchmarked 55% of residents are female, compared to the Maryland average of 69%. Closer to an even gender split than most assisted living facilities, which typically have 65–75% female residents. |
75% White Residents — State Benchmarked 75% of residents are reported as White, compared to the Maryland average of 81%. Close to the average for this category among assisted living facilities in Maryland with reported race/ethnicity data. |
15% African American Residents — State Benchmarked 15% of residents are reported as African American or Black, compared to the Maryland average of 13%. In line with the Maryland average for African American residents among facilities reporting this breakdown. |
9% Other Ethnicity Residents — State Benchmarked 9% of residents fall into categories other than White or African American (combined), compared to the Maryland average of 6%. This column aggregates Hispanic, Asian, multiracial, and any other labeled groups that are not classified as White or African American. Reported subgroups in this total: Asian (5%), Hispanic (3%), American Indian (2%). |
11% Residents Age 65–74 — State Benchmarked 11% of residents are 65–74, compared to the Maryland average of 13%. In line with the statewide profile for this youngest senior bracket in assisted living. |
26% Residents Age 75–84 — State Benchmarked 26% of residents are 75–84, compared to the Maryland average of 31%. Below the state norm — the resident mix may skew either younger or older than this typical middle bracket. |
48% Residents Age 85–94 — State Benchmarked 48% of residents are 85–94, compared to the Maryland average of 44%. This is typically the most common age bracket in assisted living — this facility is in line with the statewide norm. |
14% Residents Age 95+ — State Benchmarked 14% of residents are 95 or older, compared to the Maryland average of 16%. In line with the statewide profile for the oldest resident bracket. |
| Malta House |
AL Assisted Living A licensed, long-term care setting for seniors or individuals with disabilities who need help with daily activities — like bathing, dressing, and medication management — but not 24-hour skilled nursing. Offers housing, meals, and around-the-clock support while aiming to maximize resident independence.
HC Home Care Professional care delivered in the person's own home — from companionship and errands to skilled nursing and therapy. Allows seniors to age in place. Medicare covers skilled home health when medically necessary.
PC Palliative Care | Chillum (Avondale Terrace) | 16
Facility
16
MD AVG
43
Rank
#260 / 697 | Yes |
43
Facility
43
MD AVG
43
Rank
#495 / 985 | - | 30
Facility
30
MD AVG
21
Rank
#44 / 208 |
25% Male Residents — State Benchmarked 25% of residents are male, compared to the Maryland average of 31%. This facility caters to a majority female resident pool (75% female), consistent with the broader assisted living trend where women significantly outnumber men. |
75% Female Residents — State Benchmarked 75% of residents are female, compared to the Maryland average of 69%. Women comprise the large majority, consistent with national assisted living demographics where women live longer and enter care facilities at higher rates. |
58% White Residents — State Benchmarked 58% of residents are reported as White, compared to the Maryland average of 81%. A lower White share than the Maryland average — the community may draw a more diverse resident mix relative to other facilities in Maryland. |
42% African American Residents — State Benchmarked 42% of residents are reported as African American or Black, compared to the Maryland average of 13%. A higher African American share than the typical Maryland average — useful context when comparing cultural fit and community composition. |
0% Other Ethnicity Residents — State Benchmarked 0% of residents fall into categories other than White or African American (combined), compared to the Maryland average of 6%. This column aggregates Hispanic, Asian, multiracial, and any other labeled groups that are not classified as White or African American. |
17% Residents Age 65–74 — State Benchmarked 17% of residents are 65–74, compared to the Maryland average of 13%. A higher share of younger seniors often signals a more independent, active resident community with lower acuity care needs. |
33% Residents Age 75–84 — State Benchmarked 33% of residents are 75–84, compared to the Maryland average of 31%. This is the second most common age bracket in assisted living, representing residents with moderate care needs. |
42% Residents Age 85–94 — State Benchmarked 42% of residents are 85–94, compared to the Maryland average of 44%. This is typically the most common age bracket in assisted living — this facility is in line with the statewide norm. |
8% Residents Age 95+ — State Benchmarked 8% of residents are 95 or older, compared to the Maryland average of 16%. Most residents here have not yet reached the oldest-old bracket, suggesting a younger overall community. |
| Home Away From Home, LLC |
AL Assisted Living A licensed, long-term care setting for seniors or individuals with disabilities who need help with daily activities — like bathing, dressing, and medication management — but not 24-hour skilled nursing. Offers housing, meals, and around-the-clock support while aiming to maximize resident independence. | Hyattsville | 8
Facility
8
MD AVG
43
Rank
#315 / 697 | No |
72
Facility
72
MD AVG
43
Rank
#160 / 985 | Studio / Semi-Private / 1 Bed / 2 Bed | - | - | - | - | - | - | - | - | - | - |
Frequently Asked Questions about Arbor Terrace Senior Living
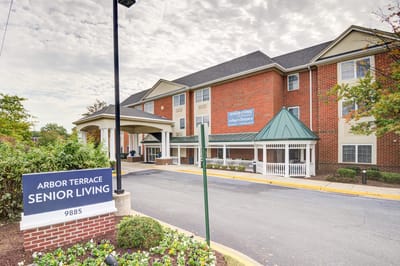
What neighborhood is Arbor Terrace Senior Living in?
Arbor Terrace Senior Living is in the Lanham neighborhood of Lanham.
Is Arbor Terrace Senior Living in a walkable area?
Arbor Terrace Senior Living has a walk score of 52. Moderately walkable. Some errands can be accomplished on foot, with a mix of nearby amenities.
How many beds does Arbor Terrace Senior Living have?
Arbor Terrace Senior Living has 125 beds.
Are there photos of Arbor Terrace Senior Living?
Yes — there are 48 photos of Arbor Terrace Senior Living in the photo gallery on this page.
What is the phone number of Arbor Terrace Senior Living?
(301) 298-2815 will put you in contact with the team at Arbor Terrace Senior Living.
What county is Arbor Terrace Senior Living located in?
Arbor Terrace Senior Living is in Prince George's County.
Is Arbor Terrace Senior Living Medicare or Medicaid certified?
Arbor Terrace Senior Living is not currently listed as a CMS-certified provider of Medicare or Medicaid.
Guides for Better Senior Living
Care Cost Calculator: See Prices in Your Area
Nursing Home Data Explorer
Don’t Wait Too Long: 7 Red Flag Signs Your Parent Needs Assisted Living Now
The True Cost of Assisted Living in 2025 – And How Families Are Paying For It
Understanding Senior Living Costs: Pricing Models, Discounts & Financial Assistance
Contact Us

Updated on
Feedback
Write a review for Arbor Terrace Senior Living
Rate your overall experience with this community
Explore Open Rooms
1
Contact details
2
What type of senior care service are you looking for?
3
What budget do you have in mind for senior care?
4
How soon do you need to find care?
5
Additional details
Thank you for your interest!
Our team will be in touch shortly to help with next steps.
Need Help?
Let us help you or a loved one find the perfect senior home.
