Maryland average 3.9
Last Health inspection on Nov 2025

We arrange tours, appointments, and even moving support so you don’t have to
Thank you for your interest!
Our team will be in touch shortly to help with next steps.
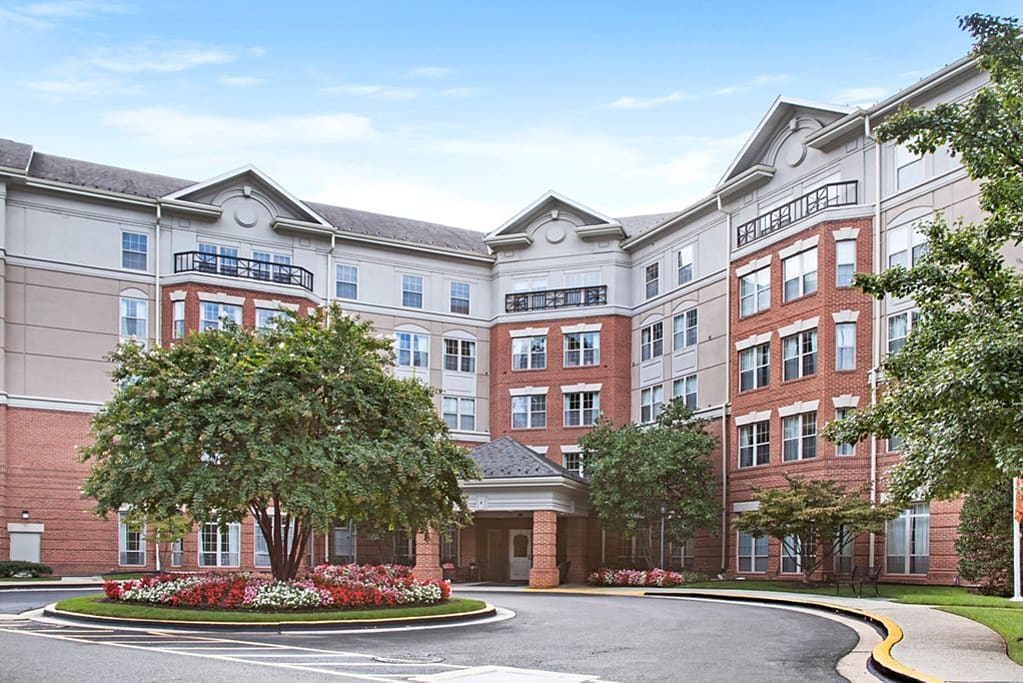
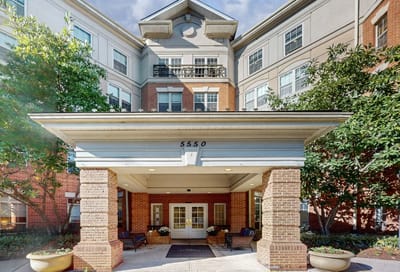
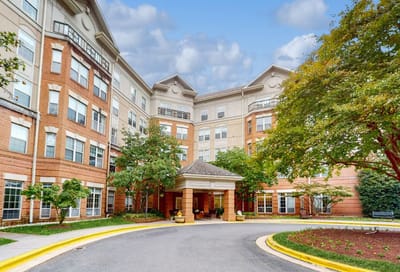
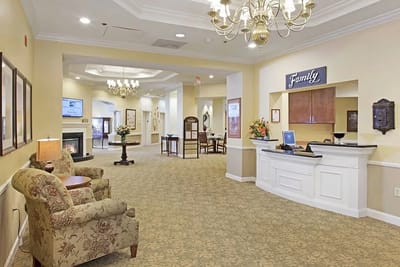
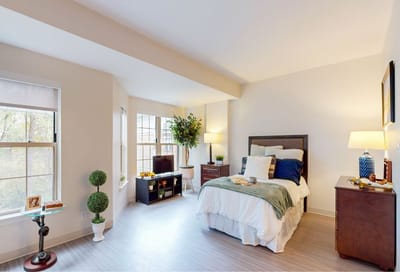
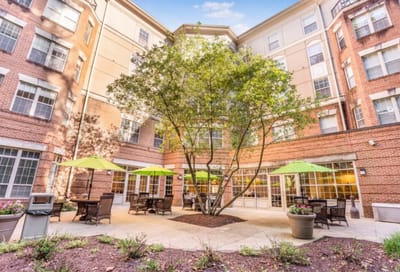
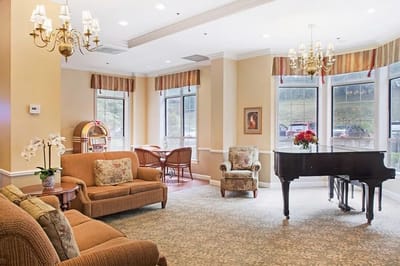
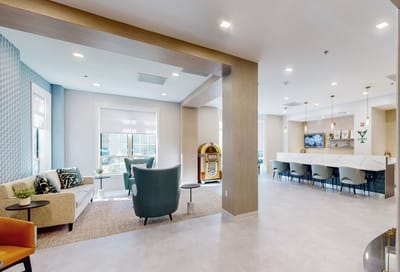
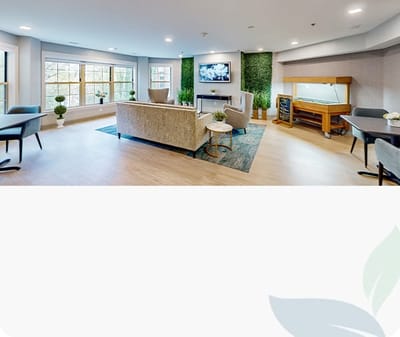
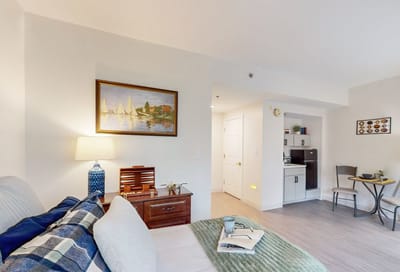
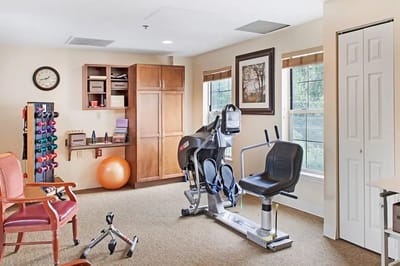
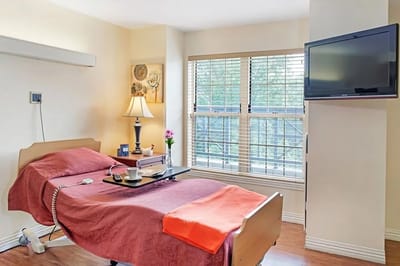
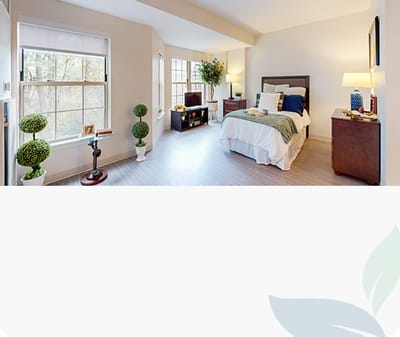
Nestled within the peaceful neighborhood of North Bethesda, Maryland, lies The Terraces at Tuckerman Lane—a home where residents are embraced by a community that radiates unwavering support. The Terraces prides itself on providing exceptional care through a range of specialized programs, including assisted living, memory care, and respite care. Regular visits from experienced physicians further enhance the well-being of residents, guaranteeing top-quality healthcare that is always within reach. Furthermore, specialized support is available for postoperative care, pain management, and other specific needs, ensuring comprehensive care throughout every step of the journey.
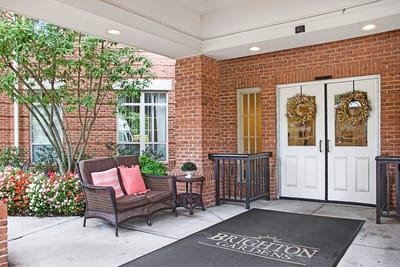
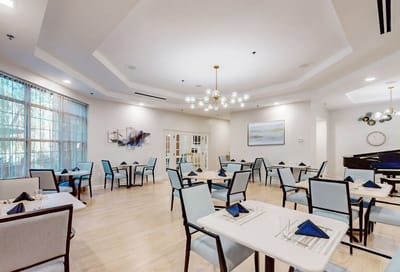
Transparency is a core value at The Terraces at Tuckerman Lane. With their all-inclusive pricing model, residents and their families gain peace of mind through the community’s offerings, eliminating any uncertainties. Culinary experiences here are exceptional, with skilled chefs preparing delectable meals that cater to individual preferences and dietary needs. State-of-the-art technology seamlessly integrates into daily life, offering innovative solutions tailored to the unique requirements of residents. Beyond exceptional care, the community also offers an array of enriching amenities, including a cozy library, a serene chapel, and a well-equipped computer center, fostering personal growth and meaningful relationships.
Offers a balance of services and community atmosphere.
Lower occupancy suggests more openings may be available.
Most residents typically stay for a few weeks or months before returning home or moving on.
76% of new residents, usually for short-term rehab.
22% of new residents, often for short stays.
1% of new residents, often for long-term daily care.
Key information about the people who lead and staff this community.
Resident demographic information for this facility.
In Maryland, the Department of Health, Office of Health Care Quality is the state agency that conducts unannounced inspections and issues reports for all assisted living and nursing facilities.
Maryland average: 5 visits/inspections
Maryland average: 2 inspections
Deficiencies indicate regulatory issues. A higher number implies the facility had several areas requiring improvement.
Maryland average: 53 deficiencies
The most recent inspection on November 5, 2025, identified deficiencies related to inappropriate resident discharges, failure to inform residents about care limitations, and improper use of psychotropic medications. Earlier inspections showed a pattern of issues including incomplete abuse investigations, delayed physician notifications, and multiple resident care and medication management deficiencies. Prior reports also noted problems with care planning, infection control, and quality assurance. Complaint investigations were mostly substantiated, with notable findings about discharge practices and abuse investigation shortcomings. The facility’s inspection history indicates ongoing challenges with resident care communication and medication oversight, with no clear trend of improvement or worsening over time.
Maryland average 3.9
Last Health inspection on Nov 2025
Maryland average 49.9
Maryland average 12.81
Health citations are formal notices following inspections when they fail to comply with safety and care standards.
17 of 23 citations resulted from standard inspections; and 6 of 23 resulted from complaint investigations.
Maryland average: 0.5
Maryland average: 0.6
| Brighton Gardens of Friendship Heights |
AL Assisted Living A licensed, long-term care setting for seniors or individuals with disabilities who need help with daily activities — like bathing, dressing, and medication management — but not 24-hour skilled nursing. Offers housing, meals, and around-the-clock support while aiming to maximize resident independence.
MC Memory Care Secured, specialized care for people living with Alzheimer's or dementia. Staff trained in cognitive impairment, with higher staff-to-resident ratios and an environment designed to reduce confusion and wandering risk. | Chevy Chase (Friendship Boulevard) | 154 | Yes | 86 | - | 29 | - |
20% Male Residents — State Benchmarked 20% of residents are male, compared to the Maryland average of 31%. This facility caters to a majority female resident pool (80% female), consistent with the broader assisted living trend where women significantly outnumber men. |
80% Female Residents — State Benchmarked 80% of residents are female, compared to the Maryland average of 69%. Women comprise the large majority, consistent with national assisted living demographics where women live longer and enter care facilities at higher rates. |
96% White Residents — State Benchmarked 96% of residents are reported as White, compared to the Maryland average of 81%. A higher White share than is typical for assisted living in Maryland in this dataset — compare with peer facilities for local context. |
1% African American Residents — State Benchmarked 1% of residents are reported as African American or Black, compared to the Maryland average of 12%. A lower African American share than is typical in Maryland; local markets still vary widely. |
3% Other Ethnicity Residents — State Benchmarked 3% of residents fall into categories other than White or African American (combined), compared to the Maryland average of 7%. This column aggregates Hispanic, Asian, multiracial, and any other labeled groups that are not classified as White or African American. Reported subgroups in this total: Asian (2%), Hispanic (1%). |
3% Residents Age 65–74 — State Benchmarked 3% of residents are 65–74, compared to the Maryland average of 12%. Fewer younger seniors suggests the resident population skews older, likely requiring higher acuity care and more hands-on support. |
31% Residents Age 75–84 — State Benchmarked 31% of residents are 75–84, compared to the Maryland average of 31%. This is the second most common age bracket in assisted living, representing residents with moderate care needs. |
49% Residents Age 85–94 — State Benchmarked 49% of residents are 85–94, compared to the Maryland average of 44%. A high concentration of very elderly residents signals a higher-acuity facility with experience caring for advanced age-related needs. |
15% Residents Age 95+ — State Benchmarked 15% of residents are 95 or older, compared to the Maryland average of 16%. In line with the statewide profile for the oldest resident bracket. |
| Sunrise of Bethesda |
AL Assisted Living A licensed, long-term care setting for seniors or individuals with disabilities who need help with daily activities — like bathing, dressing, and medication management — but not 24-hour skilled nursing. Offers housing, meals, and around-the-clock support while aiming to maximize resident independence.
MC Memory Care Secured, specialized care for people living with Alzheimer's or dementia. Staff trained in cognitive impairment, with higher staff-to-resident ratios and an environment designed to reduce confusion and wandering risk. | Bethesda (Battery Lane) | 108 | Yes | 90 | - | 8 | - |
29% Male Residents — State Benchmarked 29% of residents are male, compared to the Maryland average of 31%. This facility caters to a majority female resident pool (71% female), consistent with the broader assisted living trend where women significantly outnumber men. |
71% Female Residents — State Benchmarked 71% of residents are female, compared to the Maryland average of 69%. Women comprise the large majority, consistent with national assisted living demographics where women live longer and enter care facilities at higher rates. |
79% White Residents — State Benchmarked 79% of residents are reported as White, compared to the Maryland average of 81%. Close to the average for this category among assisted living facilities in Maryland with reported race/ethnicity data. |
6% African American Residents — State Benchmarked 6% of residents are reported as African American or Black, compared to the Maryland average of 12%. In line with the Maryland average for African American residents among facilities reporting this breakdown. |
15% Other Ethnicity Residents — State Benchmarked 15% of residents fall into categories other than White or African American (combined), compared to the Maryland average of 7%. This column aggregates Hispanic, Asian, multiracial, and any other labeled groups that are not classified as White or African American. Reported subgroups in this total: Other (8%), Asian (4%), Hispanic (2%), Mixed Race (2%). |
6% Residents Age 65–74 — State Benchmarked 6% of residents are 65–74, compared to the Maryland average of 12%. Fewer younger seniors suggests the resident population skews older, likely requiring higher acuity care and more hands-on support. |
40% Residents Age 75–84 — State Benchmarked 40% of residents are 75–84, compared to the Maryland average of 31%. A high concentration in this mid-range bracket, where residents typically need moderate support with daily activities. |
44% Residents Age 85–94 — State Benchmarked 44% of residents are 85–94, compared to the Maryland average of 44%. This is typically the most common age bracket in assisted living — this facility is in line with the statewide norm. |
8% Residents Age 95+ — State Benchmarked 8% of residents are 95 or older, compared to the Maryland average of 16%. Most residents here have not yet reached the oldest-old bracket, suggesting a younger overall community. |
| Sunrise of Silver Spring |
AL Assisted Living A licensed, long-term care setting for seniors or individuals with disabilities who need help with daily activities — like bathing, dressing, and medication management — but not 24-hour skilled nursing. Offers housing, meals, and around-the-clock support while aiming to maximize resident independence.
MC Memory Care Secured, specialized care for people living with Alzheimer's or dementia. Staff trained in cognitive impairment, with higher staff-to-resident ratios and an environment designed to reduce confusion and wandering risk. | Silver Spring (New Hampshire Avenue) | 84 | Yes | 40 | - | 24 | - |
31% Male Residents — State Benchmarked 31% of residents are male, compared to the Maryland average of 31%. This facility caters to a majority female resident pool (69% female), consistent with the broader assisted living trend where women significantly outnumber men. |
69% Female Residents — State Benchmarked 69% of residents are female, compared to the Maryland average of 69%. Women comprise the large majority, consistent with national assisted living demographics where women live longer and enter care facilities at higher rates. |
53% White Residents — State Benchmarked 53% of residents are reported as White, compared to the Maryland average of 81%. A lower White share than the Maryland average — the community may draw a more diverse resident mix relative to other facilities in Maryland. |
39% African American Residents — State Benchmarked 39% of residents are reported as African American or Black, compared to the Maryland average of 12%. A higher African American share than the typical Maryland average — useful context when comparing cultural fit and community composition. |
9% Other Ethnicity Residents — State Benchmarked 9% of residents fall into categories other than White or African American (combined), compared to the Maryland average of 7%. This column aggregates Hispanic, Asian, multiracial, and any other labeled groups that are not classified as White or African American. Reported subgroups in this total: Asian (4%), Hawaiian/Pacific Islander (3%), Hispanic (1%). |
4% Residents Age 65–74 — State Benchmarked 4% of residents are 65–74, compared to the Maryland average of 12%. Fewer younger seniors suggests the resident population skews older, likely requiring higher acuity care and more hands-on support. |
43% Residents Age 75–84 — State Benchmarked 43% of residents are 75–84, compared to the Maryland average of 31%. A high concentration in this mid-range bracket, where residents typically need moderate support with daily activities. |
37% Residents Age 85–94 — State Benchmarked 37% of residents are 85–94, compared to the Maryland average of 44%. The population here skews younger than the statewide norm, which may indicate a more active, lower-acuity community. |
14% Residents Age 95+ — State Benchmarked 14% of residents are 95 or older, compared to the Maryland average of 16%. In line with the statewide profile for the oldest resident bracket. |
| The Terraces at Tuckerman Lane |
NH Nursing Home Licensed facility providing 24/7 skilled nursing care for residents with complex, ongoing medical needs. Staffed by RNs, LPNs, and CNAs. Inspected and star-rated annually by CMS. Accepts Medicare (short-term rehab) and Medicaid (long-term care).
AL Assisted Living A licensed, long-term care setting for seniors or individuals with disabilities who need help with daily activities — like bathing, dressing, and medication management — but not 24-hour skilled nursing. Offers housing, meals, and around-the-clock support while aiming to maximize resident independence.
MC Memory Care Secured, specialized care for people living with Alzheimer's or dementia. Staff trained in cognitive impairment, with higher staff-to-resident ratios and an environment designed to reduce confusion and wandering risk.
RC Respite Care Short-term temporary care — days to weeks — to give family caregivers a break. Full care provided during the stay. Often used after hospitalization or to trial a facility before a permanent placement decision. | North Bethesda (North Bethesda) | 39 | No | 39 | studio / suite / 1 bed | 28 | - |
45% Male Residents — State Benchmarked 45% of residents are male, compared to the Maryland average of 31%. A relatively balanced gender mix for assisted living, where facilities typically skew heavily female. |
55% Female Residents — State Benchmarked 55% of residents are female, compared to the Maryland average of 69%. Closer to an even gender split than most assisted living facilities, which typically have 65–75% female residents. |
75% White Residents — State Benchmarked 75% of residents are reported as White, compared to the Maryland average of 81%. Close to the average for this category among assisted living facilities in Maryland with reported race/ethnicity data. |
15% African American Residents — State Benchmarked 15% of residents are reported as African American or Black, compared to the Maryland average of 12%. In line with the Maryland average for African American residents among facilities reporting this breakdown. |
9% Other Ethnicity Residents — State Benchmarked 9% of residents fall into categories other than White or African American (combined), compared to the Maryland average of 7%. This column aggregates Hispanic, Asian, multiracial, and any other labeled groups that are not classified as White or African American. Reported subgroups in this total: Asian (5%), Hispanic (3%), American Indian (2%). |
11% Residents Age 65–74 — State Benchmarked 11% of residents are 65–74, compared to the Maryland average of 12%. In line with the statewide profile for this youngest senior bracket in assisted living. |
26% Residents Age 75–84 — State Benchmarked 26% of residents are 75–84, compared to the Maryland average of 31%. Below the state norm — the resident mix may skew either younger or older than this typical middle bracket. |
48% Residents Age 85–94 — State Benchmarked 48% of residents are 85–94, compared to the Maryland average of 44%. This is typically the most common age bracket in assisted living — this facility is in line with the statewide norm. |
14% Residents Age 95+ — State Benchmarked 14% of residents are 95 or older, compared to the Maryland average of 16%. In line with the statewide profile for the oldest resident bracket. |
| The Reserve at Strathmore Square |
AL Assisted Living A licensed, long-term care setting for seniors or individuals with disabilities who need help with daily activities — like bathing, dressing, and medication management — but not 24-hour skilled nursing. Offers housing, meals, and around-the-clock support while aiming to maximize resident independence. | North Bethesda (Pooks Hill) | - | No | 38 | - | - | - | - | - | - | - | - | - | - | - | - |
14.4 miles from city center
Estimated distance in miles from North Bethesda's city center to The Terraces at Tuckerman Lane's address, calculated via Google Maps.
— 2.16 miles to nearest hospital (Suburban Hospital)
Add your location
This data corresponds to Q2 2025 and is based on CMS Payroll-Based Journal.
Manages medical care and health needs.
This role is partially covered by contractors.
Assists with medical care and medications.
No contractors work on this role.
Helps with daily care and mobility.
No contractors work on this role.
Total hours from contractors
3,186 contractor hours this quarter
| Certified Nursing Assistant | 21 | 0 | 21 | 5,803 | 91 | 100% | 7.5 |
| Licensed Practical Nurse | 14 | 0 | 14 | 3,279 | 91 | 100% | 8.1 |
| Registered Nurse | 6 | 6 | 12 | 1,411 | 88 | 97% | 8 |
| Physical Therapy Assistant | 0 | 9 | 9 | 1,058 | 80 | 88% | 6.9 |
| Clinical Nurse Specialist | 2 | 0 | 2 | 966 | 65 | 71% | 8 |
| Respiratory Therapy Technician | 0 | 5 | 5 | 668 | 75 | 82% | 6.4 |
| Mental Health Service Worker | 1 | 0 | 1 | 496 | 62 | 68% | 8 |
| Physical Therapy Aide | 0 | 1 | 1 | 486 | 65 | 71% | 7.5 |
| Speech Language Pathologist | 0 | 2 | 2 | 485 | 62 | 68% | 7.4 |
| Dietitian | 1 | 0 | 1 | 472 | 59 | 65% | 8 |
| Nurse Practitioner | 1 | 0 | 1 | 448 | 56 | 62% | 8 |
| Administrator | 1 | 0 | 1 | 424 | 53 | 58% | 8 |
| Other Dietary Services Staff | 1 | 0 | 1 | 409 | 57 | 63% | 7.2 |
| Qualified Social Worker | 0 | 3 | 3 | 234 | 52 | 57% | 3.5 |
Source: CMS Long-Term Care Facility Characteristics (Data as of Jan 2026)
Residents meet regularly to discuss policies, care quality, and activities
Family members meet regularly to discuss policies, care quality, and activities
State-approved Nurse Aide Training and Competency Evaluation Program on-site
Part of a Continuing Care Retirement Community offering multiple care levels
Organized group of family members that meets regularly to discuss facility policies, resident care, and activities.
Organized group of residents that meets regularly to discuss facility policies, quality of life, and activities.
These measures show how residents usually do over time at this home, based on health outcomes and preventive care.
Historical financial and operational data for The Terraces at Tuckerman Lane based on CMS SNF Cost Reports.
Loading trend charts...
Care Cost Calculator: See Prices in Your Area
Nursing Home Data Explorer
Don’t Wait Too Long: 7 Red Flag Signs Your Parent Needs Assisted Living Now
The True Cost of Assisted Living in 2025 – And How Families Are Paying For It
Understanding Senior Living Costs: Pricing Models, Discounts & Financial Assistance
Touring a community? Use this expert-backed checklist to stay organized, ask the right questions, and find the perfect fit.
We'll send you a PDF version of the touring checklist.
