Hewitt Health & Rehabilitation Center
Nursing Home & Memory Care · Shelton, CT
CMS overall rating Info CMS (the Centers for Medicare & Medicaid Services) is the federal agency that rates nursing home quality. Its Overall Rating runs from 1 to 5 stars, combining health inspections, staffing, and quality measures, with inspections weighted most heavily.

Hewitt Health & Rehabilitation Center

Nursing Home & Memory Care · Shelton, CT
CMS overall rating Info CMS (the Centers for Medicare & Medicaid Services) is the federal agency that rates nursing home quality. Its Overall Rating runs from 1 to 5 stars, combining health inspections, staffing, and quality measures, with inspections weighted most heavily.
Calculator: See prices in your area
Hewitt Health & Rehabilitation Center accepts Medicare, Medicaid, and private pay.

Overview of Hewitt Health & Rehabilitation Center

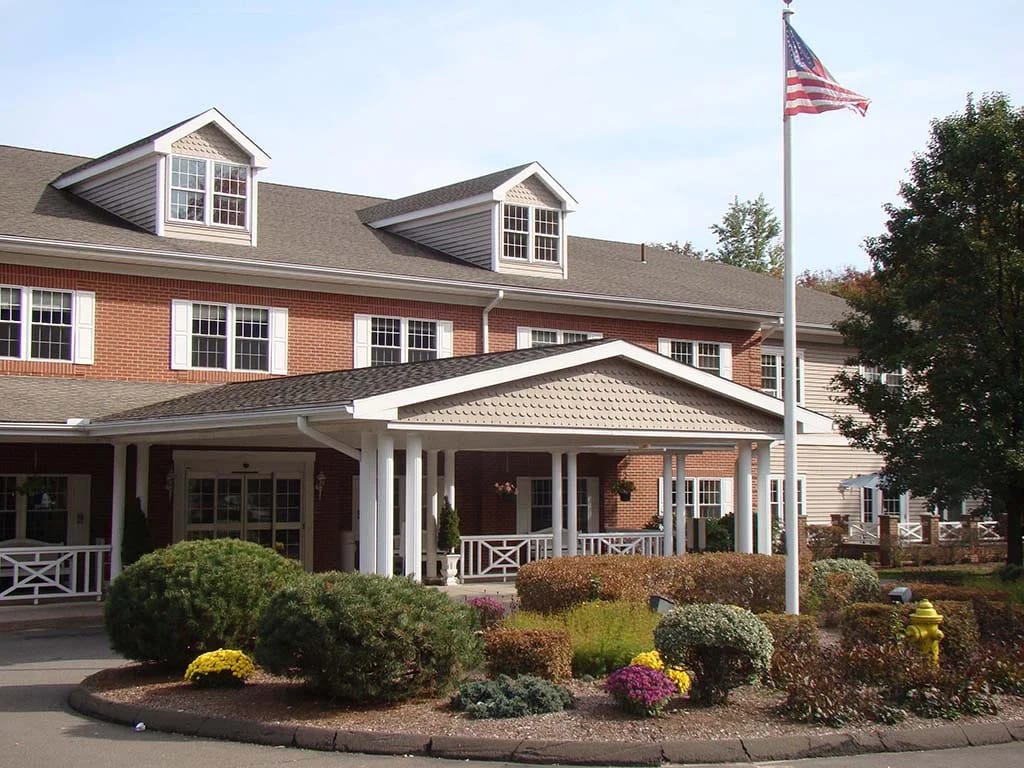
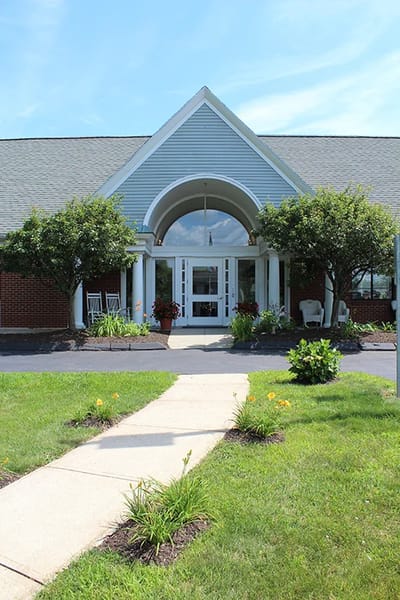
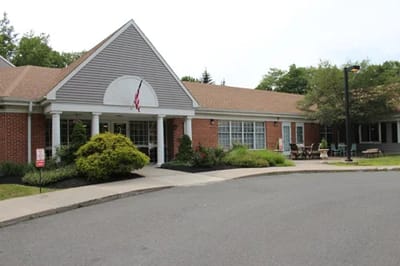
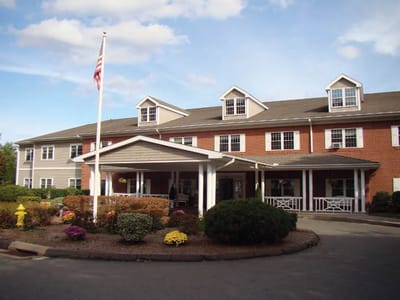
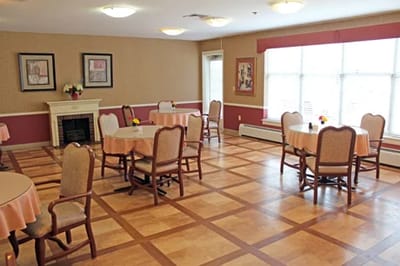
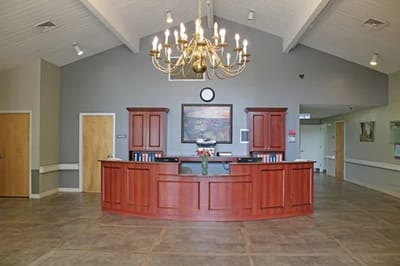
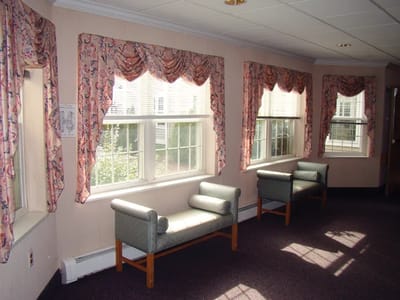
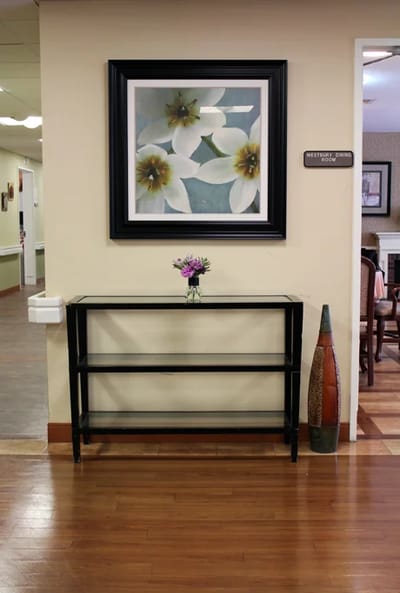
Located at 45 Maltby Street in Shelton, Connecticut’s Maltby Street neighborhood, Hewitt Health & Rehabilitation Center operates as a 120-bed nursing home and memory care facility. The privately owned community accepts Medicare, Medicaid, and private-pay residents. Walk score of 74 positions the facility in a very walkable area where most errands are accessible on foot.

Current occupancy stands at 78.8% with an average resident stay of 73 days, supporting both short-term rehabilitation and longer-term admissions. The current census is 114 residents.

The facility holds a 2-star overall CMS rating, notably below Connecticut’s state average. Health inspection performance rates 2 stars, 28.5% below state benchmark. Staffing carries a 1-star rating, 38.4% below the Connecticut standard.

The most significant staffing constraint is registered nurse availability at only 17 minutes per resident daily, a dramatic 60% shortfall compared to the state average of 42 minutes. This gap in RN coverage directly impacts clinical assessment and response capacity. The facility’s overall staff-to-resident ratio of 1.21:1 underperforms the state average of 1.86:1 by 35%.

Residents experience elevated clinical event rates, particularly pressure ulcer development at 6.9% (51% worse than peers) and unintended weight loss affecting 10.4% of residents (66% above state rates). A prominent gap exists in preventive care: pneumococcal vaccination coverage reaches only 48.5%; substantially below the Connecticut average of 87.5%, and seasonal influenza vaccination only 68.5% compared to a state norm of 93.5%.

For short-stay rehabilitation residents, re-hospitalization rates hit 30.1%, 20% above the state average. Residents’ ability to move independently worsens in over one-fifth of long-stay cases.

Federal penalties have been minimal: cumulative fines of $18,000 trail the state average by 59%, with no payment denials.

Hewitt serves mixed-stay residents, supported by staffing levels substantially below state norms with particular gaps in nursing oversight and documented vaccine coverage deficiencies across the population.

Quality ratings

Measured by Centers for Medicare & Medicaid Services (CMS)

Overall rating Info The Overall CMS Rating combines results from health inspections, staffing levels and quality measures. Health inspections carry the most weight. Staffing and quality scores can increase or decrease the final rating based on performance compared to state and national standards.
▼ 34.2% Below CT avg. ▼ 34.2% Below CT avg.Click the badge to see the full State ranking.Click here to see the full State ranking.
Health Inspection Info Based on the results of the facility's three most recent standard inspections and any complaint investigations. CMS reviews the number, scope, and severity of deficiencies, with more recent findings weighted more heavily.
▼ 28.5% Below CT avg. ▼ 28.5% Below CT avg.Click the badge to see the full State ranking.Click here to see the full State ranking.
Staffing Info Measures average nursing staff hours per resident per day, including Registered Nurses (RNs) and total nursing staff. Ratings are adjusted based on the level of care residents require and are compared to state and national benchmarks.
▼ 38.4% Below CT avg. ▼ 38.4% Below CT avg.Click the badge to see the full State ranking.Click here to see the full State ranking.
Quality Measures Info Based on clinical and physical health indicators reported to CMS, such as hospital readmissions, falls, pressure ulcers, and improvements in mobility. These measures reflect how well residents' health needs are being managed.
▼ 14.7% Below CT avg. ▼ 14.7% Below CT avg.Click the badge to see the full State ranking.Click here to see the full State ranking.

Staffing hours breakdown

Info Daily nursing hours per resident by staff type, reported to CMS. Higher is generally better — compare this facility to state and national averages to see where staffing stands.

Hours per resident per day — compared to Connecticut state averages

Total nursing care / resident Info This home is ranked 35th out of 66 homes in Connecticut for nurse hours. Total adjusted nursing hours per resident per day, combining RN, LPN, and aide time. CMS adjusts this for case-mix so facilities can be fairly compared.
3h 41m per day
Rank #35 / 66Nurse hours — State benchmarkedThis home is ranked 35th out of 66 homes in Connecticut. Shows adjusted nurse hours per resident per day benchmarked to the Connecticut average, with a ranking across 66 Connecticut facilities. More hours mean more direct care. The national average is about 3.5 hrs; below 3.0 is a red flag.Click the rank badge to see the full State ranking.Click here to see the full State ranking.
This facility Connecticut avg (3h 58m per day)
vs Connecticut avg
-7%

5 of 6 metrics below state avg

Staff typeHours / Day / Residentvs state avg
Registered Nurse (RN) Info RNs hold the highest nursing license and can assess residents, interpret test results, and direct care plans. More RN hours per day often signals stronger clinical oversight and faster response to health changes. 18m per day ▼ 56% State avg: 42m per day · National avg: 41m per day
LPN / LVN Info Licensed Practical Nurses (LPNs) or Licensed Vocational Nurses (LVNs) deliver routine hands-on care — medication administration, wound dressing, and monitoring vital signs. They work under RN supervision and make up a large share of daily bedside care. 50m per day ■ Avg State avg: 50m per day · National avg: 52m per day
Nurse Aide Info Certified Nurse Aides (CNAs) provide the most direct day-to-day assistance: bathing, dressing, feeding, and mobility. Nurse aide hours are typically the largest staffing category and directly affect residents' quality of life. 2h 5m per day ▼ 9% State avg: 2h 17m per day · National avg: 2h 21m per day
Weekend Total Nursing Info Combined nursing hours (RN + LPN + Nurse Aide) per resident per day on weekends. Staffing often drops on weekends — this figure reveals whether the facility maintains adequate coverage outside of weekday hours. 3h 4m per day ▼ 10% State avg: 3h 25m per day · National avg: 3h 26m per day
Physical Therapist Info Hours per resident per day provided by licensed Physical Therapists (PTs) or PT Assistants. PT services help residents recover mobility after injury or illness and are especially important for post-acute (short-stay) rehabilitation. 4m per day ▼ 21% State avg: 5m per day · National avg: 4m per day
Weekend RN Info Registered nurse hours specifically on weekends. Facilities sometimes reduce RN presence on Saturdays and Sundays — a low weekend RN figure compared to weekday hours can indicate reduced clinical oversight when most administrative staff are absent. 14m per day ▼ 51% State avg: 28m per day · National avg: 29m per day

Capacity and availability

This home usually has availability

Lower occupancy than the Connecticut average: 84%
Occupancy rate
78.8% Rank #55 / 71Occupancy rate — State benchmarkedThis home is ranked 55th out of 71 homes in Connecticut. Shows this facility's occupancy rate versus the Connecticut average, with its Statewide rank out of 71. Higher occupancy signals strong local demand and financial stability.Click the rank badge to see the full State ranking.Click here to see the full State ranking.
Avg. Length of Stay
73 days
Walk Score
Walk Score: 74 / 100 Rank #50 / 264Walk Score — State benchmarkedThis home is ranked 50th out of 264 homes in Connecticut. Shows how walkable this facility's neighborhood is compared to the average Walk Score across Connecticut facilities. Higher scores benefit residents, families, and staff.Click the rank badge to see the full State ranking.Click here to see the full State ranking.
Very walkable. Most errands can be accomplished on foot, and many essentials are within a short walk.

About this community

Awards

Awards2019 AHCA Bronze Award

License Details

AccreditationsAHCA

Therapy & Rehabilitation

3 services
Rehabilitation Services
Respite Care
Short-Term Rehab

Staffing & Medical

1 service
24-Hour Staffing

Additional Policies & Features

Visitor PolicyNo visitors allowed due to public health guidance.

Amenities & Lifestyle

Gym
Branded ProgramsSafe Harbor Neighborhood
Wellness ProgramApple Rehab offers specialized care for patients recovering from a multitude of illnesses and diagnoses, ensuring maximum recovery potential.
Specific ProgramsDedicated Short Term Rehabilitation Unit, Sub acute Care, Pulmonary Care, I.V. therapy, outpatient therapy, cognitive & memory retention programs, speech language pathology
Religious ServicesYes

Contact Hewitt Health & Rehabilitation Center

Staffing Data

Reporting period: October 1 – December 31, 2025 (Q4 2025). Source: CMS Payroll-Based Journal report.

Total staff 143
Employees 140
Contractors 3
Staff to resident ratio 1.21 : 1
35% fewer staff per resident than Connecticut average
Connecticut average ratio: 1.86 : 1 Connecticut average ratio: 1.86 : 1See full Connecticut ranking
Avg staff/day 59
Average shift 7.2 hours
0% compared with Connecticut average
Connecticut average: 7.5 hours Connecticut average shift: 7.5 hoursSee full Connecticut ranking
Total staff hours (quarter) 39,136

Nursing staff breakdown

Q4 2025 · Oct 1 – Dec 31 More info This data comes from the CMS Payroll-Based Journal report covering October 1 – December 31, 2025.
Registered Nurse

Manages medical care and health needs.

RN Staff Info All 9 RN Staff are full-time employees. No contractors work on this role. 9
Average shift length Info Average shift length. Calculated as total hours divided by days worked and average staff per day. 8.1 hours
Licensed Practical Nurse

Assists with medical care and medications.

LPN Staff Info All 26 LPN Staff are full-time employees. No contractors work on this role. 26
Average shift length Info Average shift length. Calculated as total hours divided by days worked and average staff per day. 7.1 hours
Certified Nursing Assistant

Helps with daily care and mobility.

CNA Staff Info All 75 CNA Staff are full-time employees. No contractors work on this role. 75
Average shift length Info Average shift length. Calculated as total hours divided by days worked and average staff per day. 7.3 hours

Contractor staffing

Q4 2025 · Oct 1 – Dec 31 More info This data comes from the CMS Payroll-Based Journal report covering October 1 – December 31, 2025.

Total hours from contractors

1.3%

495 contractor hours this quarter

Medical Director: 1 Administrator: 1 Occupational Therapy Assistant: 1

Staff by category

Q4 2025 · Oct 1 – Dec 31 More info This data comes from the CMS Payroll-Based Journal report covering October 1 – December 31, 2025.
Certified Nursing Assistant7507521,95092100%7.3
Licensed Practical Nurse260268,22892100%7.1
Registered Nurse9092,45392100%8.1
Other Dietary Services Staff5051,0398289%7.4
Physical Therapy Aide2027927784%6.6
Respiratory Therapy Technician5056907885%5.6
RN Director of Nursing3034764953%7.2
Administrator0114506065%7.5
Other Social Services Staff1014426065%7.4
Nurse Practitioner1014365863%7.5
Qualified Social Worker3034166470%6.5
Speech Language Pathologist1014136368%6.6
Mental Health Service Worker2024095661%7.3
Physical Therapy Assistant3033866368%6.1
Clinical Nurse Specialist3033293942%6.6
Occupational Therapy Aide1011842527%7.4
Medical Director011342022%1.7
Occupational Therapy Assistant0111133%3.7
75 Certified Nursing Assistant
% of Days 100%
26 Licensed Practical Nurse
% of Days 100%
9 Registered Nurse
% of Days 100%
5 Other Dietary Services Staff
% of Days 89%
2 Physical Therapy Aide
% of Days 84%
5 Respiratory Therapy Technician
% of Days 85%
3 RN Director of Nursing
% of Days 53%
1 Administrator
% of Days 65%
1 Other Social Services Staff
% of Days 65%
1 Nurse Practitioner
% of Days 63%
3 Qualified Social Worker
% of Days 70%
1 Speech Language Pathologist
% of Days 68%
2 Mental Health Service Worker
% of Days 61%
3 Physical Therapy Assistant
% of Days 68%
3 Clinical Nurse Specialist
% of Days 42%
1 Occupational Therapy Aide
% of Days 27%
1 Medical Director
% of Days 22%
1 Occupational Therapy Assistant
% of Days 3%

Penalties and fines

Includes penalties issued in 2024

Federal penalties imposed by CMS for regulatory violations, including civil money penalties (fines) and denials of payment for new Medicare/Medicaid admissions.

Source: CMS Penalties Database (Data as of Jan 2026)

Total fines amount $18K Rank #52 / 68Federal fines — State benchmarkedThis home is ranked 52nd out of 68 homes in Connecticut. Shows this facility's cumulative CMS federal fine dollars versus the Connecticut average among facilities with fines, and where it ranks among 68 facilities in the pool. Lower total dollars mean a better rank.Click the rank badge to see the full State ranking.Click here to see the full State ranking.
59% lower than Connecticut average

Connecticut average: $44K

Number of fines 2
15% more fines than Connecticut average

Connecticut average: 1.7

Payment Denials Info Serious action where Medicare and/or Medicaid temporarily stops payments for new residents until issues are fixed. 0
100% fewer payment denials than Connecticut average

Connecticut average: 0.1

Fines amount comparison
This facility $18K
Connecticut average $44K
Penalty History

Penalties are imposed by CMS for violations of federal nursing home regulations.

1 penalty in the past 3 years

Jul 1, 2024 · $8K

Civil Money Penalty Info Fines imposed for noncompliance, which can be assessed per day or per instance of violation. Jul 1, 2024
$8K

Last updated: Jan 2026

Quality of care over time

These measures show how residents usually do over time at this home, based on health outcomes and preventive care.

High-risk clinical events score Info A composite score based on pressure ulcers, falls with injury, weight loss, walking ability decline, and activities of daily living decline. 12.7
22% worse than Connecticut average

Connecticut average: 10.4

Functional decline score Info A composite score based on activities of daily living decline, walking ability decline, and incontinence. 22.8
8% worse than Connecticut average

Connecticut average: 21.1

Long-stay resident measures
Below average Connecticut avg: 3.4 Info CMS star rating based on long-stay quality measure performance. 5 stars = significantly above average, 1 star = significantly below average.
Need for Help with Daily Activities Increased Info Percent of long-stay residents whose need for help with daily activities has increased 24.1%
28% worse than Connecticut average

Connecticut average: 18.9%

Walking Ability Worsened Info Percent of long-stay residents whose ability to move independently worsened 20.5%
7% worse than Connecticut average

Connecticut average: 19.2%

Low Risk Residents with Bowel/Bladder Incontinence Info Percent of low risk long-stay residents who lose control of their bowels or bladder 23.8%
5% better than Connecticut average

Connecticut average: 24.9%

Falls with Major Injury Info Percent of long-stay residents experiencing one or more falls with major injury 1.5%
56% better than Connecticut average

Connecticut average: 3.5%

High Risk Residents with Pressure Ulcers Info Percent of long-stay high risk residents with pressure ulcers 6.9%
51% worse than Connecticut average

Connecticut average: 4.6%

Urinary Tract Infection Info Percent of long-stay residents with a urinary tract infection 2.3%
38% worse than Connecticut average

Connecticut average: 1.7%

Lost Too Much Weight Info Percent of long-stay residents who lose too much weight 10.4%
66% worse than Connecticut average

Connecticut average: 6.3%

Depressive Symptoms Info Percent of long-stay residents who have depressive symptoms 7.6%
50% better than Connecticut average

Connecticut average: 15.2%

Antipsychotic Use Info Percent of long-stay residents who received an antipsychotic medication 20.2%
18% worse than Connecticut average

Connecticut average: 17.2%

Pneumococcal Vaccine Info Percent of long-stay residents assessed and appropriately given the pneumococcal vaccine 48.5%
45% worse than Connecticut average

Connecticut average: 87.5%

Influenza Vaccine Info Percent of long-stay residents assessed and appropriately given the seasonal influenza vaccine 68.5%
27% worse than Connecticut average

Connecticut average: 93.5%

Short-stay resident measures
Above average Connecticut avg: 3.4 Info CMS star rating based on short-stay quality measure performance. 5 stars = much above average, 1 star = much below average.
Pneumococcal Vaccine Info Percent of short-stay residents assessed and appropriately given the pneumococcal vaccine 11.2%
84% worse than Connecticut average

Connecticut average: 70.1%

Antipsychotic medication increase Info Percent of short-stay residents who newly received an antipsychotic medication 0.0%
100% better than Connecticut average

Connecticut average: 1.5%

Influenza Vaccine Info Percent of short-stay residents assessed and appropriately given the seasonal influenza vaccine 25.0%
64% worse than Connecticut average

Connecticut average: 69.8%

Re-hospitalized after SNF stay Info Percentage of short-stay residents who were re-hospitalized after their nursing home admission. 30.1%
20% worse than Connecticut average

Connecticut average: 25.0%

Emergency department visits Info Percentage of short-stay residents who had an outpatient emergency department visit. 2.7%
76% better than Connecticut average

Connecticut average: 11.1%

Falls with major injury Info Percentage of SNF residents who experience falls with major injury during their stay. 0.0%
100% better than Connecticut average

Connecticut average: 0.8%

Ability to care for self at discharge Info Percentage of residents at or above expected ability to care for themselves at discharge. 53.6%
In line with Connecticut average

Connecticut average: 53.7%

Successful return to home or community Info Rate of successful return to home or community from a skilled nursing facility. 57.7%
14% better than Connecticut average

Connecticut average: 50.6%

Breakdown by payment type

Medicare

21% of new residents, usually for short-term rehab.

Typical stay 18 days

Private pay

41% of new residents, often for short stays.

Typical stay 1 - 2 months

Medicaid

38% of new residents, often for long-term daily care.

Typical stay 4 - 5 months

Facility Characteristics

Source: CMS Long-Term Care Facility Characteristics (Data as of Jan 2026)

Total residents 118
Medicare
12
10.2% of residents
Medicaid
83
70.3% of residents
Private pay or other
23
19.5% of residents
Programs & Services
Residents Group

Residents meet regularly to discuss policies, care quality, and activities

Active Resident Council

Organized group of residents that meets regularly to discuss facility policies, quality of life, and activities.

Finances and operations

Voluntary non-profit community
Home revenue
$13.2M
Surplus of revenue
$358.1K
Voluntary non-profit community
Home revenue
$13.2M Rank #63 / 72Revenue — State benchmarkedThis home is ranked 63rd out of 72 homes in Connecticut. Shows this facility's annual revenue compared to the Connecticut average. Higher revenue generally means more resources for staffing and capital — read alongside Payroll %.Click the rank badge to see the full State ranking.Click here to see the full State ranking.
Surplus of revenue
$358.1K
Payroll costs Info The portion of the home's budget spent on staff, including nurses, caregivers, and other employees who support care and operations. Rank #64 / 72Payroll — State benchmarkedThis home is ranked 64th out of 72 homes in Connecticut. Shows total annual staff payroll benchmarked to the Connecticut average. Higher payroll investment relative to peers often signals better staffing and less reliance on cheaper contract labor.Click the rank badge to see the full State ranking.Click here to see the full State ranking.
$6.7M
50.9% of revenue Rank #25 / 72Payroll % — State benchmarkedThis home is ranked 25th out of 72 homes in Connecticut. Shows payroll as a percentage of revenue versus the Connecticut average. Well-run Connecticut facilities typically land around 51–66% — the top third Statewide. Below 25% may signal understaffing or heavy agency use — read with Staffing ratings.Click the rank badge to see the full State ranking.Click here to see the full State ranking.
Other operating costs Info All remaining costs needed to run the home, such as food, utilities, building maintenance, supplies and administrative expenses.
$6.1M
Total costs $12.8M

Who this home usually serves

TYPE OF STAY

Mix of rehab and long-term care

This home supports both short-term rehab and long-term care, with residents staying for a wide range of durations.

Places of interest near Hewitt Health & Rehabilitation Center

Address 12.0 miles from city center Info Estimated distance in miles from Shelton's city center to Hewitt Health & Rehabilitation Center's address, calculated via Google Maps. — 1.5 miles to nearest hospital (Comprehensive Wound Healing Center)

Calculate Travel Distance to Hewitt Health & Rehabilitation Center

Add your location

Address

Financial Assistance for
Nursing Home in Connecticut

Hewitt Health & Rehabilitation Center is located in Shelton, Connecticut.
Here are the financial assistance programs available to residents in Connecticut.

Get Financial aid guidance

Connecticut Home Care Program for Elders

CHCPE

Age 65+
General Connecticut resident, at risk of nursing home placement.
Income Limits State-funded: ~$1,600/month; Medicaid: ~$2,829/month 300% FBR
Asset Limits $1,600 (state), $2,000 (Medicaid, individual).
CT

Two tiers (state and Medicaid); waitlists possible.

Benefits
In-home care (4-6 hours/day) Adult day care (~$70/day) Meals Respite (up to 14 days/year)

Statewide Respite Care Program

CT Respite Care

Age
General Caregiver of senior with dementia, Connecticut resident.
Income Limits ~$2,500/month individual, varies
Asset Limits $40,000 individual
CT

Limited to dementia caregivers; capped funding.

Benefits
In-home respite (up to 30 days/year) Adult day care (~$70/day)

Congregate Housing Services Program (CHSP)

Connecticut Congregate Housing Services Program

Age 62+
General Connecticut resident, frail but not needing 24/7 care, resides in CHSP-eligible housing.
Income Limits (2025) ~$41,000/year individual, adjusted annually
Asset Limits Not specified; focus is income-based.
CT

Limited to 14 state-subsidized sites; participants pay 10% of service costs.

Benefits
Personal care (3-5 hours/day) Meals ($5-$7/meal) Housekeeping Transportation (~5 trips/month)

Medicare Savings Program (MSP)

Connecticut Medicare Savings Program

Age 65+ or disabled
General Connecticut resident, enrolled in Medicare Part A/B.
Income Limits (2025) ~$2,510/month (individual, QMB); ~$3,380/month (SLMB); ~$3,598/month (ALMB)—adjusted annually.
Asset Limits None since 2023 policy change.
CT

Three tiers (Qualified Medicare Beneficiary, Specified Low-Income, Additional Low-Income); no asset test.

Benefits
Covers Medicare Part B premiums ($174.70/month) Deductibles ($240/year) Copays (~20% of services)

Compare Nursing Home around Bridgeport

The information below is reported by the Connecticut Department of Public Health, Facility Licensing and Investigations Section.

5 facilities compared · CMS & CT Dept. of Health data

3030 Park by Senior Living Hospitality
NH

Nursing Home Licensed facility providing 24/7 skilled nursing care for residents with complex, ongoing medical needs. Staffed by RNs, LPNs, and CNAs. Inspected and star-rated annually by CMS. Accepts Medicare (short-term rehab) and Medicaid (long-term care).

AL

Assisted Living A licensed, long-term care setting for seniors or individuals with disabilities who need help with daily activities — like bathing, dressing, and medication management — but not 24-hour skilled nursing. Offers housing, meals, and around-the-clock support while aiming to maximize resident independence.

IL

Independent Living Lifestyle-focused communities for older adults offering dining, activities, and transportation with minimal personal care. Best for active, independent seniors who want community without medical support.

MC

Memory Care Secured, specialized care for people living with Alzheimer's or dementia. Staff trained in cognitive impairment, with higher staff-to-resident ratios and an environment designed to reduce confusion and wandering risk.

Bridgeport (Brooklawn/St. Vincent)
23
Facility 23
CT AVG 111
Rank #117 / 123
--
5.50
Facility 5.50
CT AVG 3.97
Rank #7 / 66
+39%+38%
$8.0k
Facility $8.0k
CT AVG $43.8k
Rank #39 / 68
15
Facility 15
CT AVG 32.0
Rank #10 / 68
5.0
Facility 5.0
CT AVG 5.8
Rank #29 / 68
120
45
Facility 45
CT AVG 47
Rank #143 / 264
Ct Watermark Operator LLC
$22.9M
Facility $22.9M
CT AVG $19.0M
Rank #39 / 72
$10.1M
Facility $10.1M
CT AVG $7.2M
Rank #43 / 72
43.9%
Facility 43.9%
CT AVG 42.4%
Rank #45 / 72
75440
Pomperaug Woods
NH

Nursing Home Licensed facility providing 24/7 skilled nursing care for residents with complex, ongoing medical needs. Staffed by RNs, LPNs, and CNAs. Inspected and star-rated annually by CMS. Accepts Medicare (short-term rehab) and Medicaid (long-term care).

AL

Assisted Living A licensed, long-term care setting for seniors or individuals with disabilities who need help with daily activities — like bathing, dressing, and medication management — but not 24-hour skilled nursing. Offers housing, meals, and around-the-clock support while aiming to maximize resident independence.

HC

Home Care Professional care delivered in the person's own home — from companionship and errands to skilled nursing and therapy. Allows seniors to age in place. Medicare covers skilled home health when medically necessary.

IL

Independent Living Lifestyle-focused communities for older adults offering dining, activities, and transportation with minimal personal care. Best for active, independent seniors who want community without medical support.

MC

Memory Care Secured, specialized care for people living with Alzheimer's or dementia. Staff trained in cognitive impairment, with higher staff-to-resident ratios and an environment designed to reduce confusion and wandering risk.

RC

Respite Care Short-term temporary care — days to weeks — to give family caregivers a break. Full care provided during the stay. Often used after hospitalization or to trial a facility before a permanent placement decision.

Southbury (Southbury Historic District No. 1)
37
Facility 37
CT AVG 111
Rank #108 / 123
81.1%
Facility 81.1%
CT AVG 84%
Rank #52 / 71
-3%
5.75
Facility 5.75
CT AVG 3.97
Rank #2 / 66
+26%+45%
$20.9k
Facility $20.9k
CT AVG $43.8k
Rank #54 / 68
14
Facility 14
CT AVG 32.0
Rank #8 / 68
7.0
Facility 7.0
CT AVG 5.8
Rank #54 / 68
128
34
Facility 34
CT AVG 47
Rank #178 / 264
Dennis Fitzgerald
$13.6M
Facility $13.6M
CT AVG $19.0M
Rank #59 / 72
$7.3M
Facility $7.3M
CT AVG $7.2M
Rank #58 / 72
54.1%
Facility 54.1%
CT AVG 42.4%
Rank #18 / 72
75318
Hewitt Health & Rehabilitation Center
NH

Nursing Home Licensed facility providing 24/7 skilled nursing care for residents with complex, ongoing medical needs. Staffed by RNs, LPNs, and CNAs. Inspected and star-rated annually by CMS. Accepts Medicare (short-term rehab) and Medicaid (long-term care).

MC

Memory Care Secured, specialized care for people living with Alzheimer's or dementia. Staff trained in cognitive impairment, with higher staff-to-resident ratios and an environment designed to reduce confusion and wandering risk.

Shelton (Maltby Street)
206
Facility 206
CT AVG 111
Rank #11 / 123
--
3.68
Facility 3.68
CT AVG 3.97
Rank #35 / 66
-42%-7%
$8.0k
Facility $8.0k
CT AVG $43.8k
Rank #52 / 68
61
Facility 61
CT AVG 32.0
Rank #64 / 68
6.8
Facility 6.8
CT AVG 5.8
Rank #53 / 68
1114
74
Facility 74
CT AVG 47
Rank #50 / 264
-
$13.2M
Facility $13.2M
CT AVG $19.0M
Rank #63 / 72
$6.7M
Facility $6.7M
CT AVG $7.2M
Rank #64 / 72
50.9%
Facility 50.9%
CT AVG 42.4%
Rank #25 / 72
75047
Jewish Senior Services
NH

Nursing Home Licensed facility providing 24/7 skilled nursing care for residents with complex, ongoing medical needs. Staffed by RNs, LPNs, and CNAs. Inspected and star-rated annually by CMS. Accepts Medicare (short-term rehab) and Medicaid (long-term care).

AL

Assisted Living A licensed, long-term care setting for seniors or individuals with disabilities who need help with daily activities — like bathing, dressing, and medication management — but not 24-hour skilled nursing. Offers housing, meals, and around-the-clock support while aiming to maximize resident independence.

IL

Independent Living Lifestyle-focused communities for older adults offering dining, activities, and transportation with minimal personal care. Best for active, independent seniors who want community without medical support.

MC

Memory Care Secured, specialized care for people living with Alzheimer's or dementia. Staff trained in cognitive impairment, with higher staff-to-resident ratios and an environment designed to reduce confusion and wandering risk.

Bridgeport (North End)
294
Facility 294
CT AVG 111
Rank #3 / 123
97.6%
Facility 97.6%
CT AVG 84%
Rank #2 / 71
+16%
4.72
Facility 4.72
CT AVG 3.97
Rank #16 / 66
-22%+19%
$58.3k
Facility $58.3k
CT AVG $43.8k
Rank #62 / 68
23
Facility 23
CT AVG 32.0
Rank #25 / 68
4.6
Facility 4.6
CT AVG 5.8
Rank #21 / 68
2287
36
Facility 36
CT AVG 47
Rank #173 / 264
Jewish Home For The Elderly Of Fairfield County Incorporated
$96.7M
Facility $96.7M
CT AVG $19.0M
Rank #1 / 72
$42.7M
Facility $42.7M
CT AVG $7.2M
Rank #1 / 72
44.1%
Facility 44.1%
CT AVG 42.4%
Rank #44 / 72
75353
Northbridge Health Care Center
NH

Nursing Home Licensed facility providing 24/7 skilled nursing care for residents with complex, ongoing medical needs. Staffed by RNs, LPNs, and CNAs. Inspected and star-rated annually by CMS. Accepts Medicare (short-term rehab) and Medicaid (long-term care).

AL

Assisted Living A licensed, long-term care setting for seniors or individuals with disabilities who need help with daily activities — like bathing, dressing, and medication management — but not 24-hour skilled nursing. Offers housing, meals, and around-the-clock support while aiming to maximize resident independence.

HC

Home Care Professional care delivered in the person's own home — from companionship and errands to skilled nursing and therapy. Allows seniors to age in place. Medicare covers skilled home health when medically necessary.

HC

Home Care Professional care delivered in the person's own home — from companionship and errands to skilled nursing and therapy. Allows seniors to age in place. Medicare covers skilled home health when medically necessary.

Bridgeport (Brooklawn/St. Vincent)
145
Facility 145
CT AVG 111
Rank #29 / 123
89.0%
Facility 89.0%
CT AVG 84%
Rank #35 / 71
+6%
3.85
Facility 3.85
CT AVG 3.97
Rank #28 / 66
-94%-3%
$57.3k
Facility $57.3k
CT AVG $43.8k
Rank #51 / 68
32
Facility 32
CT AVG 32.0
Rank #46 / 68
4.6
Facility 4.6
CT AVG 5.8
Rank #21 / 68
2129
75
Facility 75
CT AVG 47
Rank #46 / 264
Erica Roman
$32.6M
Facility $32.6M
CT AVG $19.0M
Rank #17 / 72
$12.5M
Facility $12.5M
CT AVG $7.2M
Rank #25 / 72
38.3%
Facility 38.3%
CT AVG 42.4%
Rank #67 / 72
75413

Frequently Asked Questions about Hewitt Health & Rehabilitation Center

What neighborhood is Hewitt Health & Rehabilitation Center in?

Hewitt Health & Rehabilitation Center is in the Maltby Street neighborhood.

Is Hewitt Health & Rehabilitation Center in a walkable area?

Hewitt Health & Rehabilitation Center has a walk score of 74. Very walkable. Most errands can be accomplished on foot, and many essentials are within a short walk.

Are there photos of Hewitt Health & Rehabilitation Center?

Yes — there are 38 photos of Hewitt Health & Rehabilitation Center in the photo gallery on this page.

What is the phone number of Hewitt Health & Rehabilitation Center?

(203) 924-4671 will put you in contact with the team at Hewitt Health & Rehabilitation Center.

Is Hewitt Health & Rehabilitation Center Medicare or Medicaid certified?

Yes — Hewitt Health & Rehabilitation Center is a CMS-certified provider of Medicare and Medicaid.

Guides for Better Senior Living

Care Cost Calculator: See Prices in Your Area

Nursing Home Data Explorer

Don’t Wait Too Long: 7 Red Flag Signs Your Parent Needs Assisted Living Now

The True Cost of Assisted Living in 2025 – And How Families Are Paying For It

Understanding Senior Living Costs: Pricing Models, Discounts & Financial Assistance

Explore Open Rooms
1 Contact details
2 What type of senior care service are you looking for?
3 What budget do you have in mind for senior care?
4 How soon do you need to find care?
5 Additional details

Thank you for your interest!

Our team will be in touch shortly to help with next steps.