


Sapphire Lutheran Homes
Assisted Living, Independent Living & Memory Care · Hamilton, MT
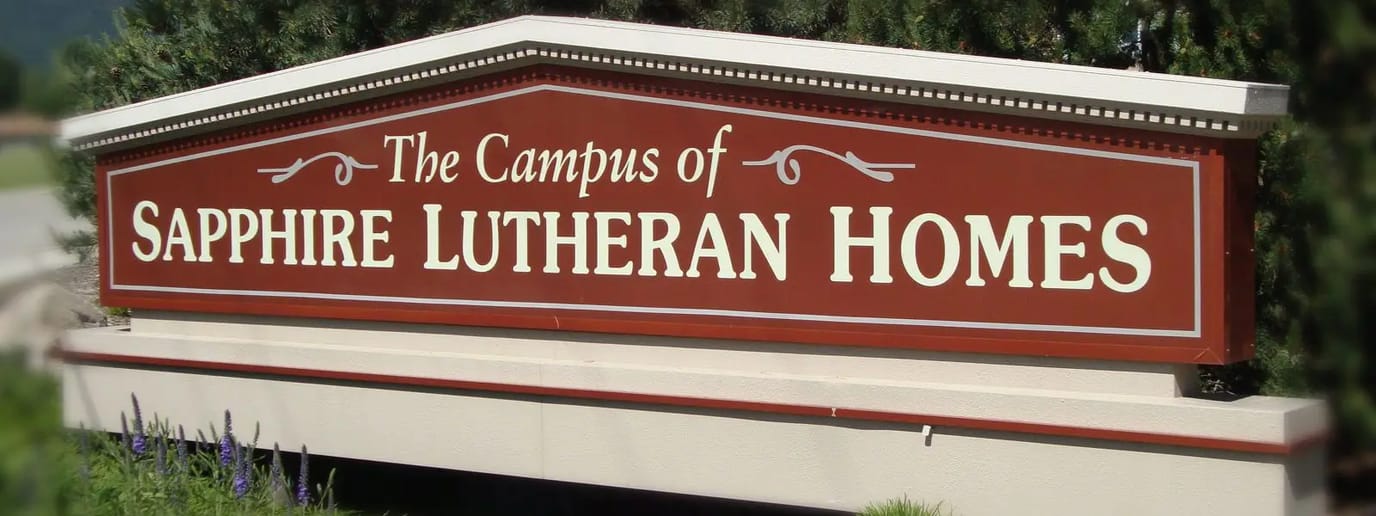
Sapphire Lutheran Homes
Assisted Living, Independent Living & Memory Care · Hamilton, MT
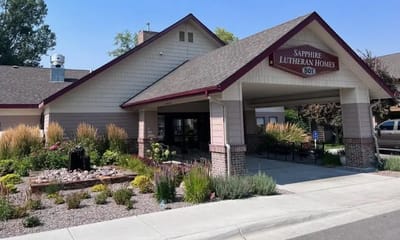
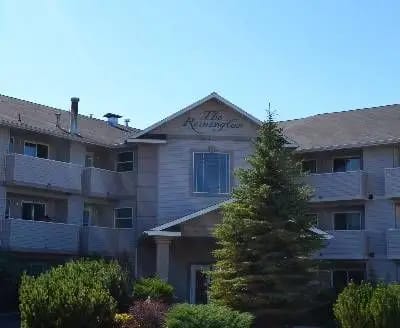
Sapphire Lutheran Homes is a 40-bed independent living facility and memory care community operated by a nonprofit Christian organization at 501 N 10th, Hamilton, Ravalli County, Montana, offering independent living and memory support services with 24-hour staffing, respite care, housekeeping and maintenance services, physical social and spiritual wellness activities, community gathering areas, library, and game rooms. The campus features views of the Bitterroot Mountains and comprises 64 individual homes with one- and two-bedroom apartments offering meals and scheduled activities in a secure environment. The facility does not accept Medicaid or Medicare and does not offer rehabilitation services.
Hamilton is the county seat of Ravalli County in the Bitterroot Valley of western Montana. Marcus Daly Memorial Hospital is the primary nearby acute-care resource.
Inspection records span a single documented visit on November 6, 2015, yielding 2 deficiencies, 66 percent better than Montana average of 5.8. The November 6, 2015, renewal inspection identified 2 deficiencies: no documentation that policies and procedures had been reviewed annually by administrator or medical director; food storage violations with cans and boxes on floors of walk-in freezer, refrigerator, and dry storage room, and uncovered food in baking sheet and plate in refrigerator. No complaint investigations or enforcement actions appear in the available record.
Documentation of annual policy review and food storage practices require verification.
Families should ask administrators directly about current annual policy review procedures and food safety protocols before enrollment.
40-bed community Rank #69 / 104Bed count — State benchmarkedThis home is ranked 69th out of 104 homes in Montana for Bed Count. Shows this facility's certified or reported bed count compared to other Montana facilities. Larger communities may offer more amenities, programs, and on-site services for residents and families.Facilities with the same value for a metric share the same rank. Rankings are based only on facilities in Montana that report data for that category. Facilities without available data are excluded from the ranking.Click the rank badge to see the full State ranking.Click here to see the full State ranking.
A moderately sized community that may balance personal attention with shared amenities and social activities.
2 years in operation Rank #34 / 89Years in operation — State benchmarkedThis home is ranked 34th out of 89 homes in Montana for Years In Operation. Shows how long this facility has been in operation compared to other Montana facilities. Longer operating histories may benefit residents, families, and staff.Facilities with the same value for a metric share the same rank. Rankings are based only on facilities in Montana that report data for that category. Facilities without available data are excluded from the ranking.Click the rank badge to see the full State ranking.Click here to see the full State ranking.
A newer community that may feature more recent facilities and programs.
Walk Score: 82 / 100 Rank #13 / 159Walk Score — State benchmarkedThis home is ranked 13th out of 159 homes in Montana for Walk Score. Shows how walkable this facility's neighborhood is compared to the average Walk Score across Montana facilities. Higher scores benefit residents, families, and staff.Facilities with the same value for a metric share the same rank. Rankings are based only on facilities in Montana that report data for that category. Facilities without available data are excluded from the ranking.Click the rank badge to see the full State ranking.Click here to see the full State ranking.
Very walkable. Most errands can be accomplished on foot, and many essentials are within a short walk.
About this community
Facility TypeRetirement Homes
StatusCurrent
IssuanceDecember 12, 2023
ExpirationDecember 11, 2026
License Number13294
Sapphire Lutheran Homes is administered by Cole Harden.
Licensed Nurses/CNAs
24-Hour Staffing
Pets not allowed
Housekeeping And Maintenance Services
Physical
Social
And Spiritual Wellness Activities
Community Gathering Areas
A Library
And Game Rooms
Activitiesregular exercise sessions
Inspection History
In Montana, the Department of Public Health and Human Services, Quality Assurance Division is the state body responsible for inspecting and licensing all senior residential care facilities.
Since 2015 · 11 years of data
2 deficiencies
4 inspections
Inspection Scorecard
 This scorecard compares key inspection, deficiency, and complaint metrics at this facility against the Montana state average. Metrics rated ≥15% worse than average are highlighted in red; those ≥15% better are highlighted in green.
Since 2015 vs. Montana state average
Overall vs. MT average
0 Worse
No metrics in this bucket.
3 Better
Metrics better than Montana average:
• Total deficiencies (90% below)
• Deficiencies per year (89% below)
• Deficiencies per inspection (83% below)
• Total deficiencies (90% below)
• Deficiencies per year (89% below)
• Deficiencies per inspection (83% below)
Latest Inspection
November 6, 2015
Renewal
Deficiencies
| This Facility | MT Average | vs. MT Avg |
|---|---|---|---|
|
Total deficiencies
| 2 | 21 | This facility has 90% fewer total deficiencies than a typical Montana assisted living residence (2 vs. MT avg 21).↓ 90% better |
|
Deficiencies per year
| 0.2 | 1.9 | This facility has 89% fewer deficiencies per year than a typical Montana assisted living residence (0.2 vs. MT avg 1.9).↓ 89% better |
|
Deficiencies per inspection
| 0.5 | 3 | This facility has 83% fewer deficiencies per inspection than a typical Montana assisted living residence (0.5 vs. MT avg 3).↓ 83% better |
Inspections
| This Facility | MT Average | vs. MT Avg |
|---|---|---|---|
|
Total inspections
| 4 | 7 | This facility has had 43% fewer total inspections than the Montana average (4 vs. MT avg 7). More inspections can mean more regulatory scrutiny rather than worse care.↓ 43% fewer |
Inspection Reports Summary
An editor-reviewed summary of the themes and findings across this facility's recent inspection reports.
- November 6, 2015 inspection found 2 deficiencies, including missing annual policy review documentation and multiple food safety violations in storage areas.
- Food safety issues involved uncovered food and items stored on the floor in walk-in freezer, refrigerator, and dry storage rooms.
- No complaints were reported or substantiated during the November 6, 2015 renewal inspection.
Places of interest near Sapphire Lutheran Homes
![]() 0.0 miles from city center
0.0 miles from city center
![]() Estimated distance in miles from Hamilton's city center to Sapphire Lutheran Homes's address, calculated via Google Maps.
Estimated distance in miles from Hamilton's city center to Sapphire Lutheran Homes's address, calculated via Google Maps.
Calculate Travel Distance to Sapphire Lutheran Homes
Add your location
Compare Assisted Living around the area
The information below is reported by the Montana Department of Public Health and Human Services, Quality Assurance Division.
| Sapphire Lutheran Homes | AL IL MC | Hamilton | 40 | No | - | 82 | - |
| Hidden Meadows | AL MC | Columbia Falls | 32 | No | A+ | 2 | - |
| Silver Springs Assisted Living | AL | Townsend | 24 | No | - | 14 | Private Rooms |
| River‘s Bend Assisted Living | AL | E. Malta (Malta) | 21 | No | - | 34 | Private Rooms |
| Echoview Assisted Living, LLC | AL MC | Kalispell | 8 | No | - | 11 | - |
Frequently Asked Questions about Sapphire Lutheran Homes
Is Sapphire Lutheran Homes in a walkable area?
Sapphire Lutheran Homes has a walk score of 82. Very walkable. Most errands can be accomplished on foot, and many essentials are within a short walk.
What is the license number of Sapphire Lutheran Homes?
According to MT state health department records, Sapphire Lutheran Homes's license number is 13294.
When does Sapphire Lutheran Homes's license expire?
According to MT state health department records, Sapphire Lutheran Homes's license expires on December 11, 2026.
Are pets allowed at Sapphire Lutheran Homes?
No, Sapphire Lutheran Homes has a no-pet policy.
Who is the administrator of Sapphire Lutheran Homes?
Cole Harden is the administrator of Sapphire Lutheran Homes.
How many beds does Sapphire Lutheran Homes have?
Sapphire Lutheran Homes has 40 beds.
Are there photos of Sapphire Lutheran Homes?
Yes — there are 6 photos of Sapphire Lutheran Homes in the photo gallery on this page.
Guides for Better Senior Living
Care Cost Calculator: See Prices in Your Area
Assisted Living Explorer
Don’t Wait Too Long: 7 Red Flag Signs Your Parent Needs Assisted Living Now
The True Cost of Assisted Living in 2025 – And How Families Are Paying For It
Understanding Senior Living Costs: Pricing Models, Discounts & Financial Assistance
Updated on
