


Total staff
149
Employees
145
Contractors
4
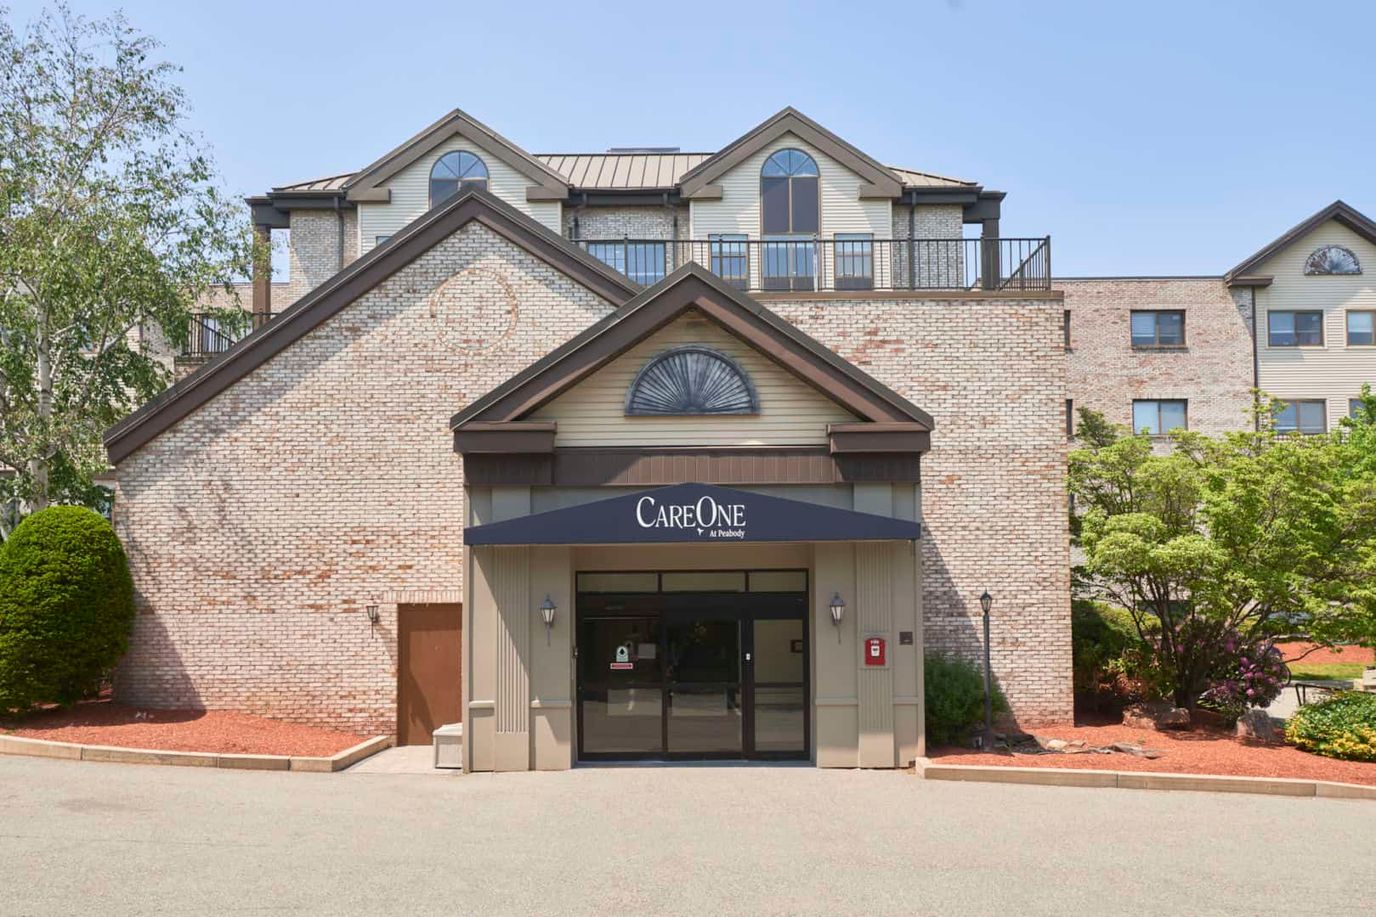
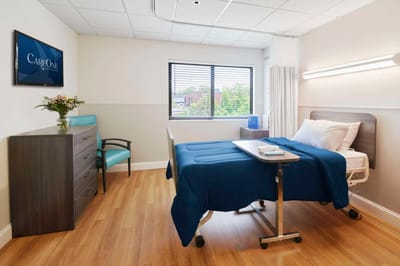
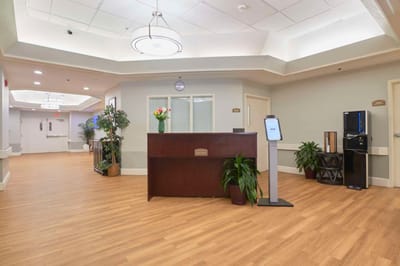
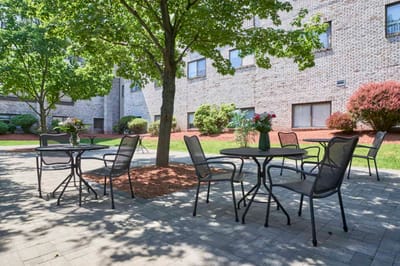
CareOne at Peabody is a nursing home in Peabody, MA, offering long-term care, rehabilitation, respite care, and skilled nursing. The community also ensures older adults can feel at home in a compassionate and nurturing environment. With round-the-clock care, comprehensive therapies, and complex medical care, residents receive the utmost attention and care to live comfortably. Focusing on residents’ healing and recovery, individualized care plans are also created based on their unique needs and habits.
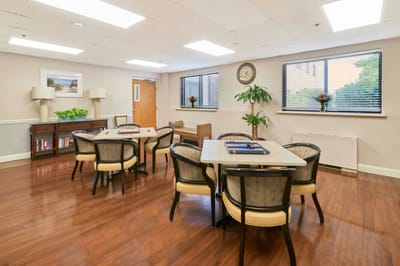
Stretching exercises, social events, and recreational activities encourage residents to stay active and make friends. A game room, a courtyard, and rehabilitation rooms are among the top-notch amenities available for residents’ relaxation and wellness. Residents also have quick access to their necessities and leisure, as it is conveniently located near banks, restaurants, the Northshore Mall, and public transportation in Peabody. Providing high-quality services for older adults’ welfare, this nursing home is one of the finest options for senior living in Massachusetts.
| Staff type | Hours / Day / Resident | vs state avg |
|---|---|---|
|
Registered Nurse (RN)
| 25m per day | ▼ 36% State avg: 39m per day · National avg: 41m per day |
|
LPN / LVN
| 1h 10m per day | ▲ 22% State avg: 57m per day · National avg: 52m per day |
|
Nurse Aide
| 2h 6m per day | ▼ 7% State avg: 2h 16m per day · National avg: 2h 20m per day |
|
Weekend Total Nursing
| 3h 17m per day | ▼ 6% State avg: 3h 29m per day · National avg: 3h 27m per day |
|
Physical Therapist
| 4m per day | ▼ 20% State avg: 5m per day · National avg: 4m per day |
|
Weekend RN
| 14m per day | ▼ 49% State avg: 27m per day · National avg: 29m per day |
Reporting period: October 1 – December 31, 2025 (Q4 2025). Source: CMS Payroll-Based Journal report.
Manages medical care and health needs.
Assists with medical care and medications.
Helps with daily care and mobility.
Total hours from contractors
936 contractor hours this quarter
| Certified Nursing Assistant | 65 | 0 | 65 | 25,993 | 92 | 100% | 8.2 |
| Licensed Practical Nurse | 25 | 0 | 25 | 11,766 | 92 | 100% | 9.7 |
| RN Director of Nursing | 7 | 0 | 7 | 2,709 | 82 | 89% | 8 |
| Registered Nurse | 9 | 0 | 9 | 2,704 | 92 | 100% | 7.6 |
| Clinical Nurse Specialist | 7 | 0 | 7 | 1,975 | 80 | 87% | 7.7 |
| Physical Therapy Assistant | 9 | 0 | 9 | 1,894 | 86 | 93% | 7.1 |
| Other Dietary Services Staff | 4 | 0 | 4 | 1,637 | 92 | 100% | 7.4 |
| Speech Language Pathologist | 4 | 0 | 4 | 1,308 | 80 | 87% | 7.6 |
| Respiratory Therapy Technician | 1 | 2 | 3 | 752 | 67 | 73% | 7.9 |
| Occupational Therapy Aide | 4 | 0 | 4 | 640 | 74 | 80% | 6.5 |
| Dental Services Staff | 2 | 0 | 2 | 605 | 63 | 68% | 7.9 |
| Administrator | 1 | 0 | 1 | 512 | 64 | 70% | 8 |
| Qualified Activities Professional | 1 | 0 | 1 | 512 | 64 | 70% | 8 |
| Nurse Practitioner | 1 | 0 | 1 | 496 | 62 | 67% | 8 |
| Qualified Social Worker | 2 | 0 | 2 | 491 | 61 | 66% | 8 |
| Dietitian | 1 | 0 | 1 | 464 | 58 | 63% | 8 |
| Mental Health Service Worker | 1 | 0 | 1 | 352 | 55 | 60% | 6.4 |
| Physical Therapy Aide | 1 | 1 | 2 | 296 | 39 | 42% | 7.6 |
| Medical Director | 0 | 1 | 1 | 45 | 6 | 7% | 7.5 |
Federal penalties imposed by CMS for regulatory violations, including civil money penalties (fines) and denials of payment for new Medicare/Medicaid admissions.
Source: CMS Penalties Database (Data as of Jan 2026)
Massachusetts average: $72K
Massachusetts average: 1.7
Massachusetts average: 0.1
No penalties in the past 3 years
No civil money penalties or payment denials were reported in the last 3 years.
These measures show how residents usually do over time at this home, based on health outcomes and preventive care.
Massachusetts average: 10.2
Massachusetts average: 20.0
Massachusetts average: 18.7%
Massachusetts average: 19.3%
Massachusetts average: 22.1%
Massachusetts average: 3.6%
Massachusetts average: 4.7%
Massachusetts average: 2.1%
Massachusetts average: 5.2%
Massachusetts average: 10.7%
Massachusetts average: 20.3%
Massachusetts average: 91.9%
Massachusetts average: 94.8%
Massachusetts average: 76.7%
Massachusetts average: 1.3%
Massachusetts average: 77.7%
Quality measures are calculated from Minimum Data Set (MDS) assessments. For most measures, lower percentages indicate better care quality.
41% of new residents, usually for short-term rehab.
50% of new residents, often for short stays.
9% of new residents, often for long-term daily care.
Source: CMS Long-Term Care Facility Characteristics (Data as of Jan 2026)
Residents meet regularly to discuss policies, care quality, and activities
Organized group of residents that meets regularly to discuss facility policies, quality of life, and activities.
Data sourced from CMS Long-Term Care Facility Characteristics quarterly report. Payer mix reflects the current resident census by primary payment source.
Historical financial and operational data for CareOne at Peabody from 2011–2023, based on CMS SNF Cost Reports.
Key figures below are for fiscal year ending in 12/2023.
Based on CMS SNF Cost Report for fiscal year ending in 12/2023.
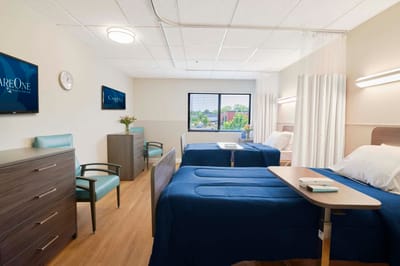
Housing Options: Private Rooms
Building Type: Mid-rise

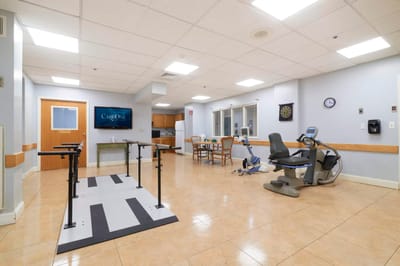
On-site Medical Care and Health Services
Rehabilitative Support
Social and Recreational Activities
This home supports both short-term rehab and long-term care, with residents staying for a wide range of durations.
Most new residents arrive under private pay (50% of admissions), and a typical private pay stay runs around 23 days.
Coverage residents most often arrive under.
Coverage residents most often leave under.
![]() 1.8 miles from city center
1.8 miles from city center
![]() Estimated distance in miles from Peabody's city center to CareOne at Peabody's address, calculated via Google Maps.
Estimated distance in miles from Peabody's city center to CareOne at Peabody's address, calculated via Google Maps.
Add your location
Info below is compiled from CMS reports & the MA Executive Office of Elder Affairs, senior community websites & trusted data sources such as Walk Score & BBB.
Communities are listed from highest to lowest based on our ranking methodology.
| Jeffrey & Susan Brudnick Center for Living | NH MC | Peabody | 180
Facility
180
MA AVG
94
Rank
#11 / 276 |
78.2%
Facility
78.2%
MA AVG
78.3
Rank
#49 / 81 | 0% | 4.11
Facility
4.11
MA AVG
3.93
Rank
#27 / 86 | -34% | +5% | $10.2k
Facility
$10.2k
MA AVG
$76.6k
Rank
#56 / 87 | 25
Facility
25
MA AVG
32.7
Rank
#39 / 86 | 8.3
Facility
8.3
MA AVG
7.2
Rank
#58 / 86 | 1 | 141 | - |
34
Facility
34
MA AVG
53
Rank
#339 / 498 | Jewish Rehabilitation Center For Aged Of The North Shore Inc | $24.1MFiscal year ending 12/2023
Facility
$24.1MFiscal year ending 12/2023
MA AVG
$17.4M
Rank
#23 / 89 | $15.5MFiscal year ending 12/2023
Facility
$15.5MFiscal year ending 12/2023
MA AVG
$6.5M
Rank
#9 / 89 | 64.5%Fiscal year ending 12/2023
Facility
64.5%Fiscal year ending 12/2023
MA AVG
43.6%
Rank
#20 / 89 | 225472 | ||||
| CareOne at Peabody | NH RC SNF | Peabody | 150
Facility
150
MA AVG
94
Rank
#29 / 276 |
89.7%
Facility
89.7%
MA AVG
78.3
Rank
#29 / 81 | +15% | 3.18
Facility
3.18
MA AVG
3.93
Rank
#79 / 86 | -53% | -19% | $0
Facility
$0
MA AVG
$76.6k
Rank
#1 / 87 | 30
Facility
30
MA AVG
32.7
Rank
#47 / 86 | 7.5
Facility
7.5
MA AVG
7.2
Rank
#54 / 86 | 1 | 135 | - |
67
Facility
67
MA AVG
53
Rank
#185 / 498 | - | $18.2MFiscal year ending 12/2023
Facility
$18.2MFiscal year ending 12/2023
MA AVG
$17.4M
Rank
#13 / 89 | $11.2MFiscal year ending 12/2023
Facility
$11.2MFiscal year ending 12/2023
MA AVG
$6.5M
Rank
#27 / 89 | 61.6%Fiscal year ending 12/2023
Facility
61.6%Fiscal year ending 12/2023
MA AVG
43.6%
Rank
#82 / 89 | 225323 | ||||
| Brooksby Village | NH AL IL | Peabody (Brooksby Village Retirement Community) | 104
Facility
104
MA AVG
94
Rank
#89 / 276 |
54.5%
Facility
54.5%
MA AVG
78.3
Rank
#74 / 81 | -30% | 5.16
Facility
5.16
MA AVG
3.93
Rank
#7 / 86 | +4% | +31% | $167.1k
Facility
$167.1k
MA AVG
$76.6k
Rank
#84 / 87 | 12
Facility
12
MA AVG
32.7
Rank
#13 / 86 | 4.0
Facility
4.0
MA AVG
7.2
Rank
#16 / 86 | 1 | 57 | A- |
43
Facility
43
MA AVG
53
Rank
#301 / 498 | Tracie Bettano | $11.1MFiscal year ending 12/2023
Facility
$11.1MFiscal year ending 12/2023
MA AVG
$17.4M
Rank
#1 / 89 | $36.0MFiscal year ending 12/2023
Facility
$36.0MFiscal year ending 12/2023
MA AVG
$6.5M
Rank
#1 / 89 | 324.7%Fiscal year ending 12/2023
Facility
324.7%Fiscal year ending 12/2023
MA AVG
43.6%
Rank
#89 / 89 | 225767 | ||||
| Pilgrim Rehabilitation and Skilled Nursing Center | NH HOS RC | Peabody | 152
Facility
152
MA AVG
94
Rank
#28 / 276 |
80.6%
Facility
80.6%
MA AVG
78.3
Rank
#48 / 81 | +3% | 3.67
Facility
3.67
MA AVG
3.93
Rank
#52 / 86 | +7% | -7% | $0
Facility
$0
MA AVG
$76.6k
Rank
#1 / 87 | 16
Facility
16
MA AVG
32.7
Rank
#21 / 86 | 5.3
Facility
5.3
MA AVG
7.2
Rank
#30 / 86 | 1 | 123 | - |
22
Facility
22
MA AVG
53
Rank
#403 / 498 | Fairview Extended Care Services Inc | $16.4MFiscal year ending 12/2023
Facility
$16.4MFiscal year ending 12/2023
MA AVG
$17.4M
Rank
#24 / 89 | $7.2MFiscal year ending 12/2023
Facility
$7.2MFiscal year ending 12/2023
MA AVG
$6.5M
Rank
#29 / 89 | 43.8%Fiscal year ending 12/2023
Facility
43.8%Fiscal year ending 12/2023
MA AVG
43.6%
Rank
#68 / 89 | 225048 |
CareOne at Peabody is located in Peabody, Massachusetts.
Here are the financial assistance programs available to residents in Massachusetts.
CareOne at Peabody has a walk score of 67. Moderately walkable. Some errands can be accomplished on foot, with a mix of nearby amenities.
CareOne at Peabody's occupancy is 87.0%.
No, CareOne at Peabody has a no-pet policy.
CareOne at Peabody is registered as a for-profit.
Yes — there are 7 photos of CareOne at Peabody in the photo gallery on this page.
CareOne at Peabody is located at 199 Andover St, Peabody, MA 01960.
(978) 531-0772 will put you in contact with the team at CareOne at Peabody.
Care Cost Calculator: See Prices in Your Area
Nursing Home Data Explorer
Don’t Wait Too Long: 7 Red Flag Signs Your Parent Needs Assisted Living Now
The True Cost of Assisted Living in 2025 – And How Families Are Paying For It
Understanding Senior Living Costs: Pricing Models, Discounts & Financial Assistance


