Evergreen Senior Care & Rehab Center
Nursing Home · Battle Creek, MI
CMS overall rating Info The Overall CMS Rating is scored from 1 to 5 stars and combines results from health inspections, staffing levels, and quality measures. Health inspections carry the most weight. Staffing and quality scores can increase or decrease the final rating based on performance compared to state and national standards.

Evergreen Senior Care & Rehab Center

Nursing Home · Battle Creek, MI
CMS overall rating Info The Overall CMS Rating is scored from 1 to 5 stars and combines results from health inspections, staffing levels, and quality measures. Health inspections carry the most weight. Staffing and quality scores can increase or decrease the final rating based on performance compared to state and national standards.
Calculator: See prices in your area
Evergreen Senior Care & Rehab Center accepts Medicare, Medicaid, and private pay.

Overview of Evergreen Senior Care & Rehab Center

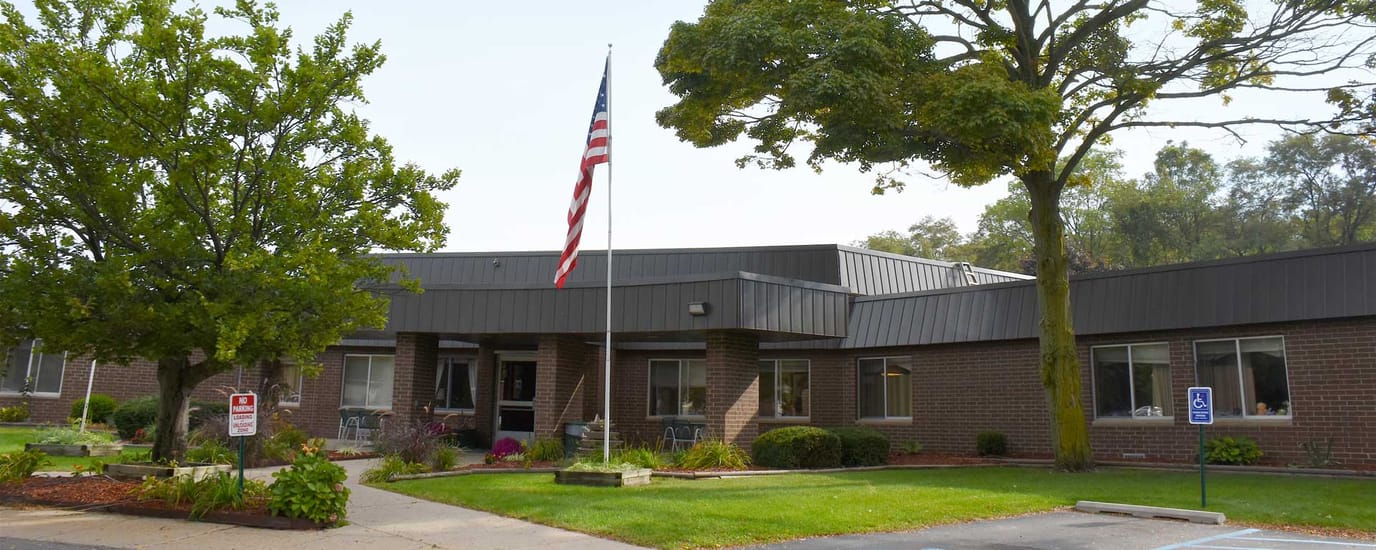
Evergreen Senior Care & Rehab Center is a nursing home in Battle Creek, MI, offering long-term care and rehabilitation. Dedicated to older adults’ comfort and healing, the community continuously promotes a nurturing and family-like environment. With 24-hour care, restaurant-style dining, and comprehensive therapies, residents experience a maintenance-free retirement. Focusing on residents’ holistic well-being, individualized care plans are also provided to help them recover and return to their routines.

Off-site activities, light exercises, and social events ensure residents can live actively and maintain holistic wellness. With a salon, a barbershop, and spacious common areas, residents can rest comfortably. Residents also have quick access to their necessities and leisure, as it is located in the tree-lined neighborhood of Battle Creek. As one of the trusted options for senior living in Michigan, this nursing home strives to help older adults live to their potential.

(810) 534-0150

Quality ratings

Measured by Centers for Medicare & Medicaid Services (CMS)

Overall rating Info The Overall CMS Rating combines results from health inspections, staffing levels and quality measures. Health inspections carry the most weight. Staffing and quality scores can increase or decrease the final rating based on performance compared to state and national standards.
▲ 27.5% Above MI avg. ▲ 27.5% Above MI avg.Click the badge to see the full State ranking.Click here to see the full State ranking.
Health Inspection Info Based on the results of the facility's three most recent standard inspections and any complaint investigations. CMS reviews the number, scope, and severity of deficiencies, with more recent findings weighted more heavily.
▲ 41.5% Above MI avg. ▲ 41.5% Above MI avg.Click the badge to see the full State ranking.Click here to see the full State ranking.
Staffing Info Measures average nursing staff hours per resident per day, including Registered Nurses (RNs) and total nursing staff. Ratings are adjusted based on the level of care residents require and are compared to state and national benchmarks.
▲ 14.4% Above MI avg. ▲ 14.4% Above MI avg.Click the badge to see the full State ranking.Click here to see the full State ranking.
Quality Measures Info Based on clinical and physical health indicators reported to CMS, such as hospital readmissions, falls, pressure ulcers, and improvements in mobility. These measures reflect how well residents' health needs are being managed.
▲ 6.4% Above MI avg. ▲ 6.4% Above MI avg.Click the badge to see the full State ranking.Click here to see the full State ranking.

Staffing hours breakdown

Info Daily nursing hours per resident by staff type, reported to CMS. Higher is generally better — compare this facility to state and national averages to see where staffing stands.

Hours per resident per day — compared to Michigan state averages

Total nursing care / resident Info This home is ranked 75th out of 133 homes in Michigan. Total adjusted nursing hours per resident per day, combining RN, LPN, and aide time. CMS adjusts this for case-mix so facilities can be fairly compared.
3h 53m per day
Rank #75 / 133Nurse hours — State benchmarkedThis home is ranked 75th out of 133 homes in Michigan. Shows adjusted nurse hours per resident per day benchmarked to the Michigan average, with a ranking across 133 Michigan SNFs. More hours mean more direct care. The national average is about 3.5 hrs; below 3.0 is a red flag.Click the rank badge to see the full State ranking.Click here to see the full State ranking.
This facility Michigan avg (4h 18m per day)
vs Michigan avg
-10%
Staff typeHours / Day / Residentvs state avg
Weekend Total Nursing Info Combined nursing hours (RN + LPN + Nurse Aide) per resident per day on weekends. Staffing often drops on weekends — this figure reveals whether the facility maintains adequate coverage outside of weekday hours. 2h 59m per day

Types of Care at Evergreen Senior Care & Rehab Center

Nursing Home

Capacity and availability

This home usually has limited availability

Occupancy between 85% and 95% suggests balanced demand.

Higher occupancy than the Michigan average: 75.8%
Occupancy rate 91.2% Rank #25 / 386Occupancy rate — State benchmarkedThis home is ranked 25th out of 386 homes in Michigan. Shows this facility's occupancy rate versus the Michigan average, with its Statewide rank out of 386. Higher occupancy signals strong local demand and financial stability.Click the rank badge to see the full State ranking.Click here to see the full State ranking.
Avg. Length of Stay 106 days
Occupancy rate
91.2% Rank #25 / 386Occupancy rate — State benchmarkedThis home is ranked 25th out of 386 homes in Michigan. Shows this facility's occupancy rate versus the Michigan average, with its Statewide rank out of 386. Higher occupancy signals strong local demand and financial stability.Click the rank badge to see the full State ranking.Click here to see the full State ranking.
Avg. Length of Stay
106 days
Walk Score
Walk Score: 23 / 100 Rank #502 / 702Walk Score — State benchmarkedThis home is ranked 502nd out of 702 homes in Michigan. Shows how walkable this facility's neighborhood is compared to the average Walk Score across Michigan SNFs. Higher scores benefit residents, families, and staff.Click the rank badge to see the full State ranking.Click here to see the full State ranking.
Car-dependent. Most errands require a car, with limited nearby walkable options.

Contact Evergreen Senior Care & Rehab Center

Staffing Data

Reporting period: October 1 – December 31, 2025 (Q4 2025). Source: CMS Payroll-Based Journal report.

Total staff 125
Employees 105
Contractors 20
Staff to resident ratio 1.39:1
18% worse than Michigan average
Michigan average ratio: 1.70:1 Michigan average ratio: 1.70:1See full Michigan ranking
Avg staff/day 53
Average shift 7.2 hours
9% worse than Michigan average
Michigan average: 7.9 hours Michigan average shift: 7.9 hoursSee full Michigan ranking
Total staff hours (quarter) 35,196

Nursing staff breakdown

Q4 2025 · Oct 1 – Dec 31 More info This data comes from the CMS Payroll-Based Journal report covering October 1 – December 31, 2025.
Registered Nurse

Manages medical care and health needs.

RN Staff 15
Average shift length Info Average shift length. Calculated as total hours divided by days worked and average staff per day. 8.2 hours

No contractors work on this role.

Licensed Practical Nurse

Assists with medical care and medications.

LPN Staff 18
Average shift length Info Average shift length. Calculated as total hours divided by days worked and average staff per day. 7.6 hours

No contractors work on this role.

Certified Nursing Assistant

Helps with daily care and mobility.

CNA Staff 59
Average shift length Info Average shift length. Calculated as total hours divided by days worked and average staff per day. 7.1 hours

No contractors work on this role.

Contractor staffing

Q4 2025 · Oct 1 – Dec 31 More info This data comes from the CMS Payroll-Based Journal report covering October 1 – December 31, 2025.

Total hours from contractors

6.6%

2,323 contractor hours this quarter

Qualified Social Worker: 4 Speech Language Pathologist: 3 Physical Therapy Aide: 3 Physical Therapy Assistant: 3 Respiratory Therapy Technician: 2 Other Physician: 2 Medical Director: 1 Feeding Assistant: 1 Occupational Therapy Assistant: 1

Staff by category

Q4 2025 · Oct 1 – Dec 31 More info This data comes from the CMS Payroll-Based Journal report covering October 1 – December 31, 2025.
Certified Nursing Assistant5905918,55392100%7.1
Licensed Practical Nurse180185,21792100%7.6
Registered Nurse150153,87392100%8.2
Other Dietary Services Staff4041,50592100%7.1
Speech Language Pathologist0339566975%7.7
Mental Health Service Worker2028886571%7.9
Occupational Therapy Aide2027836470%8
Clinical Nurse Specialist2026076470%7.1
Administrator1015046368%8
Dietitian1014886166%8
Nurse Practitioner1014566065%7.6
Physical Therapy Aide0333955560%7.2
Physical Therapy Assistant0333738289%4.3
Respiratory Therapy Technician0223596672%5.3
Medical Director011883235%2.7
Qualified Social Worker044842022%4.2
Occupational Therapy Assistant0114455%8.7
Other Physician022221921%1.1
Feeding Assistant011411%4
59 Certified Nursing Assistant
% of Days 100%
18 Licensed Practical Nurse
% of Days 100%
15 Registered Nurse
% of Days 100%
4 Other Dietary Services Staff
% of Days 100%
3 Speech Language Pathologist
% of Days 75%
2 Mental Health Service Worker
% of Days 71%
2 Occupational Therapy Aide
% of Days 70%
2 Clinical Nurse Specialist
% of Days 70%
1 Administrator
% of Days 68%
1 Dietitian
% of Days 66%
1 Nurse Practitioner
% of Days 65%
3 Physical Therapy Aide
% of Days 60%
3 Physical Therapy Assistant
% of Days 89%
2 Respiratory Therapy Technician
% of Days 72%
1 Medical Director
% of Days 35%
4 Qualified Social Worker
% of Days 22%
1 Occupational Therapy Assistant
% of Days 5%
2 Other Physician
% of Days 21%
1 Feeding Assistant
% of Days 1%

Penalties and fines

Federal penalties imposed by CMS for regulatory violations, including civil money penalties (fines) and denials of payment for new Medicare/Medicaid admissions.

Source: CMS Penalties Database

No penalties in the past 3 years

No civil money penalties or payment denials were reported in the last 3 years.

Quality of care over time

These measures show how residents usually do over time at this home, based on health outcomes and preventive care.

High-risk clinical events score Info A composite score based on pressure ulcers, falls with injury, weight loss, walking ability decline, and activities of daily living decline. 5.9
29% better than Michigan average

Michigan average: 8.4

Functional decline score Info A composite score based on activities of daily living decline, walking ability decline, and incontinence. 8.2
50% better than Michigan average

Michigan average: 16.3

Long-stay resident measures
Need for Help with Daily Activities Increased Info Percent of long-stay residents whose need for help with daily activities has increased 8.9%
29% better than Michigan average

Michigan average: 12.5%

Walking Ability Worsened Info Percent of long-stay residents whose ability to move independently worsened 9.0%
42% better than Michigan average

Michigan average: 15.3%

Low Risk Residents with Bowel/Bladder Incontinence Info Percent of low risk long-stay residents who lose control of their bowels or bladder 6.8%
68% better than Michigan average

Michigan average: 21.0%

Falls with Major Injury Info Percent of long-stay residents experiencing one or more falls with major injury 2.1%
33% better than Michigan average

Michigan average: 3.2%

High Risk Residents with Pressure Ulcers Info Percent of long-stay high risk residents with pressure ulcers 6.2%
8% worse than Michigan average

Michigan average: 5.7%

Urinary Tract Infection Info Percent of long-stay residents with a urinary tract infection 1.1%
35% better than Michigan average

Michigan average: 1.7%

Lost Too Much Weight Info Percent of long-stay residents who lose too much weight 3.5%
38% better than Michigan average

Michigan average: 5.7%

Depressive Symptoms Info Percent of long-stay residents who have depressive symptoms 7.2%
86% worse than Michigan average

Michigan average: 3.9%

Antipsychotic Use Info Percent of long-stay residents who received an antipsychotic medication 17.1%
14% worse than Michigan average

Michigan average: 15.0%

Pneumococcal Vaccine Info Percent of long-stay residents assessed and appropriately given the pneumococcal vaccine 99.3%
5% better than Michigan average

Michigan average: 94.9%

Influenza Vaccine Info Percent of long-stay residents assessed and appropriately given the seasonal influenza vaccine 100.0%
5% better than Michigan average

Michigan average: 95.0%

Short-stay resident measures
Pneumococcal Vaccine Info Percent of short-stay residents assessed and appropriately given the pneumococcal vaccine 79.9%
In line with Michigan average

Michigan average: 82.5%

Antipsychotic medication increase Info Percent of short-stay residents who newly received an antipsychotic medication 0.0%
100% better than Michigan average

Michigan average: 1.4%

Influenza Vaccine Info Percent of short-stay residents assessed and appropriately given the seasonal influenza vaccine 87.3%
10% better than Michigan average

Michigan average: 79.5%

Breakdown by payment type

Medicare

30% of new residents, usually for short-term rehab.

Typical stay 19 days

Private pay

52% of new residents, often for short stays.

Typical stay 1 - 2 months

Medicaid

18% of new residents, often for long-term daily care.

Typical stay 1 years

Facility Characteristics

Source: CMS Long-Term Care Facility Characteristics (Data as of Jan 2026)

Total residents 90
Medicare
11
12.2% of residents
Medicaid
60
66.7% of residents
Private pay or other
19
21.1% of residents
Programs & Services
Residents Group

Residents meet regularly to discuss policies, care quality, and activities

Active Resident Council

Organized group of residents that meets regularly to discuss facility policies, quality of life, and activities.

Finances and operations

Privately-owned community
Operated by a business corporation.
Home revenue
$13.8M
Operating loss
-$188.1K
Privately-owned community Operated by a business corporation.
Home revenue
$13.8M Rank #83 / 134Revenue — State benchmarkedThis home is ranked 83rd out of 134 homes in Michigan. Shows this facility's annual revenue compared to the Michigan SNF average. Higher revenue generally means more resources for staffing and capital — read alongside Payroll %.Click the rank badge to see the full State ranking.Click here to see the full State ranking.
Operating loss
-$188.1K
Payroll costs Info The portion of the home's budget spent on staff, including nurses, caregivers, and other employees who support care and operations. Rank #80 / 134Payroll — State benchmarkedThis home is ranked 80th out of 134 homes in Michigan. Shows total annual staff payroll benchmarked to the Michigan average. Higher payroll investment relative to peers often signals better staffing and less reliance on cheaper contract labor.Click the rank badge to see the full State ranking.Click here to see the full State ranking.
$6.2M
44.5% of revenue Rank #56 / 134Payroll % — State benchmarkedThis home is ranked 56th out of 134 homes in Michigan. Shows payroll as a percentage of revenue versus the Michigan average. Well-run Michigan SNFs typically land around 49–59% — the top third Statewide. Below 25% may signal understaffing or heavy agency use — read with Staffing ratings.Click the rank badge to see the full State ranking.Click here to see the full State ranking.
Other operating costs Info All remaining costs needed to run the home, such as food, utilities, building maintenance, supplies and administrative expenses.
$7.9M
Total costs $14.0M

What does this home offer?

Building type icon
Building type icon

Building Type: Single-story

On-site medical care and health services icon

On-site Medical Care and Health Services

Rehabilitative support icon

Rehabilitative Support

Beauty services icon

Beauty Services

Dining services icon

Dining Services

Social and recreational activities icon

Social and Recreational Activities

Who this home usually serves

TYPE OF STAY

Mix of rehab and long-term care

This home supports both short-term rehab and long-term care, with residents staying for a wide range of durations.

Places of interest near Evergreen Senior Care & Rehab Center

Address 5.1 miles from city center Info Estimated distance in miles from Battle Creek's city center to Evergreen Senior Care & Rehab Center's address, calculated via Google Maps.

Calculate Travel Distance to Evergreen Senior Care & Rehab Center

Add your location

Address

Financial Assistance for
Nursing Home in Michigan

Evergreen Senior Care & Rehab Center is located in Battle Creek, Michigan.
Here are the financial assistance programs available to residents in Michigan.

Get Financial aid guidance

MI Choice Waiver

Michigan Medicaid MI Choice Waiver

Age 65+ or disabled
General Michigan resident, Medicaid- eligible, nursing home-level care need.
Income Limits (2025) ~$2,829/month 300% FBR, individual
Asset Limits $2,000 (individual), $3,000 (couple).
MI

Delivered through regional waiver agents; waitlists possible.

Benefits
Personal care (5-7 hours/day) Respite care (240 hours/year) Home modifications ($1,500 avg.) Adult day care ($65/day)

Home Help Program

Michigan Home Help

Age 65+ or disabled
General Michigan resident, Medicaid- eligible or low-income.
Income Limits ~$1,732/month individual, Medicaid threshold
Asset Limits $2,000 individual
MI

Can hire family caregivers; less intensive than waiver.

Benefits
Personal care (up to 60 hours/month) Homemaker services Respite (varies)

Program of All-Inclusive Care for the Elderly (PACE)

Michigan PACE

Age 55+
General Michigan resident, nursing home-level care need, safe with PACE support.
Income Limits (2025) ~$2,829/month (Medicaid-eligible); private pay option available.
Asset Limits $2,000 (individual), $3,000 (couple).
MI

16 PACE centers (e.g., Ingham, Wayne counties); expanding slowly.

Benefits
Personal care (5-7 hours/day) Medical care Meals Transportation Therapy Respite

Medicare Savings Program (MSP)

Michigan Medicare Savings Program

Age 65+ or disabled
General Michigan resident, Medicare Part A/B.
Income Limits (2025) ~$2,510/month (QMB), ~$3,380/month (SLMB), ~$3,598/month (QI)—individual.
Asset Limits $9,430 (individual), $14,130 (couple).
MI

Three tiers; no waitlist; includes Extra Help for Part D.

Benefits
Covers Part B premiums ($174.70/month) Deductibles ($240/year) Copays (~20%)

National Family Caregiver Support Program (NFCSP) Respite

Michigan NFCSP Respite Care

Age
General Caregivers of 60+ needing care or 55+ caregivers of others; Michigan resident; functional needs (2+ ADLs).
Income Limits (2025) Prioritizes ~$24,980/year (individual); no strict cap.
Asset Limits Not assessed; need-based.
MI

16 AAAs; prioritizes low-income, rural caregivers.

Benefits
Respite (4-6 hours/week or 5 days/year) Adult day care ($60/day) Caregiver training

VA Aid and Attendance (A&A) and Housebound Benefits

Michigan VA Aid and Attendance/Housebound

Age 65+ or disabled veteran/spouse
General Michigan resident, wartime service, need for ADL help (A&A) or homebound.
Income Limits (2025) Net income < ~$1,984/month (veteran with dependent, A&A); pension offsets income.
Asset Limits ~$155,356 net worth limit
MI

High veteran demand in urban/rural areas.

Benefits
Cash (~$1,433-$2,642/month veteran, ~$951-$1,318 spouse) for care costs

Compare Nursing Home around Battle Creek

The information below is reported by the Michigan Department of Licensing and Regulatory Affairs (LARA).

3 facilities compared · CMS & MI Dept. of Health data

Filter by care type
Evergreen Senior Care & Rehab Center
NH

Nursing Home Licensed facility providing 24/7 skilled nursing care for residents with complex, ongoing medical needs. Staffed by RNs, LPNs, and CNAs. Inspected and star-rated annually by CMS. Accepts Medicare (short-term rehab) and Medicaid (long-term care).

Battle Creek91 91.2% +20%3.88 +18%-10%$0203.3190 23 Nexcare Holdings, LLC$13.8M$6.2M44.5%235054
Laurels of Bedford
NH

Nursing Home Licensed facility providing 24/7 skilled nursing care for residents with complex, ongoing medical needs. Staffed by RNs, LPNs, and CNAs. Inspected and star-rated annually by CMS. Accepts Medicare (short-term rehab) and Medicaid (long-term care).

HC

Home Care Professional care delivered in the person's own home — from companionship and errands to skilled nursing and therapy. Allows seniors to age in place. Medicare covers skilled home health when medically necessary.

MC

Memory Care Secured, specialized care for people living with Alzheimer's or dementia. Staff trained in cognitive impairment, with higher staff-to-resident ratios and an environment designed to reduce confusion and wandering risk.

RC

Respite Care Short-term temporary care — days to weeks — to give family caregivers a break. Full care provided during the stay. Often used after hospitalization or to trial a facility before a permanent placement decision.

Battle Creek123 84.9% +12%3.40 +7%-21%$0459.01111 16 Brad Mason$22.0M$7.4M33.8%235299
Majestic Care of Battle Creek
NH

Nursing Home Licensed facility providing 24/7 skilled nursing care for residents with complex, ongoing medical needs. Staffed by RNs, LPNs, and CNAs. Inspected and star-rated annually by CMS. Accepts Medicare (short-term rehab) and Medicaid (long-term care).

HC

Home Care Professional care delivered in the person's own home — from companionship and errands to skilled nursing and therapy. Allows seniors to age in place. Medicare covers skilled home health when medically necessary.

RC

Respite Care Short-term temporary care — days to weeks — to give family caregivers a break. Full care provided during the stay. Often used after hospitalization or to trial a facility before a permanent placement decision.

Battle Creek65 72.9% -4%3.51 -16%-18%$76.5k617.6450 20 Majestic Michigan Operations I LLC$5.9M$3.0M50.1%235023

Frequently Asked Questions about Evergreen Senior Care & Rehab Center

Is Evergreen Senior Care & Rehab Center in a walkable area?

Evergreen Senior Care & Rehab Center has a walk score of 23. Car-dependent. Most errands require a car, with limited nearby walkable options.

What is the address of Evergreen Senior Care & Rehab Center?

Evergreen Senior Care & Rehab Center is located at 111 Evergreen Rd, Battle Creek, MI 49037.

What is the phone number of Evergreen Senior Care & Rehab Center?

(810) 534-0150 will put you in contact with the team at Evergreen Senior Care & Rehab Center.

Is Evergreen Senior Care & Rehab Center Medicare or Medicaid certified?

Yes — Evergreen Senior Care & Rehab Center is a CMS-certified provider of Medicare and Medicaid.

Guides for Better Senior Living

Care Cost Calculator: See Prices in Your Area

Nursing Home Data Explorer

Don’t Wait Too Long: 7 Red Flag Signs Your Parent Needs Assisted Living Now

The True Cost of Assisted Living in 2025 – And How Families Are Paying For It

Understanding Senior Living Costs: Pricing Models, Discounts & Financial Assistance

Explore Open Rooms
1 Contact details
2 What type of senior care service are you looking for?
3 What budget do you have in mind for senior care?
4 How soon do you need to find care?
5 Additional details

Thank you for your interest!

Our team will be in touch shortly to help with next steps.