


Wilshire Estates Gracious Retirement Community
Wilshire Estates Gracious Retirement Community
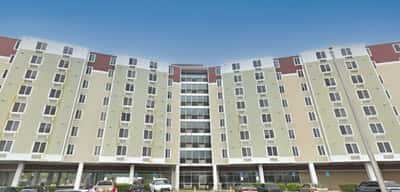
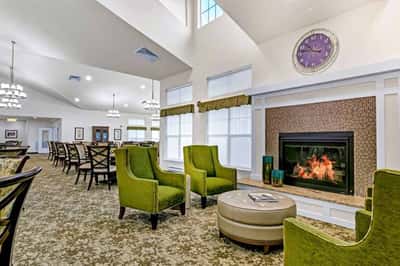
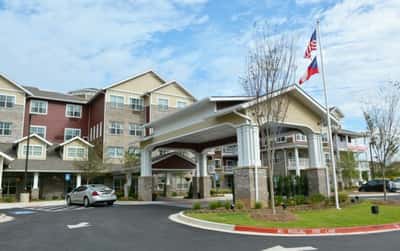
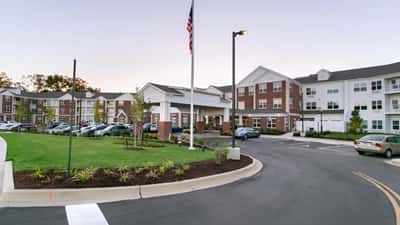
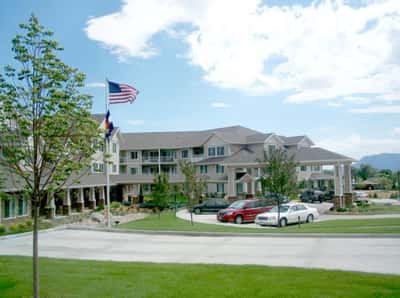
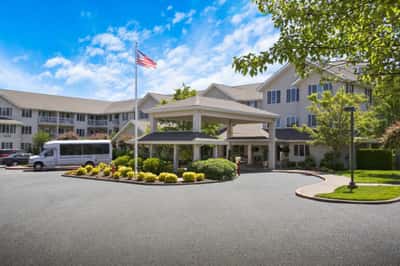
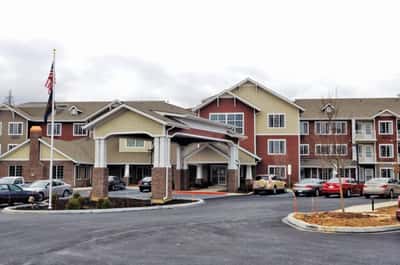
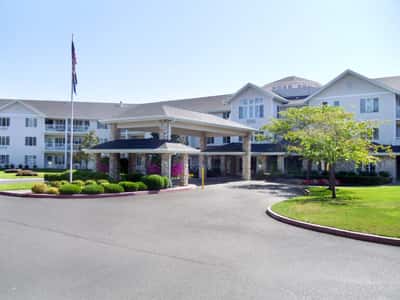
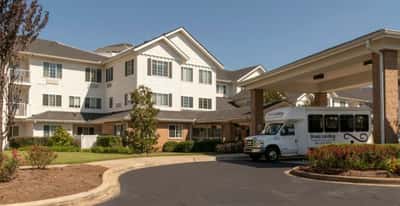
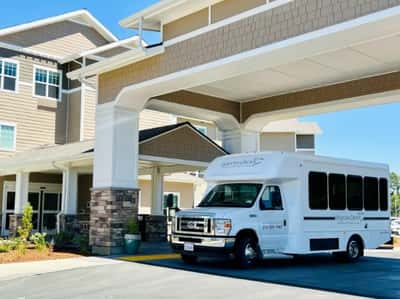
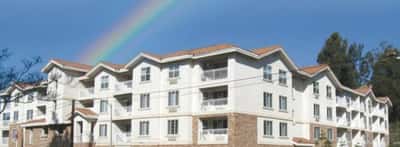
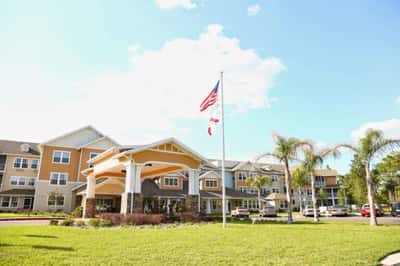
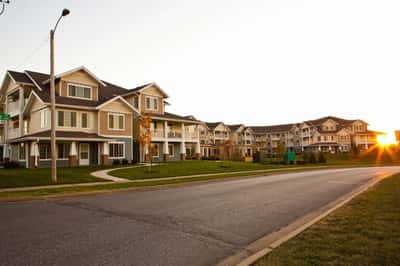
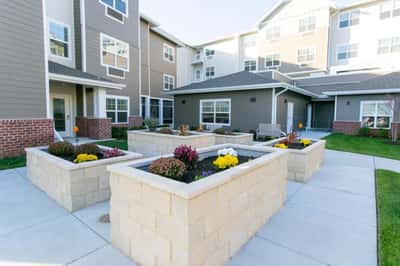
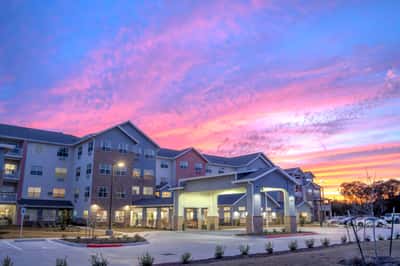
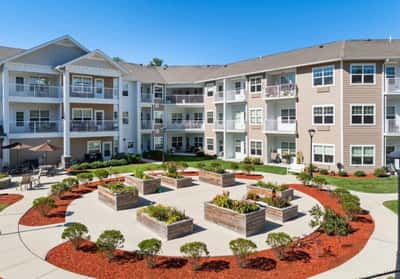
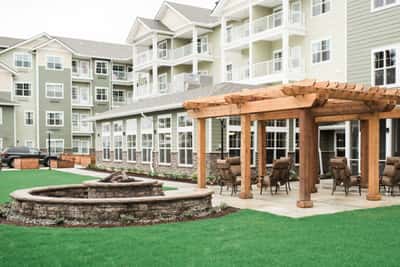
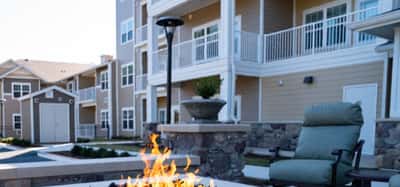
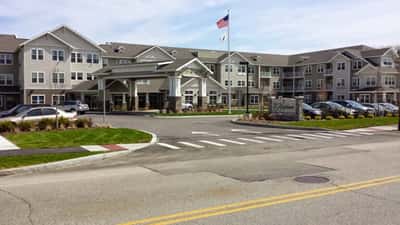
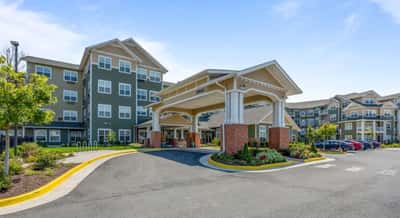
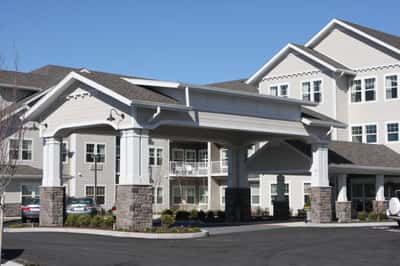
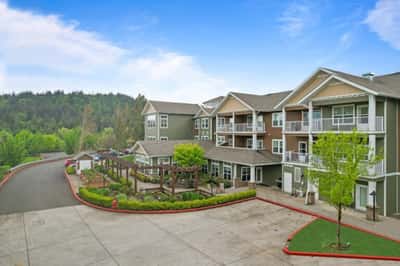
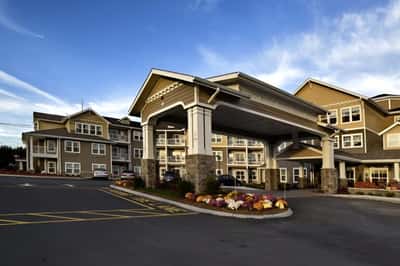
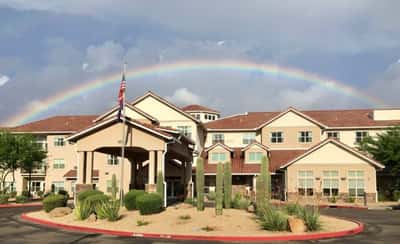
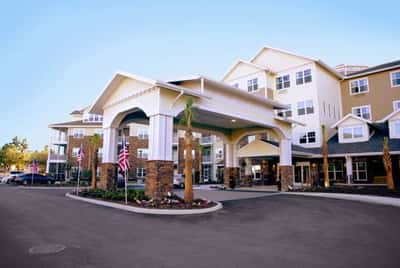
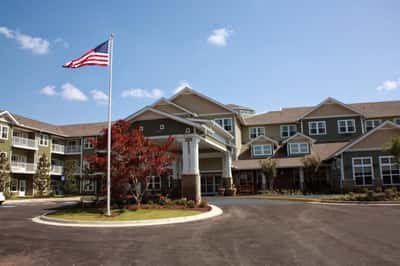
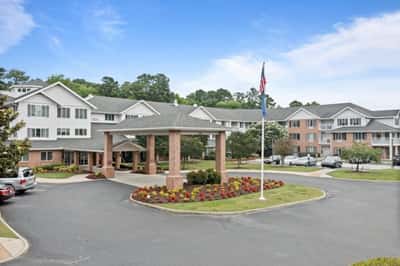
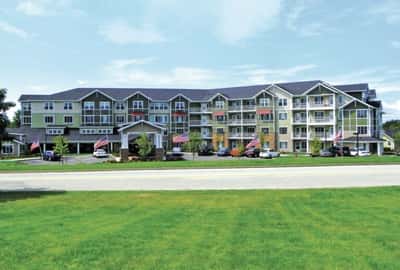
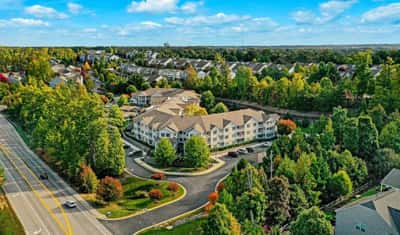
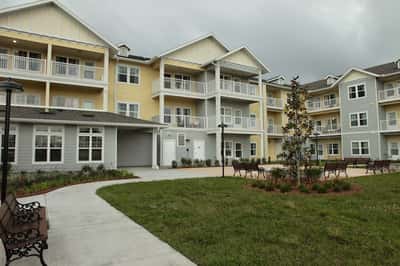
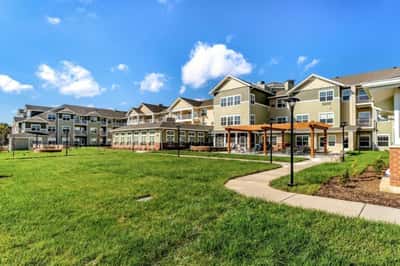
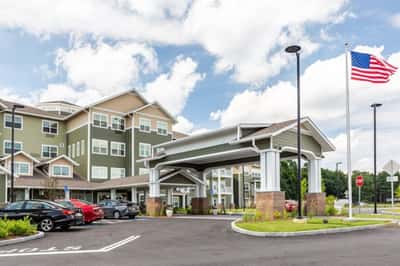
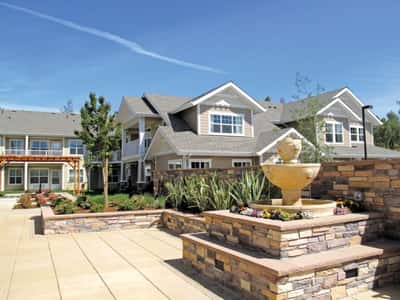
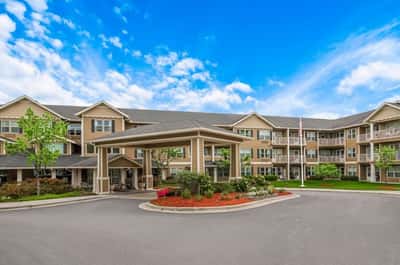
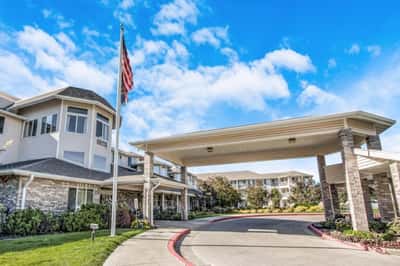
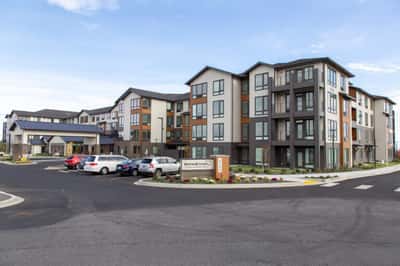
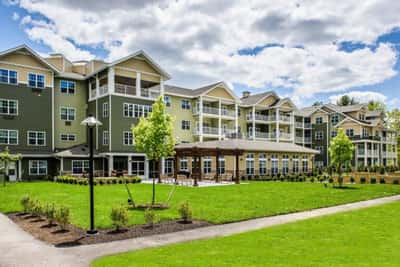
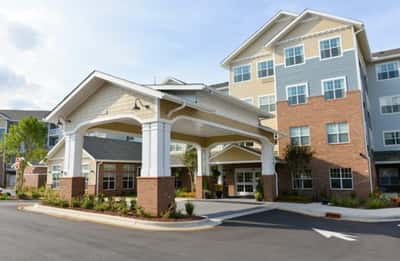
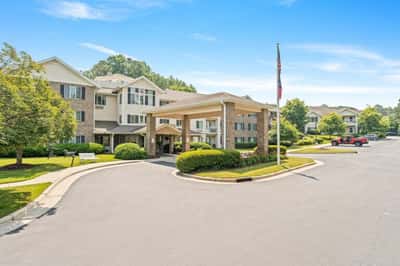
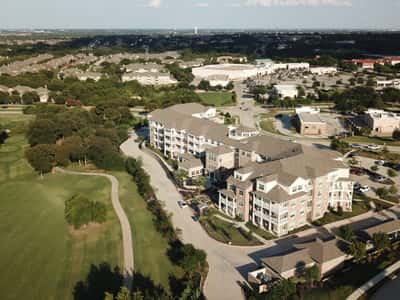
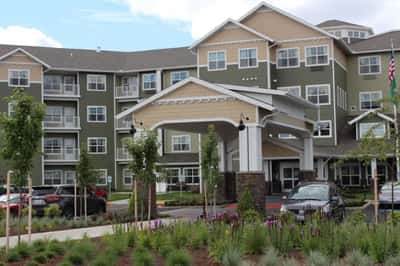
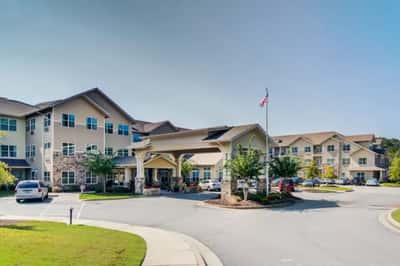
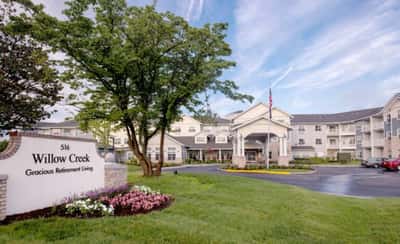
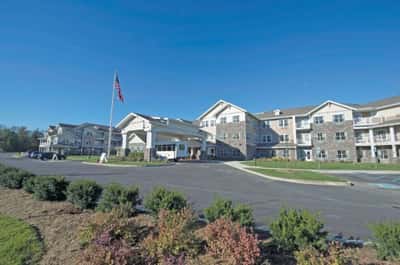
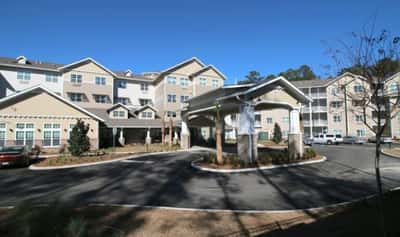
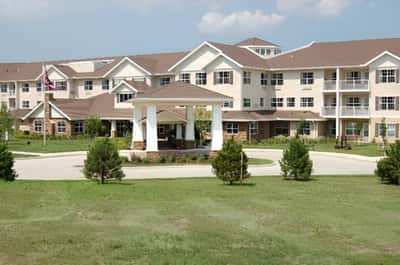
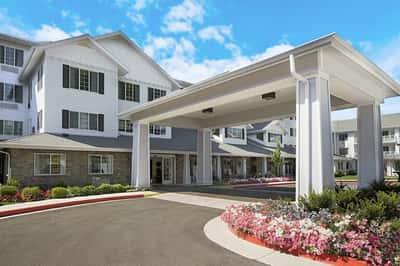
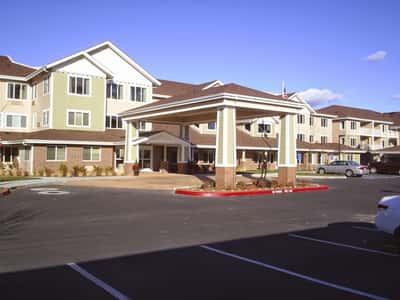
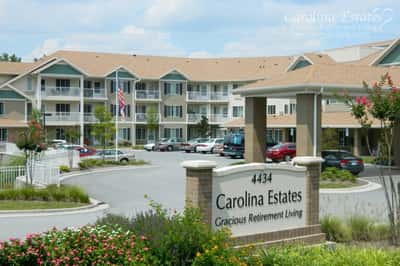
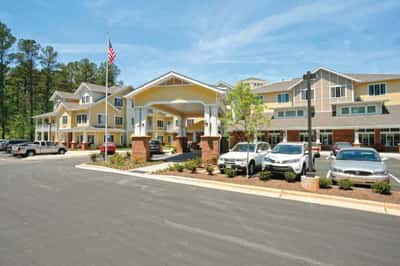
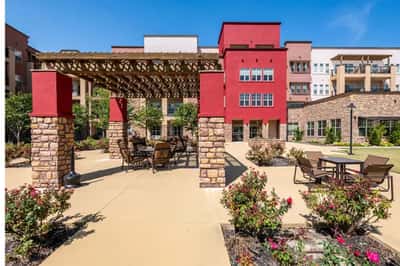
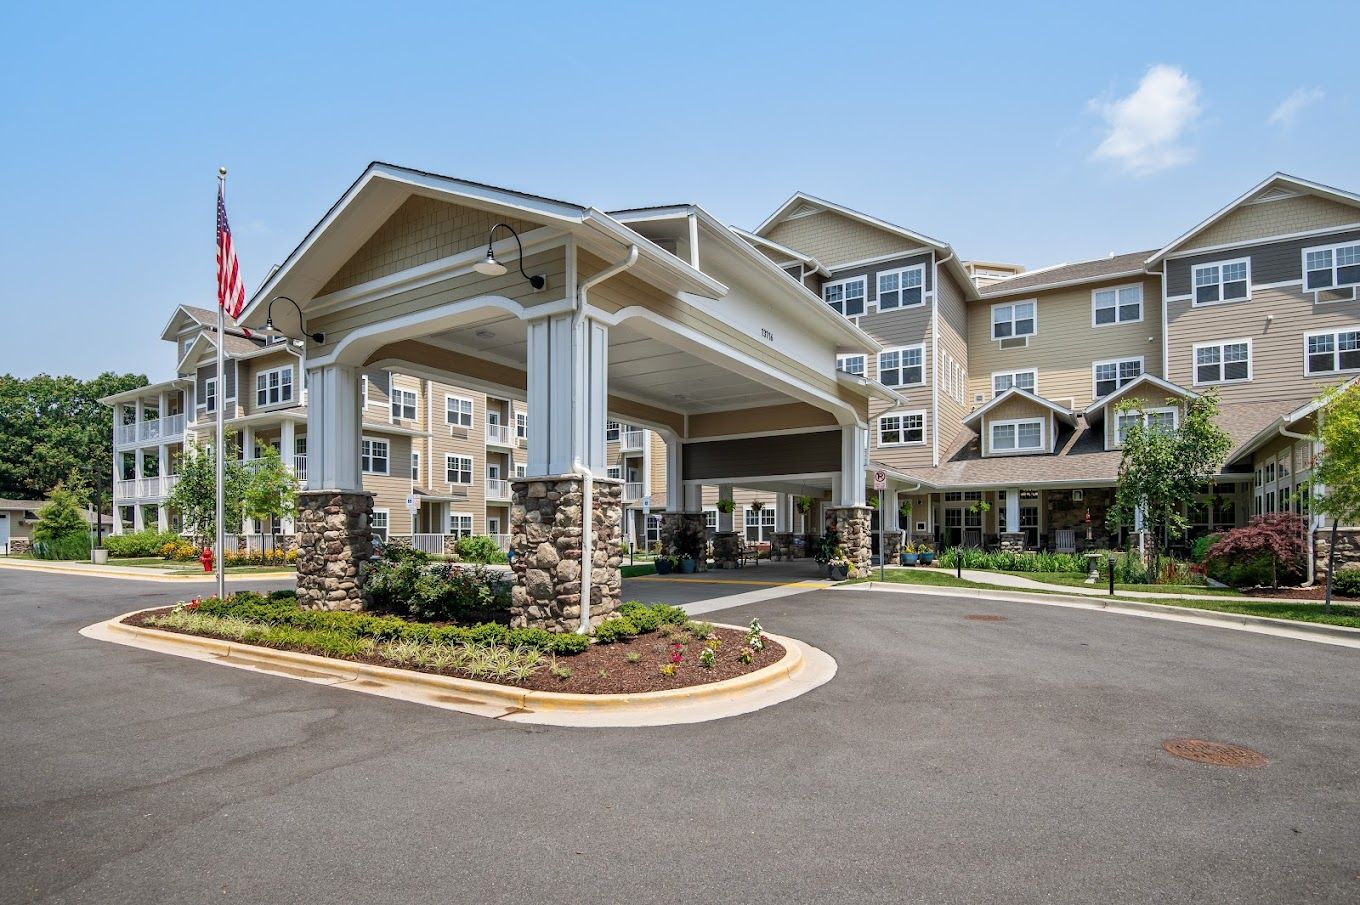
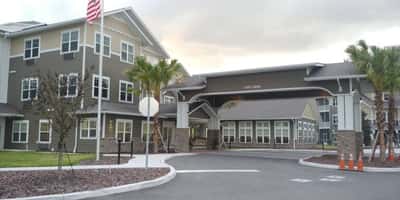
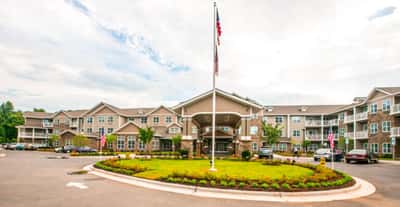
Experience the epitome of independent living at Wilshire Estates Gracious Retirement Living. The community in Silver Spring, Maryland invites individuals to age with grace in a place where comfort and safety are paramount. Whether they prefer a cozy studio, a spacious one-bedroom apartment, or an elegant two-bedroom retreat, each option is thoughtfully designed to provide both comfort and style, all within the scope of the all-inclusive independent living cost.
From artistic endeavors that nurture their creativity to engaging discussions on current issues, there’s something for everyone to enjoy. The resident travel program further enriches their experience, whisking them away to different destinations at no additional expense, allowing them to explore the world and create lasting memories.
Walk Score: 47 / 100 Rank #459 / 985Walk Score — State benchmarkedThis home is ranked 459th out of 985 homes in Maryland. Shows how walkable this facility's neighborhood is compared to the average Walk Score across Maryland facilities. Higher scores benefit residents, families, and staff.Click the rank badge to see the full State ranking.Click here to see the full State ranking.
Somewhat walkable. A few nearby services may be reachable on foot, but most trips require transportation.
What does this home offer?
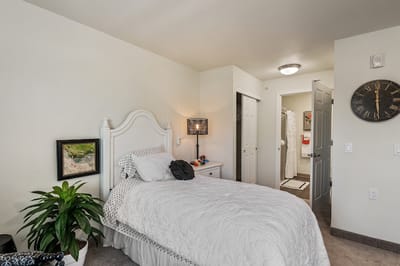
Room Sizes: 388-825 / 513-1,051 / 937-1,001 sq. ft
Housing Options: Studio / 1 Bed / 2 Bed
Building Type: Mid-rise
Transportation Services
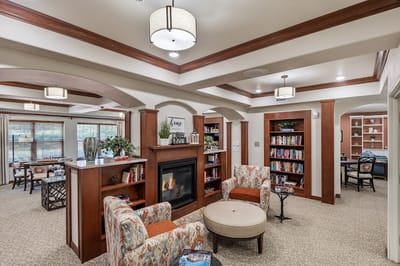
Recreational Activities
Housekeeping Services
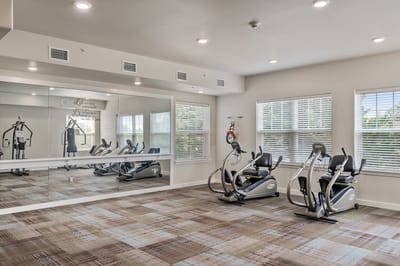
Exercise Programs
Living Spaces & Floor Plans for Wilshire Estates Gracious Retirement Community
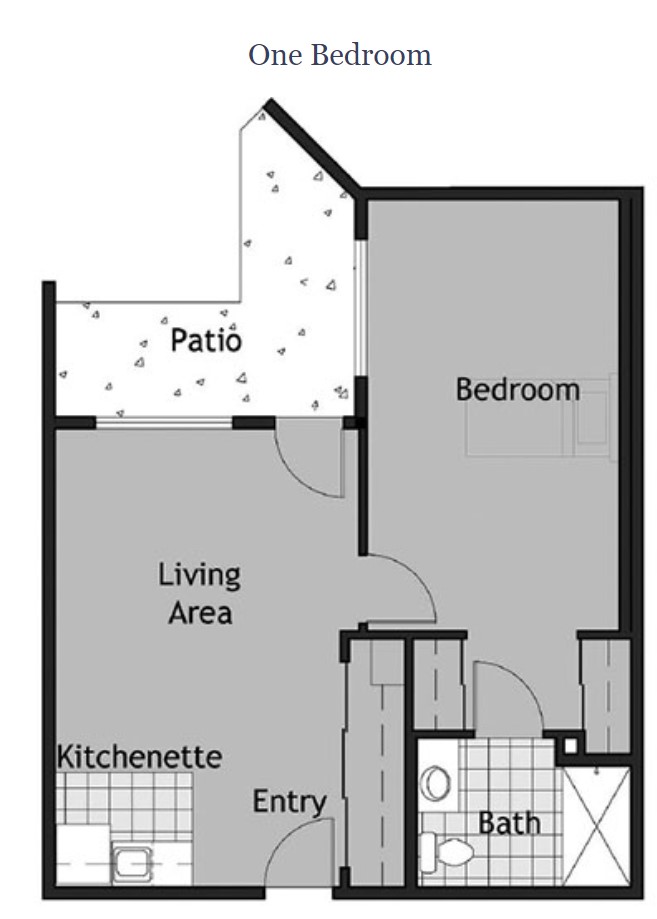
Wilshire Estates Gracious Retirement Community 1Bedroom
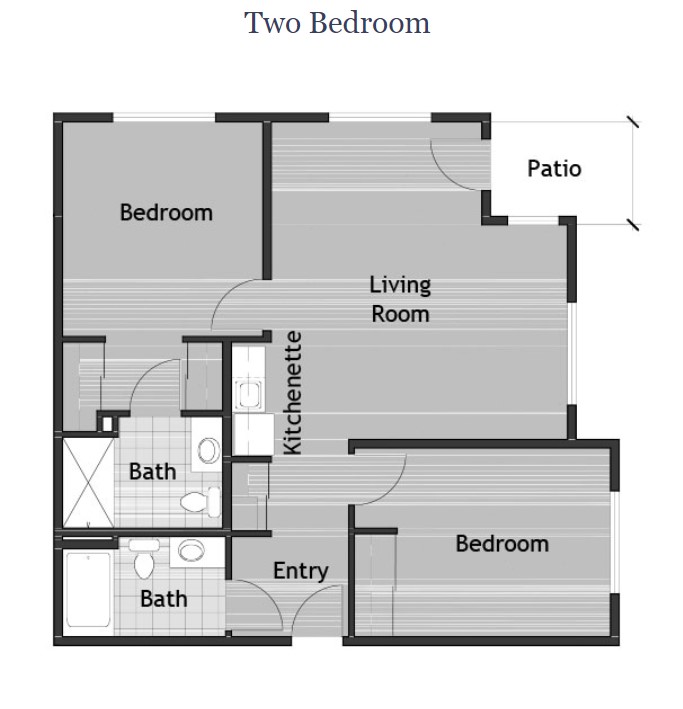
Wilshire Estates Gracious Retirement Community 2Bedroom
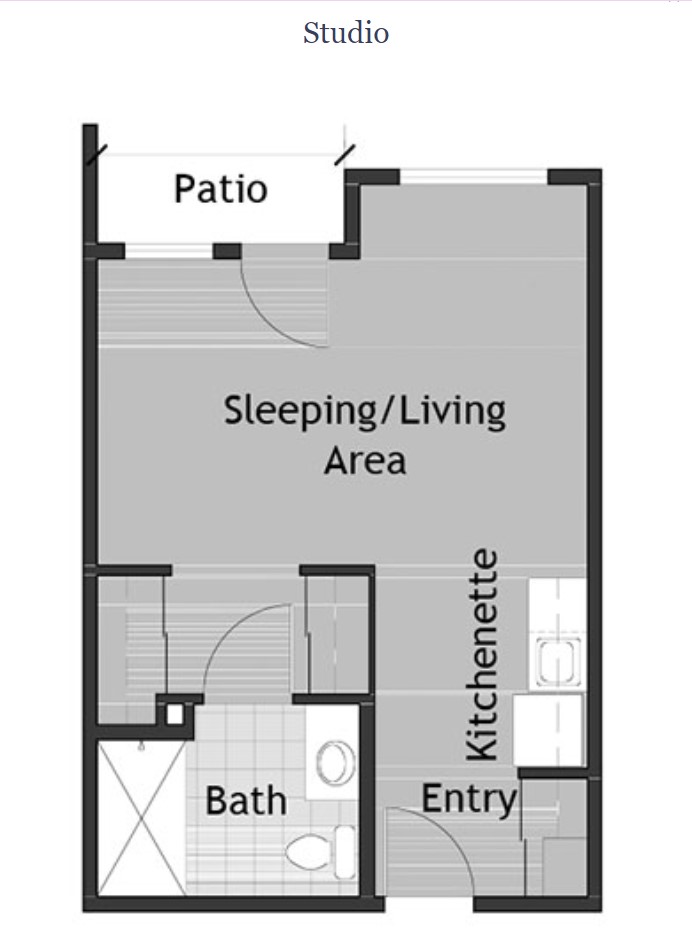
Wilshire Estates Gracious Retirement Community Studio
Places of interest near Wilshire Estates Gracious Retirement Community
![]() 7.5 miles from city center
7.5 miles from city center
![]() Estimated distance in miles from Silver Spring's city center to Wilshire Estates Gracious Retirement Community's address, calculated via Google Maps.
— 6.36 miles to nearest hospital (UM Laurel Medical Center)
Estimated distance in miles from Silver Spring's city center to Wilshire Estates Gracious Retirement Community's address, calculated via Google Maps.
— 6.36 miles to nearest hospital (UM Laurel Medical Center)
Calculate Travel Distance to Wilshire Estates Gracious Retirement Community
Add your location
Financial Assistance for
Independent Living in Maryland
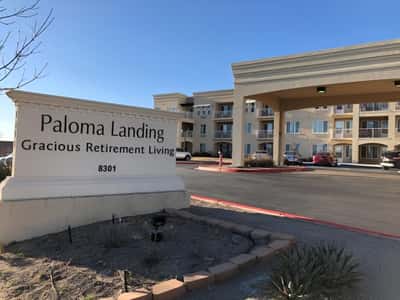
Wilshire Estates Gracious Retirement Community is located in Silver Spring, Maryland.
Here are the financial assistance programs available to residents in Maryland.
More homes from the same operator
Operated by
Hawthorn Senior Living
Osprey Heights Gracious Retirement Living
2808 Lithia Pinecrest Rd, Valrico, FL 33596, United States

Summerville Estates Gracious Retirement Living
704 Central Ave, Summerville, SC 29483, United States
Providence Meadows Gracious Retirement Living
4123 Kuykendall Rd, Charlotte, NC 28270, United States
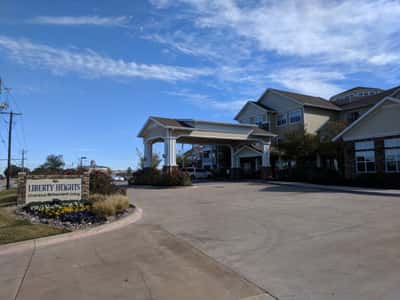
Liberty Heights Gracious Retirement Living
963 W Yellow Jacket Ln, Rockwall, TX 75087, United States
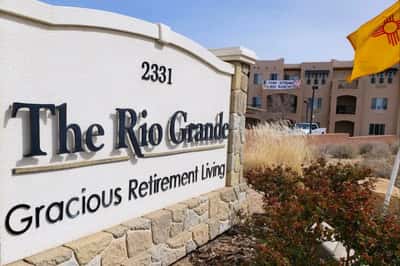
The Rio Grande Gracious Retirement Living
2331 Westside Blvd SE, Rio Rancho, NM 87124, United States
Frequently Asked Questions about Wilshire Estates Gracious Retirement Community
Is Wilshire Estates Gracious Retirement Community in a walkable area?
Wilshire Estates Gracious Retirement Community has a walk score of 47. Somewhat walkable. A few nearby services may be reachable on foot, but most trips require transportation.
Are there photos of Wilshire Estates Gracious Retirement Community?
Yes — there are 4 photos of Wilshire Estates Gracious Retirement Community in the photo gallery on this page.
What is the address of Wilshire Estates Gracious Retirement Community?
Wilshire Estates Gracious Retirement Community is located at 13716 New Hampshire Ave, Silver Spring, MD 20904, United States.
What is the phone number of Wilshire Estates Gracious Retirement Community?
(301) 246-8432 will put you in contact with the team at Wilshire Estates Gracious Retirement Community.
Is Wilshire Estates Gracious Retirement Community Medicare or Medicaid certified?
Wilshire Estates Gracious Retirement Community is not currently listed as a CMS-certified provider of Medicare or Medicaid.
Guides for Better Senior Living
Care Cost Calculator: See Prices in Your Area
Nursing Home Data Explorer
Don’t Wait Too Long: 7 Red Flag Signs Your Parent Needs Assisted Living Now
The True Cost of Assisted Living in 2025 – And How Families Are Paying For It
Understanding Senior Living Costs: Pricing Models, Discounts & Financial Assistance
Contact Us

Updated on
Feedback
Write a review for Wilshire Estates Gracious Retirement Community
Rate your overall experience with this community
Explore Open Rooms
1
Contact details
2
What type of senior care service are you looking for?
3
What budget do you have in mind for senior care?
4
How soon do you need to find care?
5
Additional details
Thank you for your interest!
Our team will be in touch shortly to help with next steps.
Need Help?
Let us help you or a loved one find the perfect senior home.
