Maplewood Park Place

Assisted Living in Bethesda

CMS overall rating Info The Overall CMS Rating is scored from 1 to 5 stars and combines results from health inspections, staffing levels, and quality measures. Health inspections carry the most weight. Staffing and quality scores can increase or decrease the final rating based on performance compared to state and national standards.
Calculator: See prices in your area
Maplewood Park Place accepts Medicare and private pay.

Overview of Maplewood Park Place

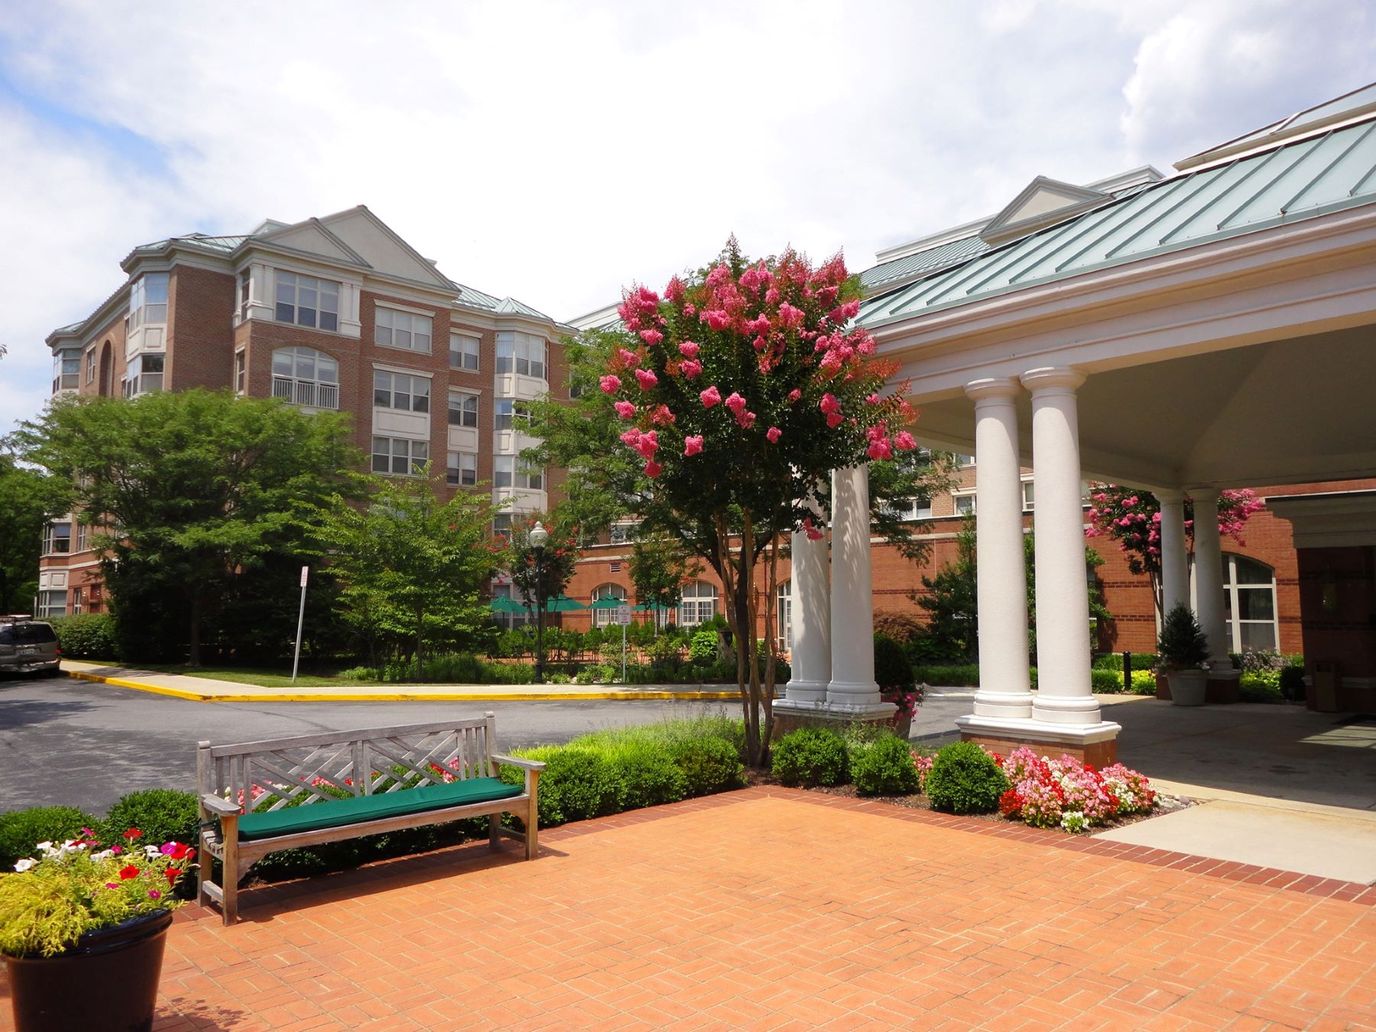
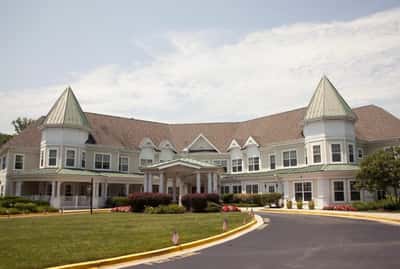
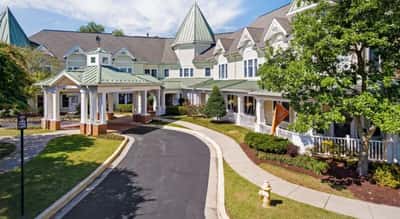
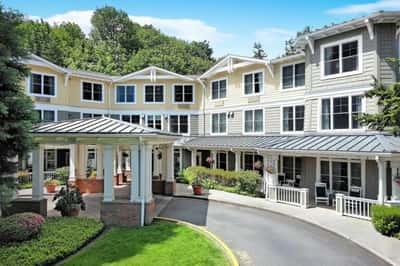
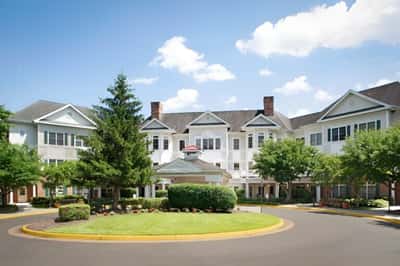
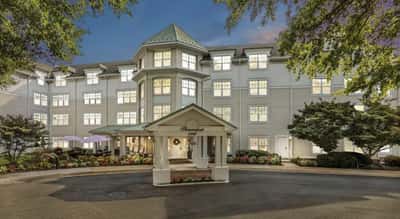
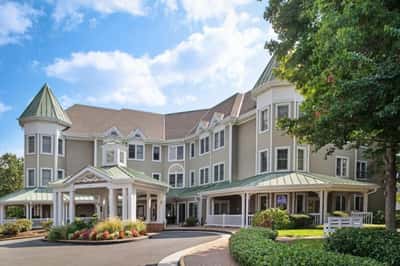
Recognized as the Best Senior Living Community by Bethesda Magazine readers for an impressive eleven consecutive years, Maplewood Park Place is the epitome of an exceptional living experience. Established in 1996 in Bethesda, Maryland, Maplewood stands as a resident-owned cooperative community exclusively designed for individuals aged 60 and above. With a wide array of spacious one-level floor plans, residents can choose their ideal living space tailored to their preferences. Nestled within a secure, wooded suburban neighborhood inside the Beltway, Maplewood offers an independent living experience characterized by a vibrant community atmosphere.

Maplewood Park Place prides itself on its rich activities, amenities, and superb dining options. With 24/7 security and concierge services, residents can enjoy peace of mind and feel fully attended to. The dedicated and engaging staff members are committed to ensuring a high level of care and attention. In addition to independent living, Maplewood also offers assisted living, skilled nursing care, personalized memory care, support, and on-site rehabilitation services to cater to the evolving needs of its resident owners. Qualified residents can benefit from the unique Lifecare Plan, which provides access to top-quality long-term health care and/or assisted living with manageable costs. At Maplewood Park Place, residents can embrace a fulfilling and enriching lifestyle surrounded by a welcoming community of peers.

(301) 530-0500

Quality ratings

Measured by Centers for Medicare & Medicaid Services (CMS)

Overall rating Info The Overall CMS Rating combines results from health inspections, staffing levels and quality measures. Health inspections carry the most weight. Staffing and quality scores can increase or decrease the final rating based on performance compared to state and national standards.
5/5 ▲ 1.6 Maryland average: 3.4/5
Health Inspection Info Based on the results of the facility's three most recent standard inspections and any complaint investigations. CMS reviews the number, scope, and severity of deficiencies, with more recent findings weighted more heavily.
5/5 ▲ 1.8 Maryland average: 3.2/5
Staffing Info Measures average nursing staff hours per resident per day, including Registered Nurses (RNs) and total nursing staff. Ratings are adjusted based on the level of care residents require and are compared to state and national benchmarks.
5/5 ▲ 1.5 Maryland average: 3.5/5
Quality Measures Info Based on clinical and physical health indicators reported to CMS, such as hospital readmissions, falls, pressure ulcers, and improvements in mobility. These measures reflect how well residents' health needs are being managed.
5/5 ▲ 1.3 Maryland average: 3.7/5

Staffing hours breakdown

Info Daily nursing hours per resident by staff type, reported to CMS. Higher is generally better — compare this facility to state and national averages to see where staffing stands.

Hours per resident per day — compared to Maryland state averages

Total nursing care / resident Info This home is ranked 1st out of 106 homes in Maryland.

Total adjusted nursing hours per resident per day, combining RN, LPN, and aide time. CMS adjusts this for case-mix so facilities can be fairly compared.
7h 42m per day
Rank #1 / 106Nurse hours — state benchmarkedThis home is ranked 1st out of 106 homes in Maryland.Shows adjusted nurse hours per resident per day benchmarked to the Maryland average, with a ranking across 106 Maryland SNFs. More hours mean more direct care. The national average is about 3.5 hrs; below 3.0 is a red flag.
This facility Maryland avg (4h 17m per day)
vs Maryland avg
+80%

0 of 1 metrics below state avg

Standout metric Total Nursing (Weekend) is +75% above state avg
Staff typeHours / dayvs state avg
Total Nursing (Weekend) Info Combined nursing hours (RN + LPN + Nurse Aide) per resident per day on weekends. Staffing often drops on weekends — this figure reveals whether the facility maintains adequate coverage outside of weekday hours. 6h 5m per day ▲ 75% State avg: 3h 28m per day · National avg: 3h 26m per day

Capacity and availability

Avg. Length of Stay
77 days

Who this home usually serves

TYPE OF STAY

Mostly short-term rehab stays

Most residents typically stay for a few weeks or months before returning home or moving on.

Breakdown by payment type

Medicare

62% of new residents, usually for short-term rehab.

Typical stay 1 months

Private pay

38% of new residents, often for short stays.

Typical stay 9 years

Finances and operations

Privately-owned community
Operated by a business corporation.
Home revenue
$21.4M
Profit
$794.8K
Privately-owned community Operated by a business corporation.
Home revenue
$21.4M Rank #43 / 109Revenue — state benchmarkedThis home is ranked 43rd out of 109 homes in Maryland.Shows this facility's annual revenue compared to the Maryland SNF average. Higher revenue generally means more resources for staffing and capital — read alongside Payroll %.
Profit
$794.8K
Payroll costs Info The portion of the home's budget spent on staff, including nurses, caregivers, and other employees who support care and operations. Rank #27 / 109Payroll — state benchmarkedThis home is ranked 27th out of 109 homes in Maryland.Shows total annual staff payroll benchmarked to the Maryland average. Higher payroll investment relative to peers often signals better staffing and less reliance on cheaper contract labor.
$7.9M
36.7% of revenue Rank #21 / 109Payroll % — state benchmarkedThis home is ranked 21st out of 109 homes in Maryland.Shows payroll as a percentage of revenue versus the Maryland average. Well-run SNFs often land around 55–65%. Below 25% may signal understaffing or heavy agency use — read with Staffing ratings.
Other operating costs Info All remaining costs needed to run the home, such as food, utilities, building maintenance, supplies and administrative expenses.
$12.8M
Total costs $20.6M
Bed community size
29-bed community
A moderately sized community that may balance personal attention with shared amenities and social activities.
Years in operation
30 years in operation
A longer operating history, which may indicate experience navigating regulations and delivering ongoing care.
Walk Score
Walk Score: 38 / 100 Rank #57 / 91Walk Score — state benchmarkedThis home is ranked 57th out of 91 homes in Maryland.Shows how walkable this facility's neighborhood is compared to the average Walk Score across Maryland SNFs. Higher scores benefit residents, families, and staff.
Somewhat walkable. A few nearby services may be reachable on foot, but most trips require transportation.

Services

24-hour Awake Staff
Alzheimer's Care
Barber Services
Beauty Services
Catheter Care
Colostomy Care
Decubitus Care
Dementia Care

About this community

Occupancy

Occupancy rate
97%
Rank #6 / 109Occupancy rate — state benchmarkedThis home is ranked 6th out of 109 homes in Maryland.Shows this facility's occupancy rate versus the Maryland average, with its statewide rank out of 109. Higher occupancy signals strong local demand and financial stability.
Higher than the Maryland average: 60%
Occupied beds
28 / 29
Average residents 104 per day

Awards

AwardsReaders pick Maplewood 'Best Senior Living Community' 15 years in a row!

License Details

Facility TypeSole Proprietorship
CountyMontgomery
CMS Certification Number215287

Ownership & Operating Entity

Profit Statustrue

Room costs

Private Room $318 - $407 per day

Hospice Affiliations

Holy Cross Home Care & Hospice
Jewish Social Service Agency Hospice
Montgomery Hospice & Prince George's Hospice

Staffing

Key information about the people who lead and staff this community.

Leadership

CNA Training Program

Therapy & Rehabilitation

2 services
Rehabilitation Services
Respite Care

Staffing & Medical

2 services
Doctor on Staff
24-Hour Staffing

Memory & Specialized Care

3 services
Mild Alzheimer's Level
Moderate Alzheimer's Level
Severe Alzheimer's Level

Additional Policies & Features

Continuing Care Retirement Community (CCRC)

Amenities & Lifestyle

Fitness Center
Heated Indoor Pool
Whirlpool
Library
Dining Options
Transportation Services
Concierge Physician On Call 24/7
ActivitiesThe community offers dynamic activities including entertainment, arts, nature excursions, and wellness opportunities.
Specific ProgramsHome, About Us, The Maplewood Difference, Resident Ownership and Governance, Recent Renovations, Awards, Home Tours, Community Amenities, Lifestyle, Activities, Health Care, Resident Stories, Blog, Contact Us
Operating HoursMonday through Friday 10:00 a.m. to 5:00 p.m.; After hours by request; Weekends by appointment.

Dining & Nutrition

Food DescriptionMaplewood offers several different dining options on-site, including a five-course meal at an elegantly renovated restaurant and a cafe or bistro for lighter fare.

What does this home offer?

Minimum age icon
Minimum age icon

Minimum Age: 60 Years Old

Pets allowed icon
Pets allowed icon

Pets Allowed: Yes, Pets Allowed

Housing options icon

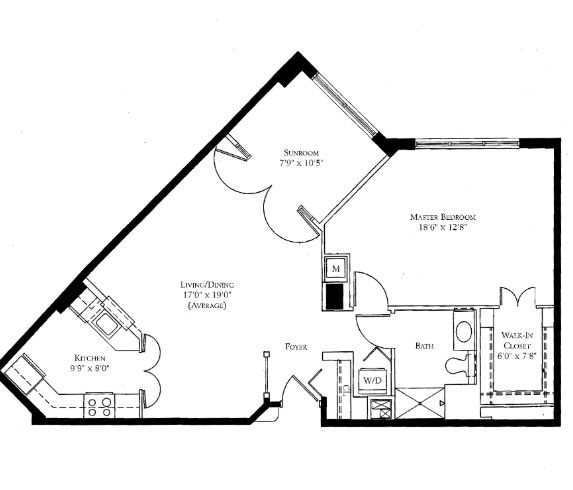
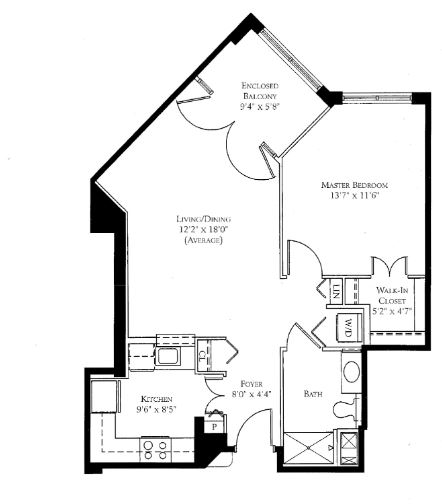
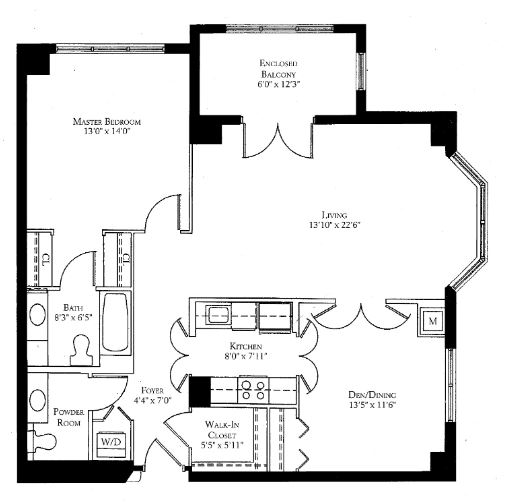
Housing Options: 1 Bed / 2 Bed

Building type icon
Building type icon

Building Type: Mid-rise

Transportation services icon

Transportation Services

Fitness and recreation icon

Fitness and Recreation

Types of Care at Maplewood Park Place

Assisted Living Independent Living Nursing Home

Contact Maplewood Park Place

Demographics

Resident demographic information for this facility.

Gender

  • Female 82.4%
  • Male 17.7%

Age Distribution

  • 95+ 70.6%
  • 85-94 23.5%
  • 75-84 5.9%

Ethnicity

  • White 100%

Inspection History

In Maryland, the Department of Health, Office of Health Care Quality is the state agency that conducts unannounced inspections and issues reports for all assisted living and nursing facilities.

Maryland average: 5 visits/inspections

Maryland average: 2 inspections

Health Inspection History

Inspections
Total health inspections 2

Maryland average 3.9


Last Health inspection on Mar 2025

Total health citations
5 Rank #1 / 108Health citations — state benchmarkedThis home is ranked 1st out of 108 homes in Maryland.Shows this facility's total health deficiency citations benchmarked to the Maryland state average, with a ranking across all 108 MD SNFs. Lower citation counts earn a better rank.

Maryland average 49.9

Citations per inspection
2.5 Rank #1 / 108Citations per inspection — state benchmarkedThis home is ranked 1st out of 108 homes in Maryland.Shows average deficiency citations per CMS inspection for this facility versus the Maryland mean across 108 SNFs with citation data. Lower is better.

Maryland average 12.81


Health citations are formal notices following inspections when they fail to comply with safety and care standards.

All 5 citations resulted from standard inspections.

Breakdown of citation severity (last 3 years)
Critical Health citations More info
0
100% better than Maryland average

Maryland average: 0.5


Serious Health citations More info 1
67% worse than Maryland average

Maryland average: 0.6

0 critical citations More info Maryland average: 0.5

1 serious citation More info Maryland average: 0.6

4 moderate citations More info Maryland average: 47.2

0 minor citations More info Maryland average: 1.7
Citations history (last 3 years)
Pharmacy moderate citation Info Issues related to medication management, including how drugs are stored, administered, and monitored. Mar 10, 2025
Corrected

Quality of Care moderate citation Info Issues related to how well residents receive appropriate treatment and support for their medical and daily care needs. Mar 10, 2025
Corrected

Care Planning moderate citation Info Issues related to creating and updating personalized care plans for residents based on their needs and conditions. Mar 10, 2025
Corrected

Quality of Care serious citation Info Issues related to how well residents receive appropriate treatment and support for their medical and daily care needs. Aug 02, 2019
Corrected

Living Spaces & Floor Plans

Maplewood Park Place Plan 4
Maplewood Park Place Plan 3
Maplewood Park Place Plan 2
Maplewood Park Place Plan 1

Financial Assistance for
Assisted Living in Maryland

Maplewood Park Place is located in Bethesda, Maryland.
Here are the financial assistance programs available to residents in Maryland.

Get Financial aid guidance

Community Options Waiver

Maryland Medicaid Community Options Waiver

Age 65+ or disabled
General Maryland resident, Medicaid- eligible, nursing home-level care need.
Income Limits (2025) ~$2,829/month 300% FBR, individual
Asset Limits $2,000 (individual), $3,000 (couple) (excludes home, car).
MD

High urban demand; rural outreach efforts.

Benefits
Personal care (5-7 hours/day, e.g., bathing, dressing) Respite care (up to 240 hours/year) Adult day care ($70/day) Home modifications ($1,500 avg.)

Senior Care Program

Maryland Senior Care

Age 65+
General Maryland resident, at risk of nursing home placement.
Income Limits ~$2,000/month individual, varies by county
Asset Limits $11,000 individual
MD

Limited funding; waitlists common in high-demand areas.

Benefits
In-home care (3-5 hours/week) Respite care (up to 10 days/year) Meals (~$6/meal) Transportation (~5 trips/month) Case management

Maryland Nursing Home Medicaid

Maryland Medical Assistance (Medicaid) Nursing Home Program

Age 65+
General Maryland resident, Medicaid-eligible, requires nursing home-level care.
Income Limits (2025) $943/month (individual); most income applied to care costs.
Asset Limits $2,500 (individual), $3,000 (couple); spousal protections up to $155,356.
MD

Home equity limit $636,000; estate recovery applies post-55.

Benefits
24/7 nursing care Meals Therapy Medications (unlimited per medical need)

Senior Assisted Living Subsidy Program

Maryland Senior Assisted Living Group Home Subsidy

Age 62+
General Maryland resident, in or moving to approved assisted living, low/moderate income.
Income Limits (2025) ~$34,000/year individual, varies by county
Asset Limits Not strict; prioritizes low-income.
MD

Not available statewide; facility must be licensed by MDH.

Benefits
Personal care Meals 24-hour supervision (up to $1,500/month subsidy typical)

Veterans Aid and Attendance (A&A) Benefit

Maryland VA Aid and Attendance

Age
General Wartime veteran/spouse, age 65+ or disabled, needs ADL help, Maryland resident.
Income Limits (2025) Net income minus medical expenses < $1,984/month individual with A&A
Asset Limits $155,356 net worth limit
MD

High veteran population in suburban/rural areas.

Benefits
Cash benefit ($1,478-$2,471/month, varies by status) for care costs

Senior Prescription Drug Assistance Program (SPDAP)

Maryland Senior Prescription Drug Assistance Program

Age 65+
General Maryland resident (6+ months), Medicare Part D enrolled.
Income Limits (2025) $48,560/year individual, 300% FPL
Asset Limits None specified.
MD

Supplements Medicare Part D; annual enrollment required.

Benefits
Up to $40/month premium subsidy Reducing drug costs

Medicare Savings Programs (MSP)

Maryland Medicare Savings Programs

Age 65+
General Maryland resident, Medicare Part A/B enrollee.
Income Limits (2025) $2,014/month (QMB), $2,706/month (SLMB/QI, individual).
Asset Limits $9,090 (individual), $13,630 (couple).
MD

Includes QMB, SLMB, QI categories.

Benefits
Covers premiums (up to $174.70/month Part B) Co-pays Deductibles

Community Personal Assistance Services (CPAS)

Maryland Medicaid Community Personal Assistance Services

Age 65+
General Maryland resident, Medicaid-eligible, needs ADL assistance.
Income Limits (2025) $943/month (individual); spend-down available.
Asset Limits $2,500 (individual), $3,000 (couple).
MD

Consumer-directed option allows hiring family caregivers.

Benefits
Personal care (hours vary, typically 20-30/week) Chores Nurse supervision

Places of interest near Maplewood Park Place

Address 2.6 miles from city center Info Estimated distance in miles from Bethesda's city center to Maplewood Park Place's address, calculated via Google Maps. — 1.18 miles to nearest hospital (Suburban Hospital)

Calculate Travel Distance to Maplewood Park Place

Add your location

Address

Staffing Data (Q2 2025)

This data corresponds to Q2 2025 and is based on CMS Payroll-Based Journal.

Total staff 44
Employees 43
Contractors 1
Staff to resident ratio 4.40:1
143% better than Maryland average

Maryland average ratio: 1.81:1

Avg staff/day 16
Average shift 7.7 hours
0% compared with Maryland average

Maryland average: 8 hours

Total staff hours (quarter) 11,165
Nursing staff breakdown
Registered Nurse

Manages medical care and health needs.

Total count 8
Average shift length Info Average shift length. Calculated as total hours divided by days worked and average staff per day. 8.1 hours

No contractors work on this role.

Licensed Practical Nurse

Assists with medical care and medications.

Total count 4
Average shift length Info Average shift length. Calculated as total hours divided by days worked and average staff per day. 7.4 hours

No contractors work on this role.

Certified Nursing Assistant

Helps with daily care and mobility.

Total count 17
Average shift length Info Average shift length. Calculated as total hours divided by days worked and average staff per day. 7.7 hours

No contractors work on this role.

Contractor staffing

Total hours from contractors

0.1%

6 contractor hours this quarter

Occupational Therapy Assistant: 1
Staff by category
Certified Nursing Assistant170176,21091100%7.7
Registered Nurse8081,9628998%8.1
Licensed Practical Nurse4041,2078796%7.4
Nurse Practitioner1014725965%8
Administrator1014645864%8
Mental Health Service Worker2024455560%7.6
Medication Aide/Technician100103991112%7.7
Occupational Therapy Assistant011622%2.9
17 Certified Nursing Assistant
% of Days 100%
8 Registered Nurse
% of Days 98%
4 Licensed Practical Nurse
% of Days 96%
1 Nurse Practitioner
% of Days 65%
1 Administrator
% of Days 64%
2 Mental Health Service Worker
% of Days 60%
10 Medication Aide/Technician
% of Days 12%
1 Occupational Therapy Assistant
% of Days 2%

Facility Characteristics

Source: CMS Long-Term Care Facility Characteristics (Data as of Jan 2026)

Total residents 10
Private pay or other
10
100% of residents
Programs & Services
Residents Group

Residents meet regularly to discuss policies, care quality, and activities

CCRC

Part of a Continuing Care Retirement Community offering multiple care levels

Active Resident Council

Organized group of residents that meets regularly to discuss facility policies, quality of life, and activities.

Quality of care over time

These measures show how residents usually do over time at this home, based on health outcomes and preventive care.

High-risk clinical events score Info A composite score based on pressure ulcers, falls with injury, weight loss, walking ability decline, and activities of daily living decline. 6.2
52% better than Maryland average

Maryland average: 12.9

Functional decline score Info A composite score based on activities of daily living decline, walking ability decline, and incontinence. 24.8
In line with Maryland average

Maryland average: 25.7

Long-stay resident measures
Significantly above average Maryland avg: 3.7 Info CMS star rating based on long-stay quality measure performance. 5 stars = significantly above average, 1 star = significantly below average.
Need for Help with Daily Activities Increased Info Percent of long-stay residents whose need for help with daily activities has increased 16.7%
30% better than Maryland average

Maryland average: 23.7%

Low Risk Residents with Bowel/Bladder Incontinence Info Percent of low risk long-stay residents who lose control of their bowels or bladder 32.9%
27% worse than Maryland average

Maryland average: 25.9%

Falls with Major Injury Info Percent of long-stay residents experiencing one or more falls with major injury 0.0%
100% better than Maryland average

Maryland average: 2.3%

High Risk Residents with Pressure Ulcers Info Percent of long-stay high risk residents with pressure ulcers 0.0%
100% better than Maryland average

Maryland average: 6.5%

Urinary Tract Infection Info Percent of long-stay residents with a urinary tract infection 0.0%
100% better than Maryland average

Maryland average: 1.6%

Lost Too Much Weight Info Percent of long-stay residents who lose too much weight 8.1%
40% worse than Maryland average

Maryland average: 5.8%

Depressive Symptoms Info Percent of long-stay residents who have depressive symptoms 0.0%
100% better than Maryland average

Maryland average: 20.2%

Antipsychotic Use Info Percent of long-stay residents who received an antipsychotic medication 39.0%
202% worse than Maryland average

Maryland average: 12.9%

Pneumococcal Vaccine Info Percent of long-stay residents assessed and appropriately given the pneumococcal vaccine 100.0%
9% better than Maryland average

Maryland average: 92.0%

Short-stay resident measures
Significantly above average Maryland avg: 3.7 Info CMS star rating based on short-stay quality measure performance. 5 stars = much above average, 1 star = much below average.
Pneumococcal Vaccine Info Percent of short-stay residents assessed and appropriately given the pneumococcal vaccine 99.2%
26% better than Maryland average

Maryland average: 78.4%

Antipsychotic medication increase Info Percent of short-stay residents who newly received an antipsychotic medication 0.0%
100% better than Maryland average

Maryland average: 1.4%

Influenza Vaccine Info Percent of short-stay residents assessed and appropriately given the seasonal influenza vaccine 100.0%
24% better than Maryland average

Maryland average: 80.6%

Re-hospitalized after SNF stay Info Percentage of short-stay residents who were re-hospitalized after their nursing home admission. 33.7%
59% worse than Maryland average

Maryland average: 21.2%

Emergency department visits Info Percentage of short-stay residents who had an outpatient emergency department visit. 3.4%
66% better than Maryland average

Maryland average: 9.9%

Falls with major injury Info Percentage of SNF residents who experience falls with major injury during their stay. 0.0%
100% better than Maryland average

Maryland average: 0.8%

Ability to care for self at discharge Info Percentage of residents at or above expected ability to care for themselves at discharge. 42.9%
20% worse than Maryland average

Maryland average: 53.7%

Successful return to home or community Info Rate of successful return to home or community from a skilled nursing facility. 65.0%
28% better than Maryland average

Maryland average: 50.6%

Penalties and fines

Federal penalties imposed by CMS for regulatory violations, including civil money penalties (fines) and denials of payment for new Medicare/Medicaid admissions.

Source: CMS Penalties Database

Penalty History

Penalties are imposed by CMS for violations of federal nursing home regulations.

No penalties in the past 3 years

No civil money penalties or payment denials were reported in the last 3 years.

Compare Assisted Living around Bethesda The information below is reported by the Maryland Department of Health, Office of Health Care Quality.

Filter by care type
Brighton Gardens of Friendship Heights
AL

Assisted Living A licensed, long-term care setting for seniors or individuals with disabilities who need help with daily activities — like bathing, dressing, and medication management — but not 24-hour skilled nursing. Offers housing, meals, and around-the-clock support while aiming to maximize resident independence.

MC

Memory Care Secured, specialized care for people living with Alzheimer's or dementia. Staff trained in cognitive impairment, with higher staff-to-resident ratios and an environment designed to reduce confusion and wandering risk.

Chevy Chase (Friendship Boulevard)154Yes 86 1 Bed / 2 Bed29
20%

Male Residents — State Benchmarked 20% of residents are male, compared to the Maryland average of 31%. This facility caters to a majority female resident pool (80% female), consistent with the broader assisted living trend where women significantly outnumber men.

80%

Female Residents — State Benchmarked 80% of residents are female, compared to the Maryland average of 69%. Women comprise the large majority, consistent with national assisted living demographics where women live longer and enter care facilities at higher rates.

96%

White Residents — State Benchmarked 96% of residents are reported as White, compared to the Maryland average of 81%. A higher White share than is typical for assisted living in Maryland in this dataset — compare with peer facilities for local context.

1%

African American Residents — State Benchmarked 1% of residents are reported as African American or Black, compared to the Maryland average of 12%. A lower African American share than is typical in Maryland; local markets still vary widely.

3%

Other Ethnicity Residents — State Benchmarked 3% of residents fall into categories other than White or African American (combined), compared to the Maryland average of 7%. This column aggregates Hispanic, Asian, multiracial, and any other labeled groups that are not classified as White or African American. Reported subgroups in this total: Asian (2%), Hispanic (1%).

3%

Residents Age 65–74 — State Benchmarked 3% of residents are 65–74, compared to the Maryland average of 12%. Fewer younger seniors suggests the resident population skews older, likely requiring higher acuity care and more hands-on support.

31%

Residents Age 75–84 — State Benchmarked 31% of residents are 75–84, compared to the Maryland average of 31%. This is the second most common age bracket in assisted living, representing residents with moderate care needs.

49%

Residents Age 85–94 — State Benchmarked 49% of residents are 85–94, compared to the Maryland average of 44%. A high concentration of very elderly residents signals a higher-acuity facility with experience caring for advanced age-related needs.

15%

Residents Age 95+ — State Benchmarked 15% of residents are 95 or older, compared to the Maryland average of 16%. In line with the statewide profile for the oldest resident bracket.

Sunrise of Bethesda
AL

Assisted Living A licensed, long-term care setting for seniors or individuals with disabilities who need help with daily activities — like bathing, dressing, and medication management — but not 24-hour skilled nursing. Offers housing, meals, and around-the-clock support while aiming to maximize resident independence.

MC

Memory Care Secured, specialized care for people living with Alzheimer's or dementia. Staff trained in cognitive impairment, with higher staff-to-resident ratios and an environment designed to reduce confusion and wandering risk.

Bethesda (Battery Lane)108Yes 90 1 Bed / 2 Bed8
29%

Male Residents — State Benchmarked 29% of residents are male, compared to the Maryland average of 31%. This facility caters to a majority female resident pool (71% female), consistent with the broader assisted living trend where women significantly outnumber men.

71%

Female Residents — State Benchmarked 71% of residents are female, compared to the Maryland average of 69%. Women comprise the large majority, consistent with national assisted living demographics where women live longer and enter care facilities at higher rates.

79%

White Residents — State Benchmarked 79% of residents are reported as White, compared to the Maryland average of 81%. Close to the average for this category among assisted living facilities in Maryland with reported race/ethnicity data.

6%

African American Residents — State Benchmarked 6% of residents are reported as African American or Black, compared to the Maryland average of 12%. In line with the Maryland average for African American residents among facilities reporting this breakdown.

15%

Other Ethnicity Residents — State Benchmarked 15% of residents fall into categories other than White or African American (combined), compared to the Maryland average of 7%. This column aggregates Hispanic, Asian, multiracial, and any other labeled groups that are not classified as White or African American. Reported subgroups in this total: Other (8%), Asian (4%), Hispanic (2%), Mixed Race (2%).

6%

Residents Age 65–74 — State Benchmarked 6% of residents are 65–74, compared to the Maryland average of 12%. Fewer younger seniors suggests the resident population skews older, likely requiring higher acuity care and more hands-on support.

40%

Residents Age 75–84 — State Benchmarked 40% of residents are 75–84, compared to the Maryland average of 31%. A high concentration in this mid-range bracket, where residents typically need moderate support with daily activities.

44%

Residents Age 85–94 — State Benchmarked 44% of residents are 85–94, compared to the Maryland average of 44%. This is typically the most common age bracket in assisted living — this facility is in line with the statewide norm.

8%

Residents Age 95+ — State Benchmarked 8% of residents are 95 or older, compared to the Maryland average of 16%. Most residents here have not yet reached the oldest-old bracket, suggesting a younger overall community.

Sunrise at Fox Hill
AL

Assisted Living A licensed, long-term care setting for seniors or individuals with disabilities who need help with daily activities — like bathing, dressing, and medication management — but not 24-hour skilled nursing. Offers housing, meals, and around-the-clock support while aiming to maximize resident independence.

HC

Home Care Professional care delivered in the person's own home — from companionship and errands to skilled nursing and therapy. Allows seniors to age in place. Medicare covers skilled home health when medically necessary.

MC

Memory Care Secured, specialized care for people living with Alzheimer's or dementia. Staff trained in cognitive impairment, with higher staff-to-resident ratios and an environment designed to reduce confusion and wandering risk.

Bethesda (Burdette Road)105Yes 16 1 Bed / 2 Bed17
45%

Male Residents — State Benchmarked 45% of residents are male, compared to the Maryland average of 31%. A relatively balanced gender mix for assisted living, where facilities typically skew heavily female.

55%

Female Residents — State Benchmarked 55% of residents are female, compared to the Maryland average of 69%. Closer to an even gender split than most assisted living facilities, which typically have 65–75% female residents.

81%

White Residents — State Benchmarked 81% of residents are reported as White, compared to the Maryland average of 81%. Close to the average for this category among assisted living facilities in Maryland with reported race/ethnicity data.

0%

African American Residents — State Benchmarked 0% of residents are reported as African American or Black, compared to the Maryland average of 12%. A lower African American share than is typical in Maryland; local markets still vary widely.

19%

Other Ethnicity Residents — State Benchmarked 19% of residents fall into categories other than White or African American (combined), compared to the Maryland average of 7%. This column aggregates Hispanic, Asian, multiracial, and any other labeled groups that are not classified as White or African American. Reported subgroups in this total: Asian (6%), Mixed Race (6%), Hawaiian/Pacific Islander (4%), Hispanic (4%).

6%

Residents Age 65–74 — State Benchmarked 6% of residents are 65–74, compared to the Maryland average of 12%. Fewer younger seniors suggests the resident population skews older, likely requiring higher acuity care and more hands-on support.

23%

Residents Age 75–84 — State Benchmarked 23% of residents are 75–84, compared to the Maryland average of 31%. Below the state norm — the resident mix may skew either younger or older than this typical middle bracket.

58%

Residents Age 85–94 — State Benchmarked 58% of residents are 85–94, compared to the Maryland average of 44%. A high concentration of very elderly residents signals a higher-acuity facility with experience caring for advanced age-related needs.

11%

Residents Age 95+ — State Benchmarked 11% of residents are 95 or older, compared to the Maryland average of 16%. Most residents here have not yet reached the oldest-old bracket, suggesting a younger overall community.

Maplewood Park Place
NH

Nursing Home Licensed facility providing 24/7 skilled nursing care for residents with complex, ongoing medical needs. Staffed by RNs, LPNs, and CNAs. Inspected and star-rated annually by CMS. Accepts Medicare (short-term rehab) and Medicaid (long-term care).

AL

Assisted Living A licensed, long-term care setting for seniors or individuals with disabilities who need help with daily activities — like bathing, dressing, and medication management — but not 24-hour skilled nursing. Offers housing, meals, and around-the-clock support while aiming to maximize resident independence.

IL

Independent Living Lifestyle-focused communities for older adults offering dining, activities, and transportation with minimal personal care. Best for active, independent seniors who want community without medical support.

MC

Memory Care Secured, specialized care for people living with Alzheimer's or dementia. Staff trained in cognitive impairment, with higher staff-to-resident ratios and an environment designed to reduce confusion and wandering risk.

Bethesda (Pooks Hill)29Yes 38 1 Bed / 2 Bed30
18%

Male Residents — State Benchmarked 18% of residents are male, compared to the Maryland average of 31%. This facility caters to a majority female resident pool (82% female), consistent with the broader assisted living trend where women significantly outnumber men.

82%

Female Residents — State Benchmarked 82% of residents are female, compared to the Maryland average of 69%. Women comprise the large majority, consistent with national assisted living demographics where women live longer and enter care facilities at higher rates.

100%

White Residents — State Benchmarked 100% of residents are reported as White, compared to the Maryland average of 81%. A higher White share than is typical for assisted living in Maryland in this dataset — compare with peer facilities for local context.

0%

African American Residents — State Benchmarked 0% of residents are reported as African American or Black, compared to the Maryland average of 12%. A lower African American share than is typical in Maryland; local markets still vary widely.

0%

Other Ethnicity Residents — State Benchmarked 0% of residents fall into categories other than White or African American (combined), compared to the Maryland average of 7%. This column aggregates Hispanic, Asian, multiracial, and any other labeled groups that are not classified as White or African American.

-
6%

Residents Age 75–84 — State Benchmarked 6% of residents are 75–84, compared to the Maryland average of 31%. Below the state norm — the resident mix may skew either younger or older than this typical middle bracket.

24%

Residents Age 85–94 — State Benchmarked 24% of residents are 85–94, compared to the Maryland average of 44%. The population here skews younger than the statewide norm, which may indicate a more active, lower-acuity community.

71%

Residents Age 95+ — State Benchmarked 71% of residents are 95 or older, compared to the Maryland average of 16%. A high proportion of the oldest-old suggests strong end-of-life care experience and very-high-acuity capabilities.

The Reserve at Strathmore Square
AL

Assisted Living A licensed, long-term care setting for seniors or individuals with disabilities who need help with daily activities — like bathing, dressing, and medication management — but not 24-hour skilled nursing. Offers housing, meals, and around-the-clock support while aiming to maximize resident independence.

North Bethesda (Pooks Hill)-No 38 1 Bed / 2 Bed----------

Guides for Better Senior Living

Care Cost Calculator: See Prices in Your Area

Nursing Home Data Explorer

Don’t Wait Too Long: 7 Red Flag Signs Your Parent Needs Assisted Living Now

The True Cost of Assisted Living in 2025 – And How Families Are Paying For It

Understanding Senior Living Costs: Pricing Models, Discounts & Financial Assistance

More homes from the same operator

Operated bySunrise
Explore Open Rooms
1 Contact details
2 What type of senior care service are you looking for?
3 What budget do you have in mind for senior care?
4 How soon do you need to find care?
5 Additional details

Thank you for your interest!

Our team will be in touch shortly to help with next steps.