Explore Open Rooms

1 Contact details
2 What type of senior care service are you looking for?
3 What budget do you have in mind for senior care?
4 How soon do you need to find care?
5 Additional details

Thank you for your interest!

Our team will be in touch shortly to help with next steps.

Independent Living Home

St. Joseph of the Pines, a CCRC

Independent Living Home

St. Joseph of the Pines, a CCRC

103 Gossman Dr, Southern Pines, NC 28387 View map
Overview of St. Joseph of the Pines, a Ccrc

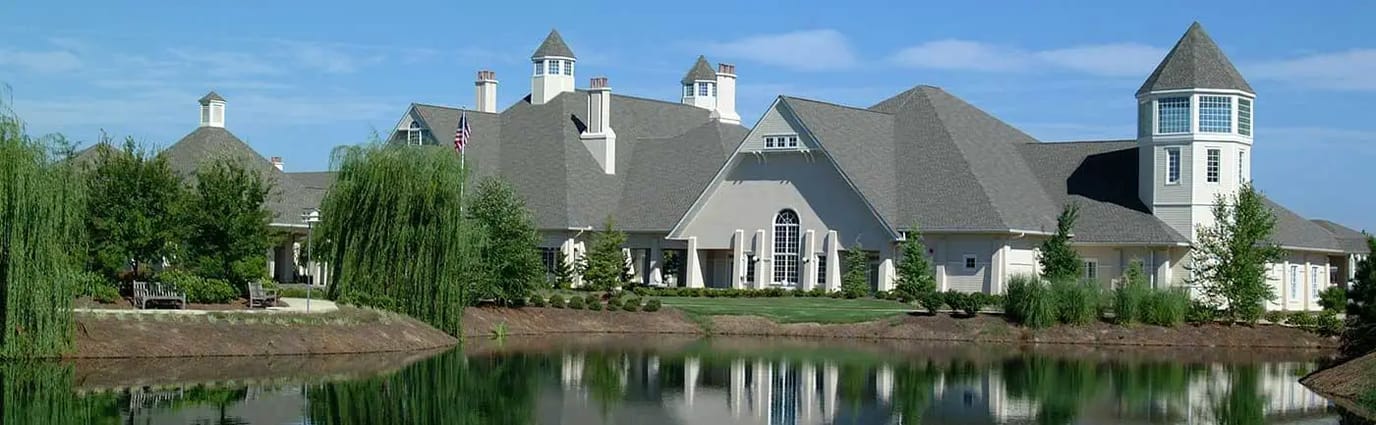
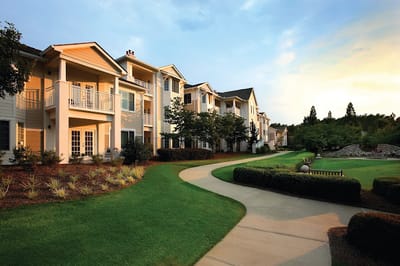
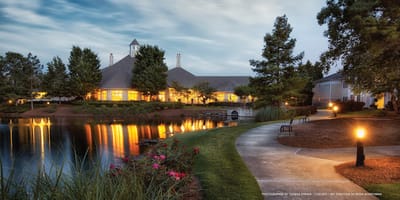
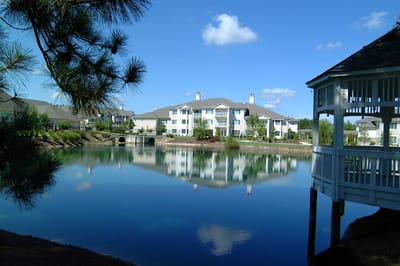
St. Joseph of the Pines by the Trinity Health community delivers quality service thoughtfully designed to offer both convenience and comfort in one setting. The continuing care retirement home specializes in independent living assisted living, and nursing care services. Reflected on their recognition by the U.S. News and World Report as the Best Nursing Homes for short-term rehabilitation, one can understand the home’s value. St. Joseph of the Pines continuously improves the lives of its residents by creating a cozy environment where an abundance of opportunities is available. 

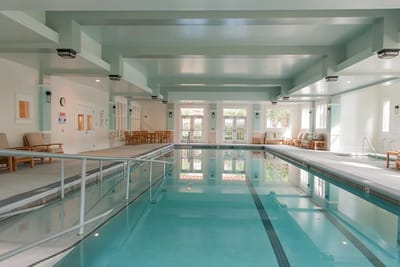
The lifestyle at St. Joseph’s practices a personalized care approach anchored by the trusted bond between residents and staff; personal care services include ADLs, 24-hour care and nursing, medication administration, engaging programs, and on-site therapy services– speech, physical, and occupational. 

Quality ratings

Measured by Centers for Medicare & Medicaid Services (CMS)

Overall rating Info The Overall CMS Rating combines results from health inspections, staffing levels and quality measures. Health inspections carry the most weight. Staffing and quality scores can increase or decrease the final rating based on performance compared to state and national standards.
4/5
North Carolina average: 3.5/5
Health Inspection Info Based on the results of the facility's three most recent standard inspections and any complaint investigations. CMS reviews the number, scope, and severity of deficiencies, with more recent findings weighted more heavily.
4/5
North Carolina average: 3.4/5
Staffing Info Measures average nursing staff hours per resident per day, including Registered Nurses (RNs) and total nursing staff. Ratings are adjusted based on the level of care residents require and are compared to state and national benchmarks.
4/5
North Carolina average: 3.3/5
Quality Measures Info Based on clinical and physical health indicators reported to CMS, such as hospital readmissions, falls, pressure ulcers, and improvements in mobility. These measures reflect how well residents' health needs are being managed.
4/5
North Carolina average: 3.7/5

Nursing care per resident

Info This shows how many total hours of nursing staff time are available per resident each day. Higher numbers usually mean more staff support.
4h 30m per day

This home provides 9% less nursing time per resident than the North Carolina average.

North Carolina average: 4h 57m per day

Capacity and availability

Medium-capacity home

Offers a balance of services and community atmosphere.

Total beds 176

This home usually has availability

Lower occupancy suggests more openings may be available.

Lower demand than the North Carolina average
Occupancy rate 40.2%
Residents per day (avg) 70
Occupancy rate
40.2%
Residents per day (avg)
70

Who this home usually serves

TYPE OF STAY

Mix of rehab and long-term care

This home supports both short-term rehab and long-term care, with residents staying for a wide range of durations.

Breakdown by payment type

Medicare

49% of new residents, usually for short-term rehab.

Typical stay 28 days

Private pay

51% of new residents, often for short stays.

Typical stay 1 - 2 months

Finances and operations

Voluntary non-profit community
Operated by a church.
Home revenue
$41.2M
Surplus of revenue
$1.3M
Voluntary non-profit community Operated by a church.
Home revenue
$41,186,524.00
Surplus of revenue
$1,298,003.00
Payroll costs Info The portion of the home's budget spent on staff, including nurses, caregivers, and other employees who support care and operations.
$12.5M
30.5% of revenue
Other operating costs Info All remaining costs needed to run the home, such as food, utilities, building maintenance, supplies and administrative expenses.
$27.3M
Total costs $39.9M
Walk Score
Walk Score: 2 / 100
Car-dependent. Most errands require a car, with limited nearby walkable options.
BBB Rating
BBB Rating: A+ (Not Accredited)
An independent rating from the Better Business Bureau based on factors such as complaint history, transparency, and business practices.
How BBB ratings work

Additional licensing details

CMS Certification Number: 345044

Staffing

Key information about the people who lead and staff this community.

Leadership

Contact: Ms. Phyllis Jones, Owner

What does this home offer?

Pets allowed icon
Pets allowed icon

Pets Allowed: Yes, Pets Allowed

Housing options icon

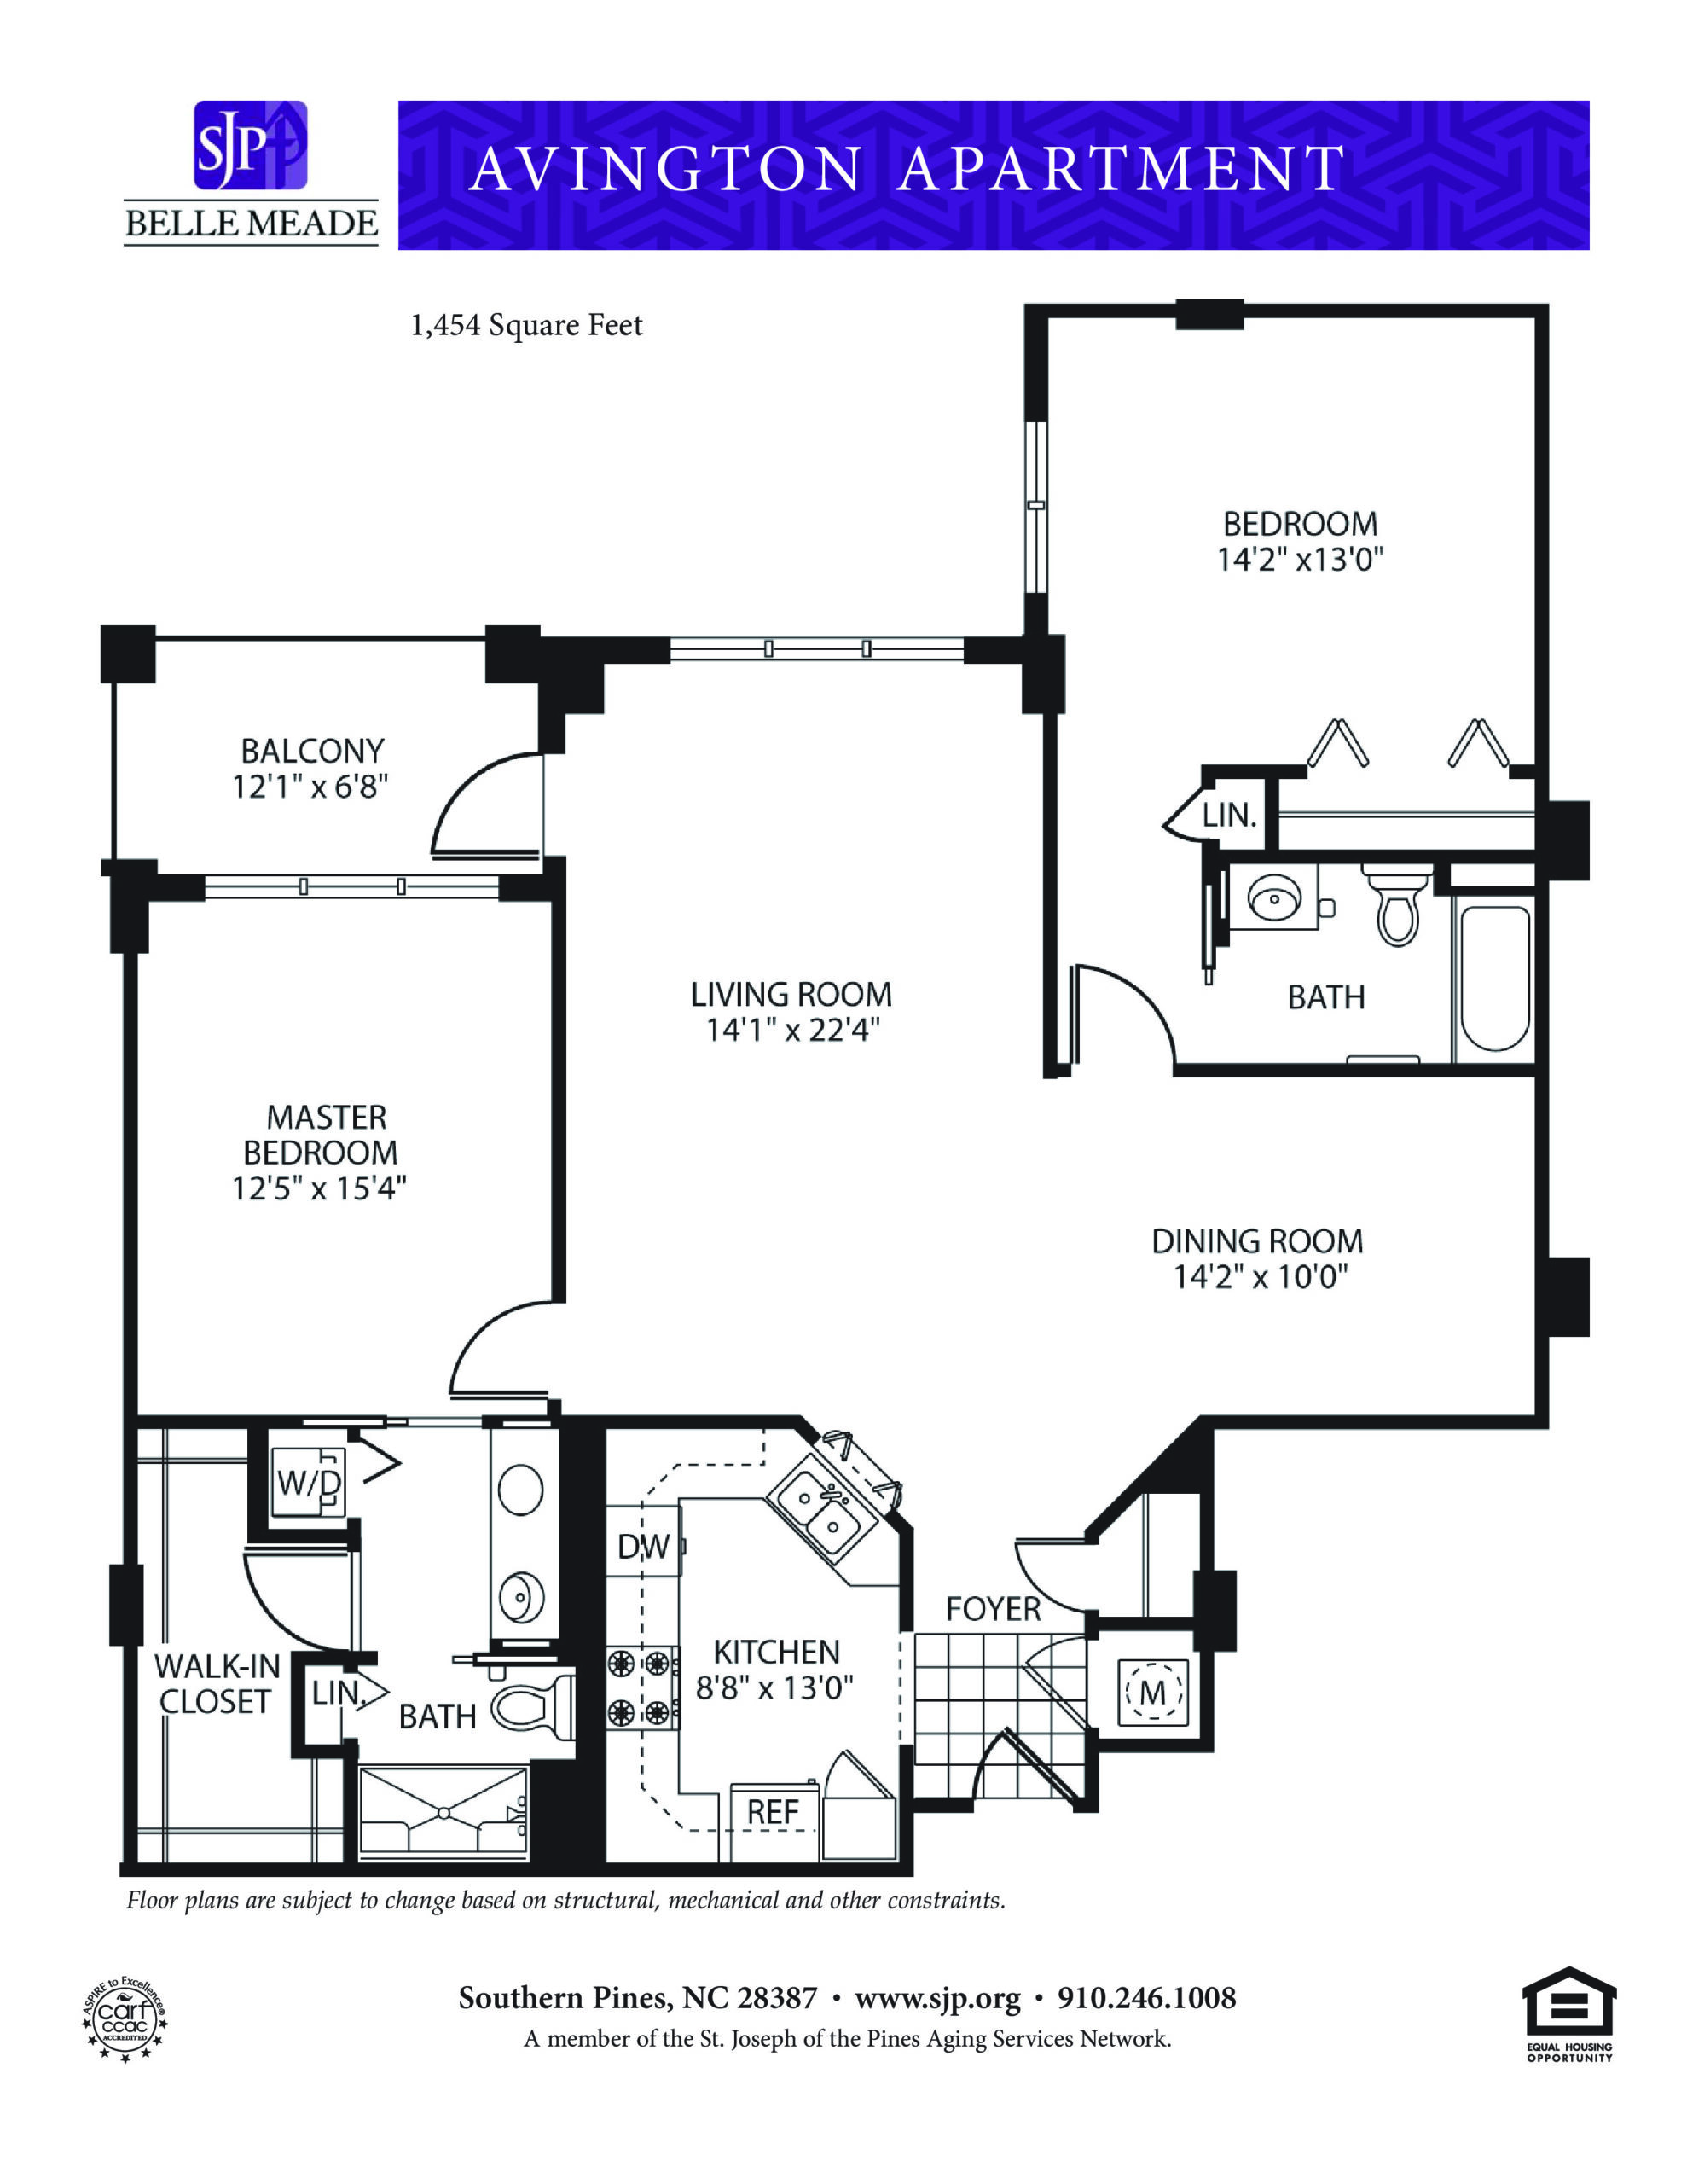
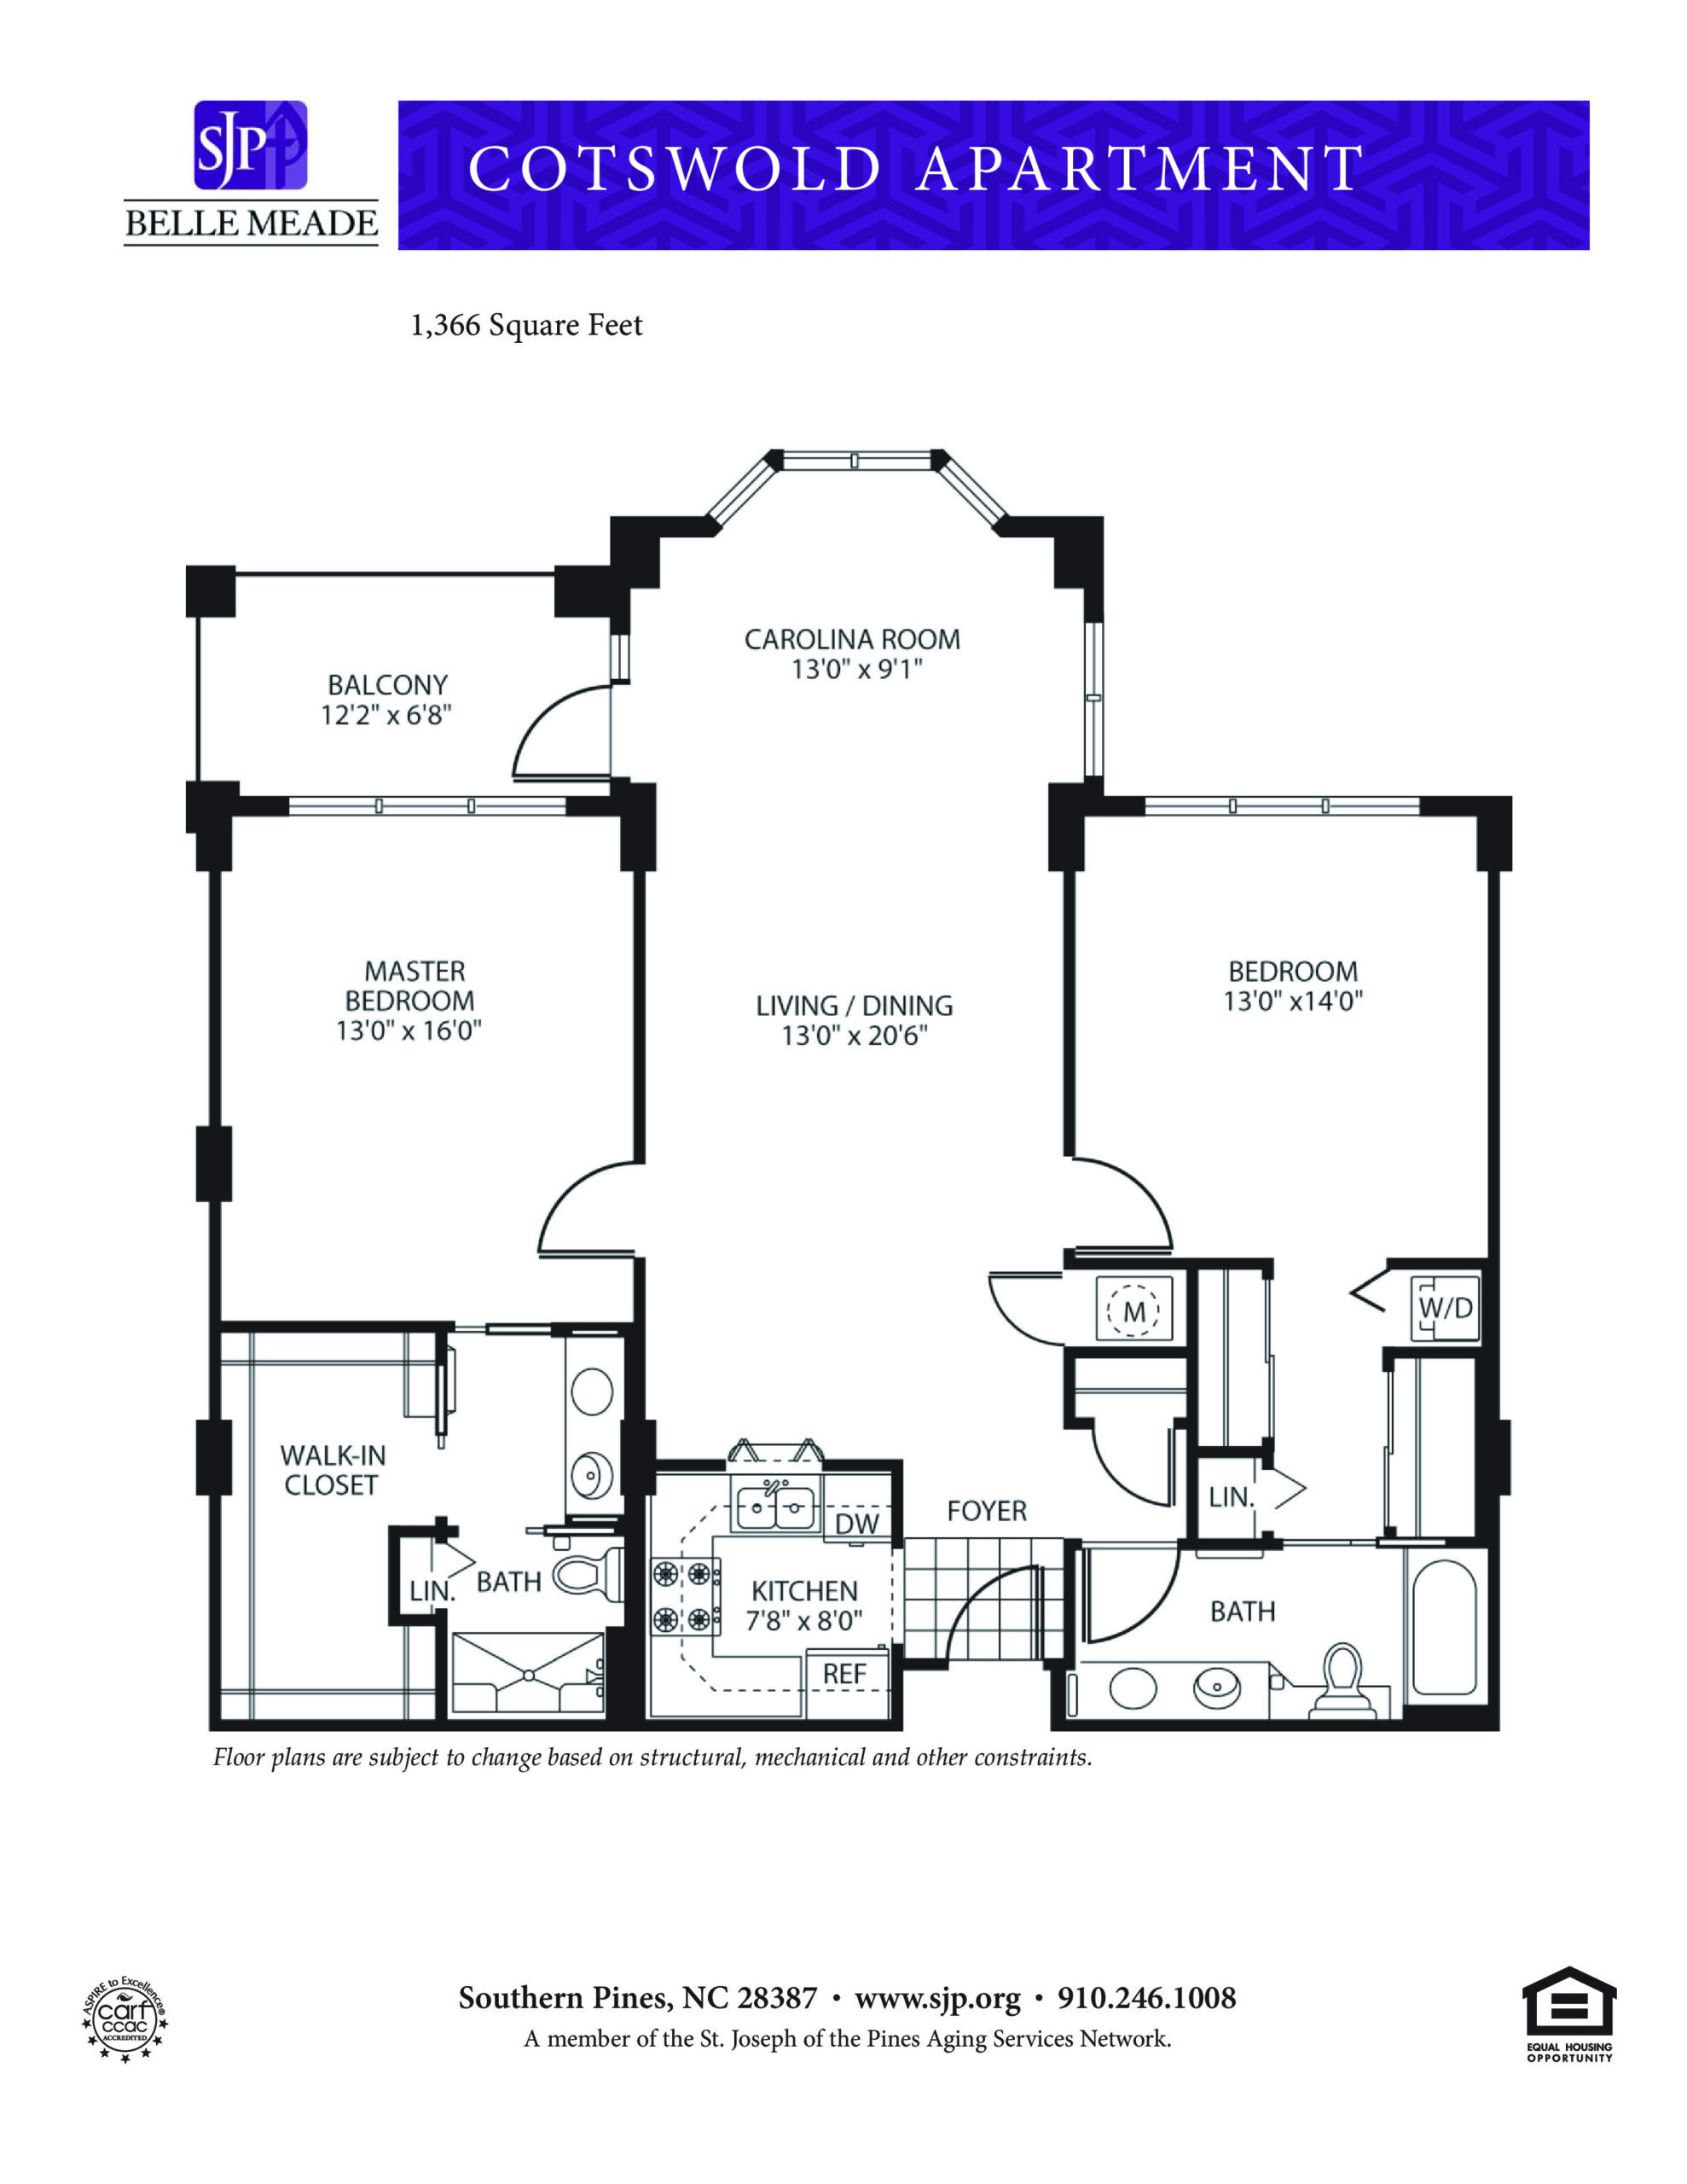
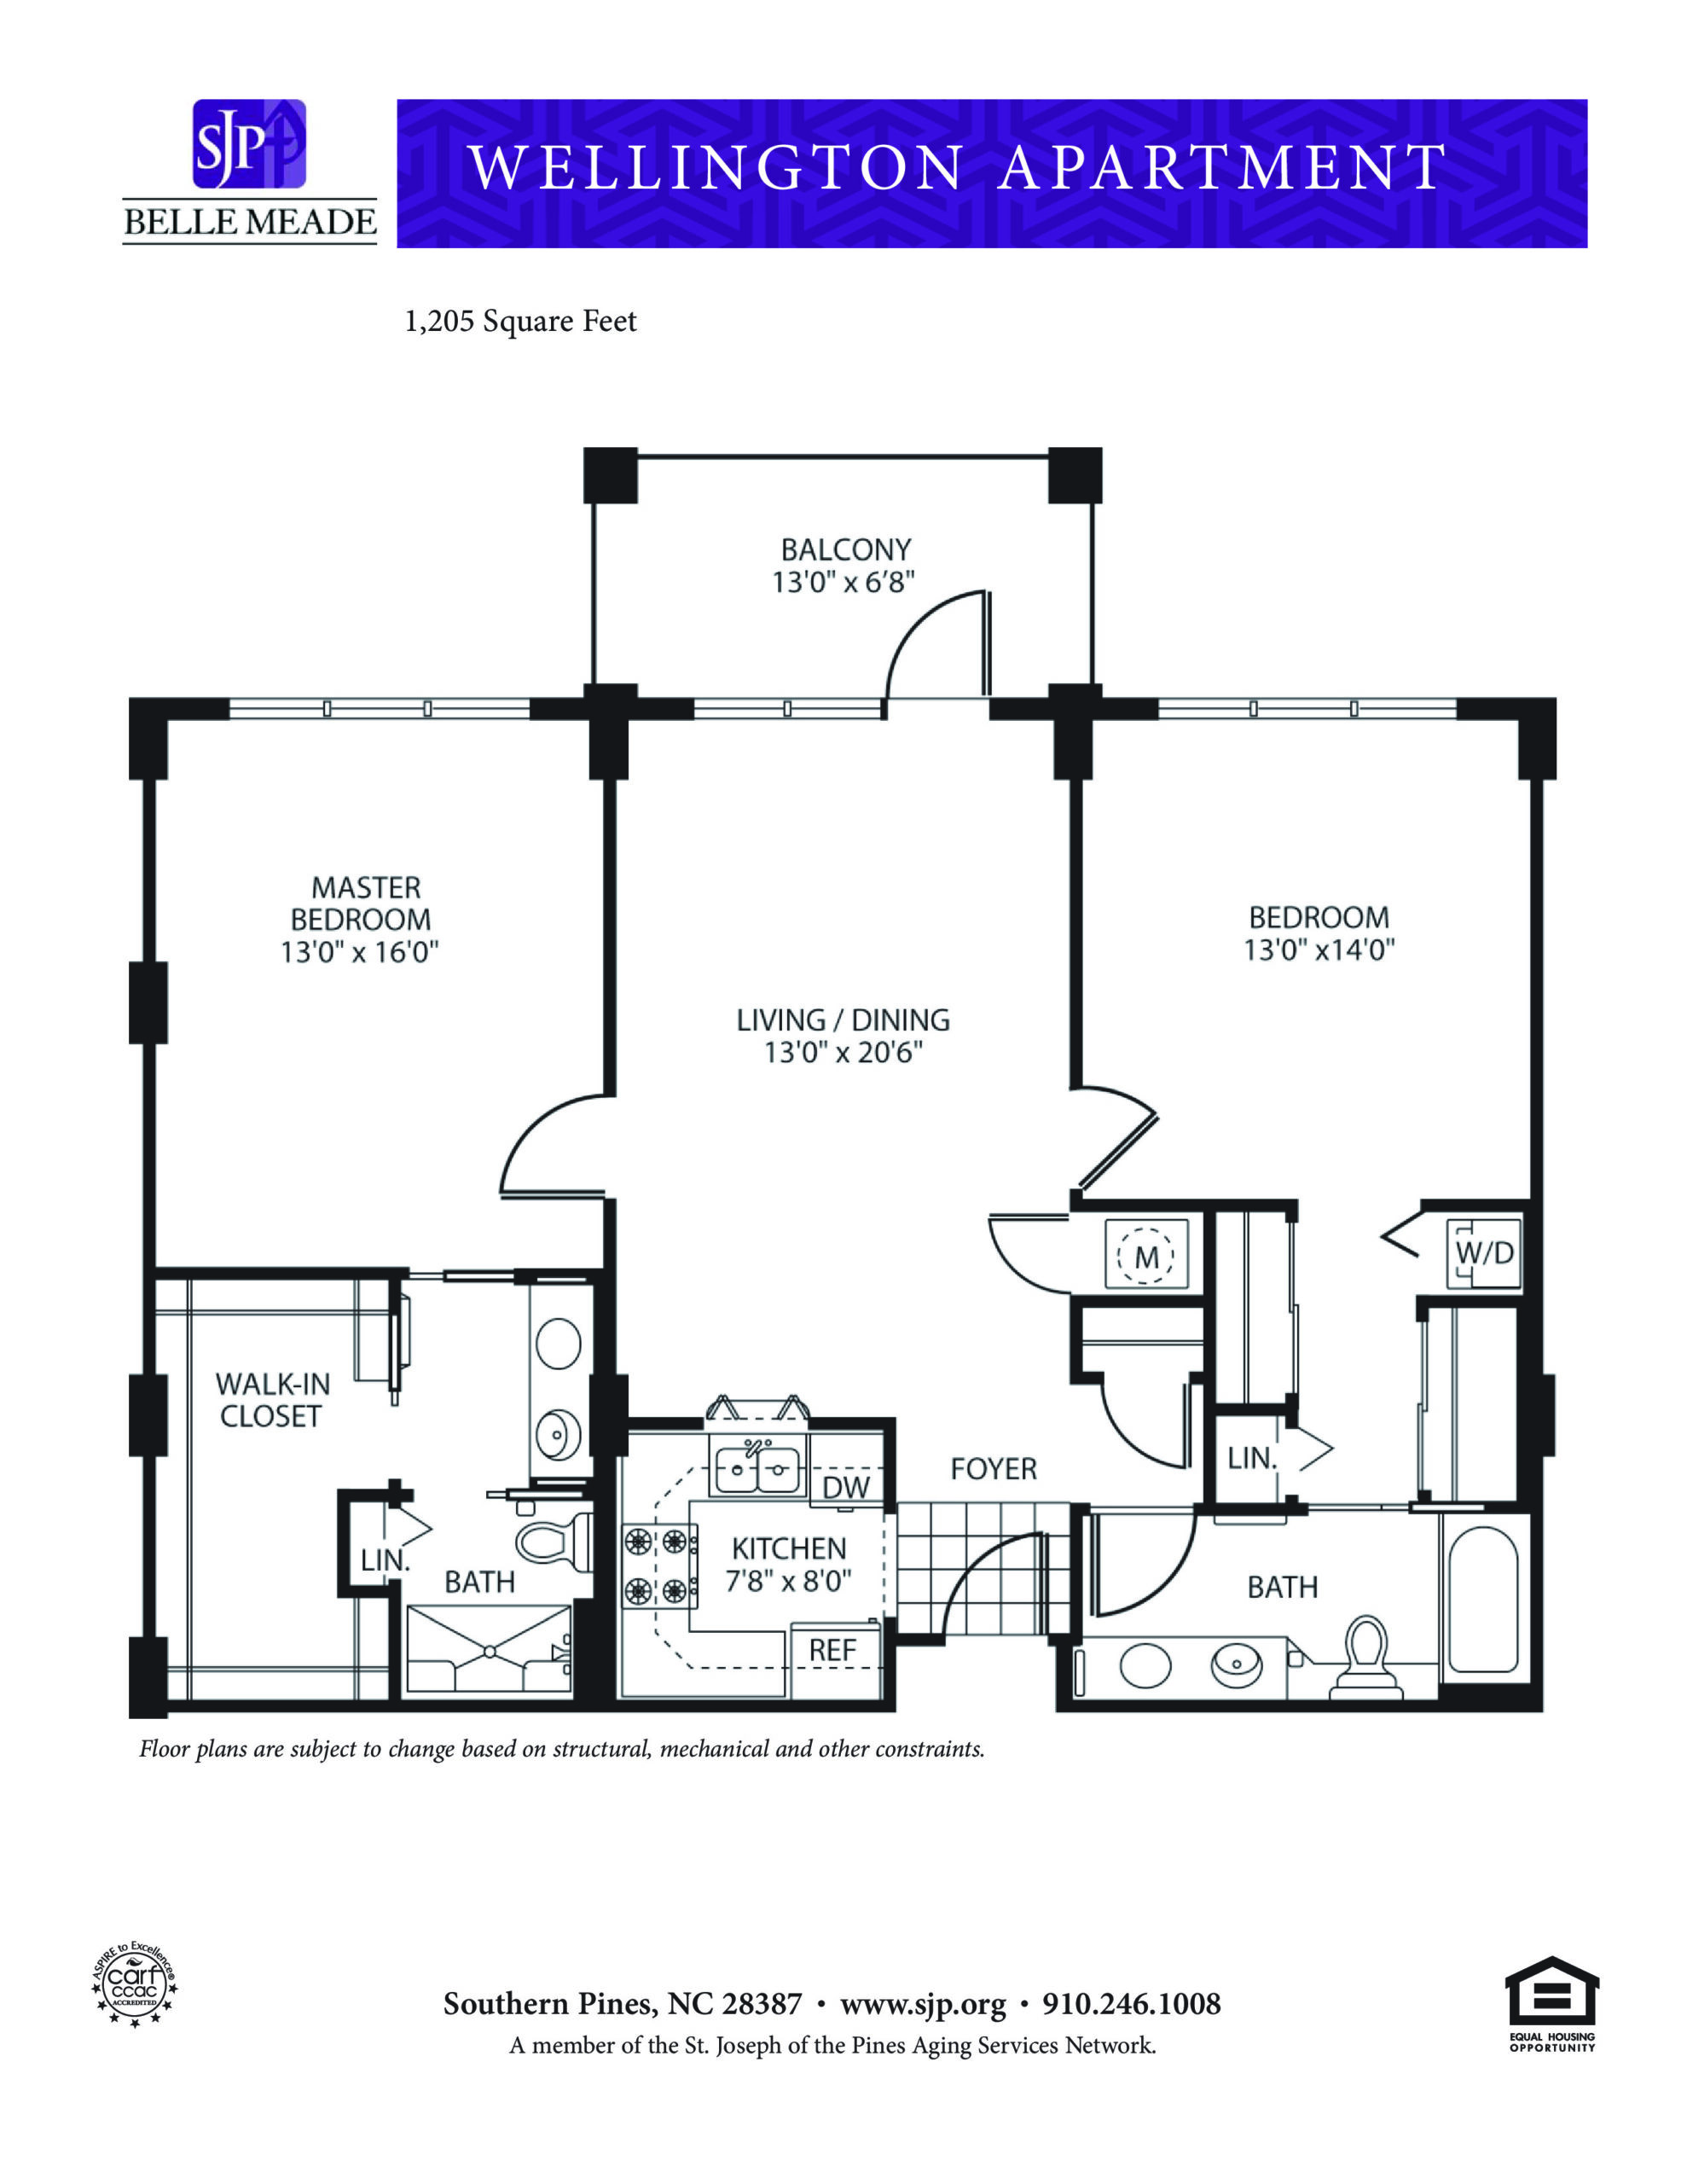
Housing Options: Private Rooms

Building type icon
Building type icon

Building Type: Two-story

Transportation services icon

Transportation Services

Fitness and recreation icon

Fitness and Recreation

Types of Care at St. Joseph of the Pines, a CCRC

Independent Living Nursing Home
Contact St. Joseph of the Pines, a CCRC

Health Inspection History

Inspections
Total health inspections 3

North Carolina average 4


Last Health inspection on Jul 2025

Total health citations 7

North Carolina average 20.9

Citations per inspection
2.33

North Carolina average 4.99


Health citations are formal notices following inspections when they fail to comply with safety and care standards.

5 of 7 citations resulted from standard inspections; and 2 of 7 came from combined inspections (standard and complaint).

Breakdown of citation severity (last 3 years)
Critical Health citations More info 0
100% better than North Carolina average

North Carolina average: 1.3


Serious Health citations More info 0
100% better than North Carolina average

North Carolina average: 0.9

0 critical citations More info North Carolina average: 1.3

0 serious citations More info North Carolina average: 0.9

5 moderate citations More info North Carolina average: 17.1

2 minor citations More info North Carolina average: 1.6
Citations history (last 3 years)
Quality of Care moderate citation Info Issues related to how well residents receive appropriate treatment and support for their medical and daily care needs. Jul 31, 2025
Corrected

Care Planning minor citation Info Issues related to creating and updating personalized care plans for residents based on their needs and conditions. Jul 31, 2025
Corrected

Abuse/Neglect moderate citation Info Issues related to protecting resident's from harm, including abuse, neglect, or mistreatment. Jul 11, 2024
Corrected

Nursing Services minor citation Info Issues related to the availability and quality of nursing staff and the care they provide. Jul 11, 2024
Corrected

Compare Independent Living around Fayetteville The information below is reported by the North Carolina Department of Health and Human Services, Division of Health Service Regulation.

St. Joseph of the Pines, a CCRC
NH

Nursing Home Licensed facility providing 24/7 skilled nursing care for residents with complex, ongoing medical needs. Staffed by RNs, LPNs, and CNAs. Inspected and star-rated annually by CMS. Accepts Medicare (short-term rehab) and Medicaid (long-term care).

AL

Assisted Living A licensed, long-term care setting for seniors or individuals with disabilities who need help with daily activities — like bathing, dressing, and medication management — but not 24-hour skilled nursing. Offers housing, meals, and around-the-clock support while aiming to maximize resident independence.

IL

Independent Living Lifestyle-focused communities for older adults offering dining, activities, and transportation with minimal personal care. Best for active, independent seniors who want community without medical support.

Southern Pines
176
A+
2
40.2%
-
-
-
-
Private Rooms
Cambridge Village of Apex
AL

Assisted Living A licensed, long-term care setting for seniors or individuals with disabilities who need help with daily activities — like bathing, dressing, and medication management — but not 24-hour skilled nursing. Offers housing, meals, and around-the-clock support while aiming to maximize resident independence.

IL

Independent Living Lifestyle-focused communities for older adults offering dining, activities, and transportation with minimal personal care. Best for active, independent seniors who want community without medical support.

Apex
-
A+
36
-
-
-
-
-
Private Rooms
The Carolina Highlands at Village Green
IL

Independent Living Lifestyle-focused communities for older adults offering dining, activities, and transportation with minimal personal care. Best for active, independent seniors who want community without medical support.

Fayetteville (Terry Sanford)
-
-
45
-
-
-
-
-
Private Rooms

Living Spaces & Floor Plans

St Joseph Of The Pines A Ccrc 3 2
St Joseph Of The Pines A 1
St Joseph Of The Pines A Ccrc 4
St Joseph Of The Pines A Ccrc 5
St Joseph Of The Pines A Ccrc 4 2

Places of interest near St. Joseph of the Pines, a CCRC

Address 37.8 miles from city center — 4.41 miles to nearest hospital (Spectrum Eye Center)

Address 103 Gossman Dr, Southern Pines, NC 28387

Calculate Travel Distance to St. Joseph of the Pines, a CCRC

Add your location

Address

Staffing Data (Q2 2025)

This data corresponds to Q2 2025 and is based on CMS Payroll-Based Journal.

Total staff 118
Employees 94
Contractors 24
Staff to resident ratio 1.82:1
0% compared with North Carolina average

North Carolina average ratio: 1.85:1

Avg staff/day 46
Average shift 8.4 hours
5% better than North Carolina average

North Carolina average: 8 hours

Total staff hours (quarter) 34,996
Nursing staff breakdown
Registered Nurse

Manages medical care and health needs.

Total count 7
Average shift length Info Average shift length. Calculated as total hours divided by days worked and average staff per day. 10.8 hours

No contractors work on this role.

Licensed Practical Nurse

Assists with medical care and medications.

Total count 25
Average shift length Info Average shift length. Calculated as total hours divided by days worked and average staff per day. 9.4 hours

This role is partially covered by contractors.

Certified Nursing Assistant

Helps with daily care and mobility.

Total count 53
Average shift length Info Average shift length. Calculated as total hours divided by days worked and average staff per day. 9 hours

No contractors work on this role.

Contractor staffing

Total hours from contractors

15.3%

5,347 contractor hours this quarter

Speech Language Pathologist: 7 Physical Therapy Assistant: 4 Respiratory Therapy Technician: 3 Licensed Practical Nurse: 3 Physical Therapy Aide: 2 Occupational Therapy Aide: 2 Qualified Social Worker: 2 Occupational Therapy Assistant: 1
Staff by category
Certified Nursing Assistant5305316,24291100%9
Licensed Practical Nurse223256,63991100%9.4
Clinical Nurse Specialist5052,4486673%8
Registered Nurse7072,1438492%10.8
Speech Language Pathologist0771,8628290%5.6
Respiratory Therapy Technician0338628088%5.3
Other Dietary Services Staff2027336167%7.7
Physical Therapy Assistant0445926571%6.9
Physical Therapy Aide0225565560%6.7
Occupational Therapy Aide0225225459%9.7
Medication Aide/Technician2025174347%9.9
Administrator1014886167%8
Mental Health Service Worker1014806066%8
Nurse Practitioner1014595864%7.9
Qualified Social Worker0224086470%6.4
Occupational Therapy Assistant011454347%1
53 Certified Nursing Assistant
% of Days 100%
25 Licensed Practical Nurse
% of Days 100%
5 Clinical Nurse Specialist
% of Days 73%
7 Registered Nurse
% of Days 92%
7 Speech Language Pathologist
% of Days 90%
3 Respiratory Therapy Technician
% of Days 88%
2 Other Dietary Services Staff
% of Days 67%
4 Physical Therapy Assistant
% of Days 71%
2 Physical Therapy Aide
% of Days 60%
2 Occupational Therapy Aide
% of Days 59%
2 Medication Aide/Technician
% of Days 47%
1 Administrator
% of Days 67%
1 Mental Health Service Worker
% of Days 66%
1 Nurse Practitioner
% of Days 64%
2 Qualified Social Worker
% of Days 70%
1 Occupational Therapy Assistant
% of Days 47%

Facility Characteristics

Source: CMS Long-Term Care Facility Characteristics (Data as of Jan 2026)

Total census
65 residents
Residents by payment source
Medicare
25 residents (38.5%)
Medicaid
15 residents (23.1%)
Private pay or other
25 residents (38.5%)
Programs & Services
Residents' Group

Residents meet regularly to discuss policies, care quality, and activities

CCRC

Part of a Continuing Care Retirement Community offering multiple care levels

Active Resident Council

Organized group of residents that meets regularly to discuss facility policies, quality of life, and activities.

Quality of care over time

These measures show how residents usually do over time at this home, based on health outcomes and preventive care.

High-risk clinical events score Info A composite score based on pressure ulcers, falls with injury, weight loss, walking ability decline, and activities of daily living decline. 6.3
45% better than North Carolina average

North Carolina average: 11.5

Functional decline score Info A composite score based on activities of daily living decline, walking ability decline, and incontinence. 17.1
17% better than North Carolina average

North Carolina average: 20.6

Long-stay resident measures
Need for Help with Daily Activities Increased Info Percent of long-stay residents whose need for help with daily activities has increased 10.0%
43% better than North Carolina average

North Carolina average: 17.5%

Low Risk Residents with Bowel/Bladder Incontinence Info Percent of low risk long-stay residents who lose control of their bowels or bladder 24.2%
13% worse than North Carolina average

North Carolina average: 21.4%

Falls with Major Injury Info Percent of long-stay residents experiencing one or more falls with major injury 3.2%
12% better than North Carolina average

North Carolina average: 3.6%

High Risk Residents with Pressure Ulcers Info Percent of long-stay high risk residents with pressure ulcers 3.0%
52% better than North Carolina average

North Carolina average: 6.3%

Urinary Tract Infection Info Percent of long-stay residents with a urinary tract infection 1.3%
51% better than North Carolina average

North Carolina average: 2.6%

Lost Too Much Weight Info Percent of long-stay residents who lose too much weight 8.9%
21% worse than North Carolina average

North Carolina average: 7.4%

Depressive Symptoms Info Percent of long-stay residents who have depressive symptoms 0.0%
100% better than North Carolina average

North Carolina average: 4.4%

Antipsychotic Use Info Percent of long-stay residents who received an antipsychotic medication 8.3%
38% better than North Carolina average

North Carolina average: 13.4%

Pneumococcal Vaccine Info Percent of long-stay residents assessed and appropriately given the pneumococcal vaccine 100.0%
9% better than North Carolina average

North Carolina average: 91.6%

Influenza Vaccine Info Percent of long-stay residents assessed and appropriately given the seasonal influenza vaccine 100.0%
6% better than North Carolina average

North Carolina average: 94.1%

Short-stay resident measures
Pneumococcal Vaccine Info Percent of short-stay residents assessed and appropriately given the pneumococcal vaccine 99.4%
24% better than North Carolina average

North Carolina average: 79.9%

Antipsychotic medication increase Info Percent of short-stay residents who newly received an antipsychotic medication 0.1%
91% better than North Carolina average

North Carolina average: 1.5%

Influenza Vaccine Info Percent of short-stay residents assessed and appropriately given the seasonal influenza vaccine 98.7%
26% better than North Carolina average

North Carolina average: 78.1%

Guides for Better Senior Living

Care Cost Calculator: See Prices in Your Area

Nursing Home Data Explorer

Don’t Wait Too Long: 7 Red Flag Signs Your Parent Needs Assisted Living Now

The True Cost of Assisted Living in 2025 – And How Families Are Paying For It

Understanding Senior Living Costs: Pricing Models, Discounts & Financial Assistance

Financial Aid for North Carolina Seniors

Get financial aid guidance

Community Alternatives Program for Disabled Adults

NC Medicaid CAP/DA

Age 65+ or disabled, North Carolina resident, Medicaid- eligible, nursing home-level care need.

~$2,829/month (300% FBR, individual).

$2,000 (individual), $3,000 (couple).

High demand; waitlists common in urban areas.

North Carolina Senior Care Options

NC SCO (via NFCSP)

Caregiver of someone 60+ (or with dementia), North Carolina resident.

No strict limit; prioritizes low-income.

Not applicable.

Limited slots; rural/urban balance.

Program of All-Inclusive Care for the Elderly (PACE)

North Carolina PACE (e.g., PACE of the Triad)

Age 55+, NC resident (specific counties), NFLOC, safe with PACE support.

~$2,829/month (Medicaid-eligible); private pay option available.

$2,000 (individual), $3,000 (couple) for Medicaid enrollees.

Available in 10+ counties (e.g., Guilford, Wake); multiple providers (e.g., PACE of the Southern Piedmont).

In-Home Aide Services

North Carolina In-Home Aide Services

Age 60+, NC resident, unable to perform 1+ ADL, at risk of nursing home placement.

No strict cap; prioritizes low-income (~$24,980/year).

Not assessed; need-based.

Family can be aides; varies by county funding.

Medicare Savings Program (MSP)

North Carolina Medicare Savings Program

Age 65+ or disabled, NC resident, Medicare Part A/B.

~$2,510/month (QMB), ~$3,380/month (SLMB), ~$3,598/month (QI)—individual.

$9,430 (individual), $14,130 (couple).

Three tiers; no waitlist; includes Extra Help for Part D.

Low-Income Energy Assistance Program (LIHEAP)

North Carolina LIHEAP

Age 60+ prioritized, NC resident, low-income household.

~$3,970/month (individual, 185% FPL).

Not assessed; income-focused.

Covers oil, gas, electric; emergency aid via Crisis Intervention Program (CIP).

Senior Community Service Employment Program (SCSEP)

North Carolina SCSEP

Age 55+, unemployed, low-income, NC resident.

~$1,983/month (125% FPL).

Not specified; income-focused.

Priority for veterans, rural residents; AARP partnership.

VA Aid and Attendance (A&A) and Housebound Benefits

North Carolina VA Aid and Attendance/Housebound

Age 65+ or disabled veteran/spouse, NC resident, wartime service, need for ADL help (A&A) or homebound.

Net income < ~$1,984/month (veteran with dependent, A&A); pension offsets income.

~$155,356 (net worth limit).

High veteran demand in rural/urban areas.

Urgent Repair Program (URP)

North Carolina Urgent Repair Program

Age 60+ prioritized, NC resident, homeowner, low-income.

~$30,258/year (50% AMI, varies by county).

Not strictly assessed; home value considered.

Forgivable at $2,000/year; statewide via local partners.

State/County Special Assistance (SA)

North Carolina Special Assistance

Age 65+ (or disabled), NC resident, in licensed adult care home, low-income.

~$1,255/month (individual, 100% FPL); varies by facility rate.

$2,000 (individual).

Covers assisted living; counties supplement state funds.