

Total health inspections
3
Minnesota average 6
Last Health inspection on Oct 2024

We arrange tours, appointments, and even moving support so you don’t have to
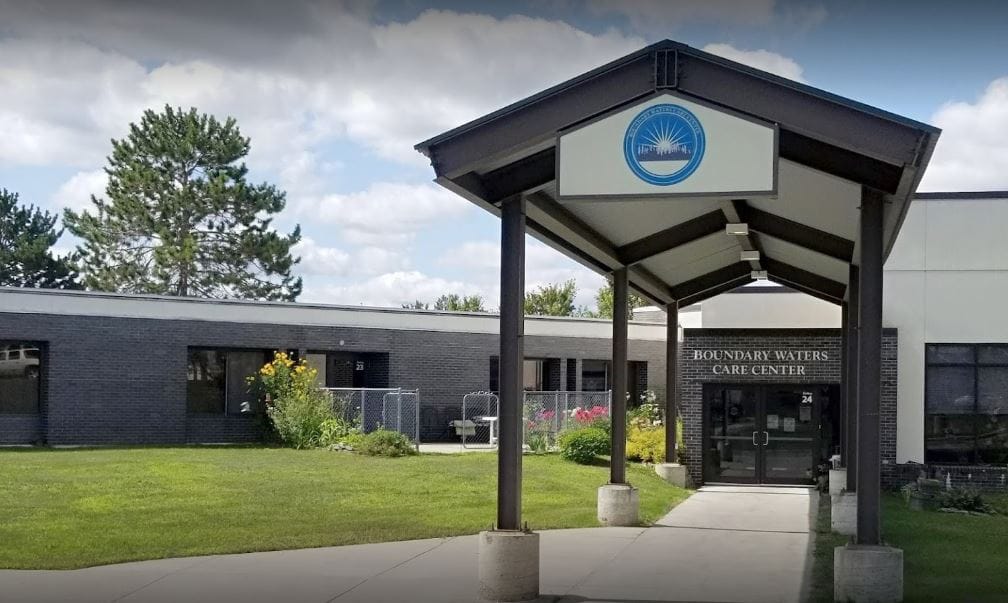
Boundary Waters Care Center (BWCC) is a vibrant nonprofit, 503(c)(3), skilled care and rehabilitative community in Ely, Minnesota where values-driven team members are focused on upholding the well-being, dignity, and individual capabilities of each resident. The community serves older adults and their families with short-term rehabilitation services and long-term care designed to ensure residents may safely lead a lifestyle with as much independence as
possible.
| Staff type | Hours / Day / Resident | vs state avg |
|---|---|---|
|
Registered Nurse (RN)
| 1h 16m per day | ▲ 18% State avg: 1h 4m per day · National avg: 41m per day |
|
LPN / LVN
| 24m per day | ▼ 35% State avg: 37m per day · National avg: 52m per day |
|
Nurse Aide
| 2h 41m per day | ▲ 5% State avg: 2h 33m per day · National avg: 2h 21m per day |
|
Weekend Total Nursing
| 3h 47m per day | ▲ 3% State avg: 3h 41m per day · National avg: 3h 26m per day |
|
Physical Therapist
| 3m per day | ▼ 27% State avg: 4m per day · National avg: 4m per day |
|
Weekend RN
| 44m per day | ▲ 7% State avg: 41m per day · National avg: 29m per day |
Key information about the people who lead and staff this community.
In Minnesota, the Department of Health, Health Regulation Division is the primary authority for conducting onsite inspections and reporting on the quality of care in residential facilities.
Deficiencies
| This Facility | MN Average | vs. MN Avg |
|---|---|---|---|
|
Total deficiencies
| 11 | 10 | This facility has 10% more total deficiencies than a typical Minnesota nursing home (11 vs. MN avg 10).↑ 10% worse |
|
Deficiencies per year
| 5.5 | 5 | This facility has 10% more deficiencies per year than a typical Minnesota nursing home (5.5 vs. MN avg 5).↑ 10% worse |
Minnesota average 6
Last Health inspection on Oct 2024
Minnesota average 23.2
Minnesota average 3.76
Health citations are formal notices following inspections when they fail to comply with safety and care standards.
All 21 citations resulted from standard inspections.
Minnesota average: 0.7
Minnesota average: 0.5
Reporting period: October 1 – December 31, 2025 (Q4 2025). Source: CMS Payroll-Based Journal report.
Manages medical care and health needs.
Assists with medical care and medications.
Helps with daily care and mobility.
Total hours from contractors
1,679 contractor hours this quarter
| Certified Nursing Assistant | 17 | 2 | 19 | 6,113 | 92 | 100% | 8.8 |
| Registered Nurse | 7 | 1 | 8 | 2,025 | 90 | 98% | 10.2 |
| Other Dietary Services Staff | 4 | 0 | 4 | 1,423 | 92 | 100% | 8.1 |
| Licensed Practical Nurse | 2 | 0 | 2 | 1,074 | 76 | 83% | 11.6 |
| Medication Aide/Technician | 2 | 0 | 2 | 963 | 75 | 82% | 9.9 |
| Clinical Nurse Specialist | 4 | 0 | 4 | 846 | 61 | 66% | 7.2 |
| Nurse Practitioner | 1 | 0 | 1 | 519 | 64 | 70% | 8.1 |
| Physical Therapy Aide | 1 | 0 | 1 | 474 | 61 | 66% | 7.8 |
| Dental Services Staff | 1 | 0 | 1 | 421 | 52 | 57% | 8.1 |
| Administrator | 1 | 0 | 1 | 392 | 49 | 53% | 8 |
| Respiratory Therapy Technician | 0 | 3 | 3 | 132 | 38 | 41% | 2.9 |
| Nurse Aide in Training | 2 | 0 | 2 | 111 | 15 | 16% | 7.4 |
| Speech Language Pathologist | 1 | 0 | 1 | 87 | 15 | 16% | 5.8 |
| Physical Therapy Assistant | 0 | 2 | 2 | 35 | 10 | 11% | 3.5 |
| Occupational Therapy Assistant | 0 | 1 | 1 | 20 | 14 | 15% | 1.5 |
| Occupational Therapy Aide | 0 | 1 | 1 | 17 | 4 | 4% | 4.1 |
| Medical Director | 0 | 1 | 1 | 2 | 1 | 1% | 1.5 |
Federal penalties imposed by CMS for regulatory violations, including civil money penalties (fines) and denials of payment for new Medicare/Medicaid admissions.
Source: CMS Penalties Database (Data as of Jan 2026)
Minnesota average: $44K
Minnesota average: 2.0
Minnesota average: 0.4
No penalties in the past 3 years
No civil money penalties or payment denials were reported in the last 3 years.
These measures show how residents usually do over time at this home, based on health outcomes and preventive care.
Minnesota average: 11.1
Minnesota average: 22.6
Minnesota average: 18.9%
Minnesota average: 23.8%
Minnesota average: 25.0%
Minnesota average: 3.7%
Minnesota average: 5.4%
Minnesota average: 2.7%
Minnesota average: 4.1%
Minnesota average: 4.4%
Minnesota average: 17.2%
Minnesota average: 97.3%
Minnesota average: 96.0%
Minnesota average: 88.9%
Minnesota average: 1.9%
Minnesota average: 82.6%
Quality measures are calculated from Minimum Data Set (MDS) assessments. For most measures, lower percentages indicate better care quality.
31% of new residents, usually for short-term rehab.
61% of new residents, often for short stays.
8% of new residents, often for long-term daily care.
Source: CMS Long-Term Care Facility Characteristics (Data as of Jan 2026)
Residents meet regularly to discuss policies, care quality, and activities
State-approved Nurse Aide Training and Competency Evaluation Program on-site
Organized group of residents that meets regularly to discuss facility policies, quality of life, and activities.
Data sourced from CMS Long-Term Care Facility Characteristics quarterly report. Payer mix reflects the current resident census by primary payment source.
Historical financial and operational data for Boundary Waters Care Center from 2012–2023, based on CMS SNF Cost Reports.
Based on the 2023 CMS SNF Cost Report.
Residents typically stay for brief periods, with frequent admissions and discharges throughout the year.
Most new residents arrive under private pay (61% of admissions), and a typical private pay stay runs around 6 - 7 months.
Coverage residents most often arrive under.
Coverage residents most often leave under.
![]() 0.3 miles from city center
0.3 miles from city center
![]() Estimated distance in miles from Ely's city center to Boundary Waters Care Center's address, calculated via Google Maps.
— 0.05 miles to nearest hospital (Ely-Bloomenson Community Hospital)
Estimated distance in miles from Ely's city center to Boundary Waters Care Center's address, calculated via Google Maps.
— 0.05 miles to nearest hospital (Ely-Bloomenson Community Hospital)
Add your location
Boundary Waters Care Center is located in Ely, Minnesota.
Here are the financial assistance programs available to residents in Minnesota.
The information below is reported by the Minnesota Department of Health, Health Regulation Division.
| Boundary Waters Care Center |
NH Nursing Home Licensed facility providing 24/7 skilled nursing care for residents with complex, ongoing medical needs. Staffed by RNs, LPNs, and CNAs. Inspected and star-rated annually by CMS. Accepts Medicare (short-term rehab) and Medicaid (long-term care).
AL Assisted Living A licensed, long-term care setting for seniors or individuals with disabilities who need help with daily activities — like bathing, dressing, and medication management — but not 24-hour skilled nursing. Offers housing, meals, and around-the-clock support while aiming to maximize resident independence. | Ely | 42
Facility
42
MN AVG
61
Rank
#283 / 532 |
77.0%
Facility
77.0%
MN AVG
79.7%
Rank
#177 / 328 | -3% | 4.50
Facility
4.50
MN AVG
4.77
Rank
#52 / 85 | +4% | -6% | $0
Facility
$0
MN AVG
$47.9k
Rank
#44 / 86 | 21
Facility
21
MN AVG
23.2
Rank
#34 / 86 | 7.0
Facility
7.0
MN AVG
3.8
Rank
#82 / 86 | 1 | 29 | - |
61
Facility
61
MN AVG
43
Rank
#159 / 632 | Michael Forsman | $4.9M
Facility
$4.9M
MN AVG
$9.9M
Rank
#75 / 85 | $3.4M
Facility
$3.4M
MN AVG
$4.9M
Rank
#73 / 85 | 69.3%
Facility
69.3%
MN AVG
50.7%
Rank
#7 / 85 | 245138 | ||||
| Friendship Village of Bloomington |
NH Nursing Home Licensed facility providing 24/7 skilled nursing care for residents with complex, ongoing medical needs. Staffed by RNs, LPNs, and CNAs. Inspected and star-rated annually by CMS. Accepts Medicare (short-term rehab) and Medicaid (long-term care).
AL Assisted Living A licensed, long-term care setting for seniors or individuals with disabilities who need help with daily activities — like bathing, dressing, and medication management — but not 24-hour skilled nursing. Offers housing, meals, and around-the-clock support while aiming to maximize resident independence.
IL Independent Living Lifestyle-focused communities for older adults offering dining, activities, and transportation with minimal personal care. Best for active, independent seniors who want community without medical support.
MC Memory Care Secured, specialized care for people living with Alzheimer's or dementia. Staff trained in cognitive impairment, with higher staff-to-resident ratios and an environment designed to reduce confusion and wandering risk. | Bloomington (West Bloomington) | 85
Facility
85
MN AVG
61
Rank
#159 / 532 |
84.7%
Facility
84.7%
MN AVG
79.7%
Rank
#112 / 328 | +6% | 4.76
Facility
4.76
MN AVG
4.77
Rank
#34 / 85 | +2% | 0% | $99.5k
Facility
$99.5k
MN AVG
$47.9k
Rank
#78 / 86 | 18
Facility
18
MN AVG
23.2
Rank
#26 / 86 | 6.0
Facility
6.0
MN AVG
3.8
Rank
#76 / 86 | 1 | 63 | - |
16
Facility
16
MN AVG
43
Rank
#525 / 632 | Jennifer Bever | $33.8M
Facility
$33.8M
MN AVG
$9.9M
Rank
#3 / 85 | $16.5M
Facility
$16.5M
MN AVG
$4.9M
Rank
#6 / 85 | 48.8%
Facility
48.8%
MN AVG
50.7%
Rank
#63 / 85 | 245229 | ||||
| Jones-Harrison Senior Living |
NH Nursing Home Licensed facility providing 24/7 skilled nursing care for residents with complex, ongoing medical needs. Staffed by RNs, LPNs, and CNAs. Inspected and star-rated annually by CMS. Accepts Medicare (short-term rehab) and Medicaid (long-term care).
AL Assisted Living A licensed, long-term care setting for seniors or individuals with disabilities who need help with daily activities — like bathing, dressing, and medication management — but not 24-hour skilled nursing. Offers housing, meals, and around-the-clock support while aiming to maximize resident independence.
IL Independent Living Lifestyle-focused communities for older adults offering dining, activities, and transportation with minimal personal care. Best for active, independent seniors who want community without medical support.
MC Memory Care Secured, specialized care for people living with Alzheimer's or dementia. Staff trained in cognitive impairment, with higher staff-to-resident ratios and an environment designed to reduce confusion and wandering risk. | Minneapolis (Calhoun Isles) | 53
Facility
53
MN AVG
61
Rank
#249 / 532 |
92.5%
Facility
92.5%
MN AVG
79.7%
Rank
#59 / 328 | +16% | 5.11
Facility
5.11
MN AVG
4.77
Rank
#24 / 85 | +38% | +7% | $0
Facility
$0
MN AVG
$47.9k
Rank
#1 / 86 | 35
Facility
35
MN AVG
23.2
Rank
#61 / 86 | 4.4
Facility
4.4
MN AVG
3.8
Rank
#54 / 86 | - | 49 | - |
56
Facility
56
MN AVG
43
Rank
#212 / 632 | Marcia Diracles | $18.9M
Facility
$18.9M
MN AVG
$9.9M
Rank
#25 / 85 | $12.4M
Facility
$12.4M
MN AVG
$4.9M
Rank
#15 / 85 | 65.9%
Facility
65.9%
MN AVG
50.7%
Rank
#14 / 85 | 245460 | ||||
| Walker Methodist – Westwood Ridge |
NH Nursing Home Licensed facility providing 24/7 skilled nursing care for residents with complex, ongoing medical needs. Staffed by RNs, LPNs, and CNAs. Inspected and star-rated annually by CMS. Accepts Medicare (short-term rehab) and Medicaid (long-term care).
AL Assisted Living A licensed, long-term care setting for seniors or individuals with disabilities who need help with daily activities — like bathing, dressing, and medication management — but not 24-hour skilled nursing. Offers housing, meals, and around-the-clock support while aiming to maximize resident independence.
IL Independent Living Lifestyle-focused communities for older adults offering dining, activities, and transportation with minimal personal care. Best for active, independent seniors who want community without medical support.
MC Memory Care Secured, specialized care for people living with Alzheimer's or dementia. Staff trained in cognitive impairment, with higher staff-to-resident ratios and an environment designed to reduce confusion and wandering risk. | West St Paul (West Saint Paul) | 140
Facility
140
MN AVG
61
Rank
#44 / 532 |
82.9%
Facility
82.9%
MN AVG
79.7%
Rank
#131 / 328 | +4% | 6.74
Facility
6.74
MN AVG
4.77
Rank
#4 / 85 | -3% | +41% | $15.6k
Facility
$15.6k
MN AVG
$47.9k
Rank
#58 / 86 | 30
Facility
30
MN AVG
23.2
Rank
#53 / 86 | 5.0
Facility
5.0
MN AVG
3.8
Rank
#63 / 86 | 1 | 116 | - |
63
Facility
63
MN AVG
43
Rank
#145 / 632 | Walker Methodist | $12.3M
Facility
$12.3M
MN AVG
$9.9M
Rank
#44 / 85 | $7.1M
Facility
$7.1M
MN AVG
$4.9M
Rank
#42 / 85 | 57.6%
Facility
57.6%
MN AVG
50.7%
Rank
#43 / 85 | 245618 | ||||
| Benedictine Living Community-Duluth |
NH Nursing Home Licensed facility providing 24/7 skilled nursing care for residents with complex, ongoing medical needs. Staffed by RNs, LPNs, and CNAs. Inspected and star-rated annually by CMS. Accepts Medicare (short-term rehab) and Medicaid (long-term care).
AL Assisted Living A licensed, long-term care setting for seniors or individuals with disabilities who need help with daily activities — like bathing, dressing, and medication management — but not 24-hour skilled nursing. Offers housing, meals, and around-the-clock support while aiming to maximize resident independence.
HC Home Care Professional care delivered in the person's own home — from companionship and errands to skilled nursing and therapy. Allows seniors to age in place. Medicare covers skilled home health when medically necessary.
IL Independent Living Lifestyle-focused communities for older adults offering dining, activities, and transportation with minimal personal care. Best for active, independent seniors who want community without medical support.
MC Memory Care Secured, specialized care for people living with Alzheimer's or dementia. Staff trained in cognitive impairment, with higher staff-to-resident ratios and an environment designed to reduce confusion and wandering risk. | Duluth (Kenwood) | 96
Facility
96
MN AVG
61
Rank
#131 / 532 |
100.0%
Facility
100.0%
MN AVG
79.7%
Rank
#1 / 328 | +25% | 3.85
Facility
3.85
MN AVG
4.77
Rank
#67 / 85 | -27% | -19% | $0
Facility
$0
MN AVG
$47.9k
Rank
#1 / 86 | 16
Facility
16
MN AVG
23.2
Rank
#19 / 86 | 3.2
Facility
3.2
MN AVG
3.8
Rank
#29 / 86 | - | 89 | - |
9
Facility
9
MN AVG
43
Rank
#560 / 632 | Tia Bowe | $32.6M
Facility
$32.6M
MN AVG
$9.9M
Rank
#4 / 85 | $11.3M
Facility
$11.3M
MN AVG
$4.9M
Rank
#20 / 85 | 34.8%
Facility
34.8%
MN AVG
50.7%
Rank
#83 / 85 | 245236 |
Boundary Waters Care Center is in the Ely neighborhood of Ely.
Boundary Waters Care Center has a walk score of 61. Moderately walkable. Some errands can be accomplished on foot, with a mix of nearby amenities.
Boundary Waters Care Center's occupancy is 77.0%.
Yes — there are 2 photos of Boundary Waters Care Center in the photo gallery on this page.
(218) 365-8705 will put you in contact with the team at Boundary Waters Care Center.
Yes — Boundary Waters Care Center is a CMS-certified provider of Medicare and Medicaid.
Care Cost Calculator: See Prices in Your Area
Nursing Home Data Explorer
Don’t Wait Too Long: 7 Red Flag Signs Your Parent Needs Assisted Living Now
The True Cost of Assisted Living in 2025 – And How Families Are Paying For It
Understanding Senior Living Costs: Pricing Models, Discounts & Financial Assistance


Thank you for your interest!
Our team will be in touch shortly to help with next steps.
