

Total health inspections
4
Nevada average 5.1
Last Health inspection on May 2025

We arrange tours, appointments, and even moving support so you don’t have to
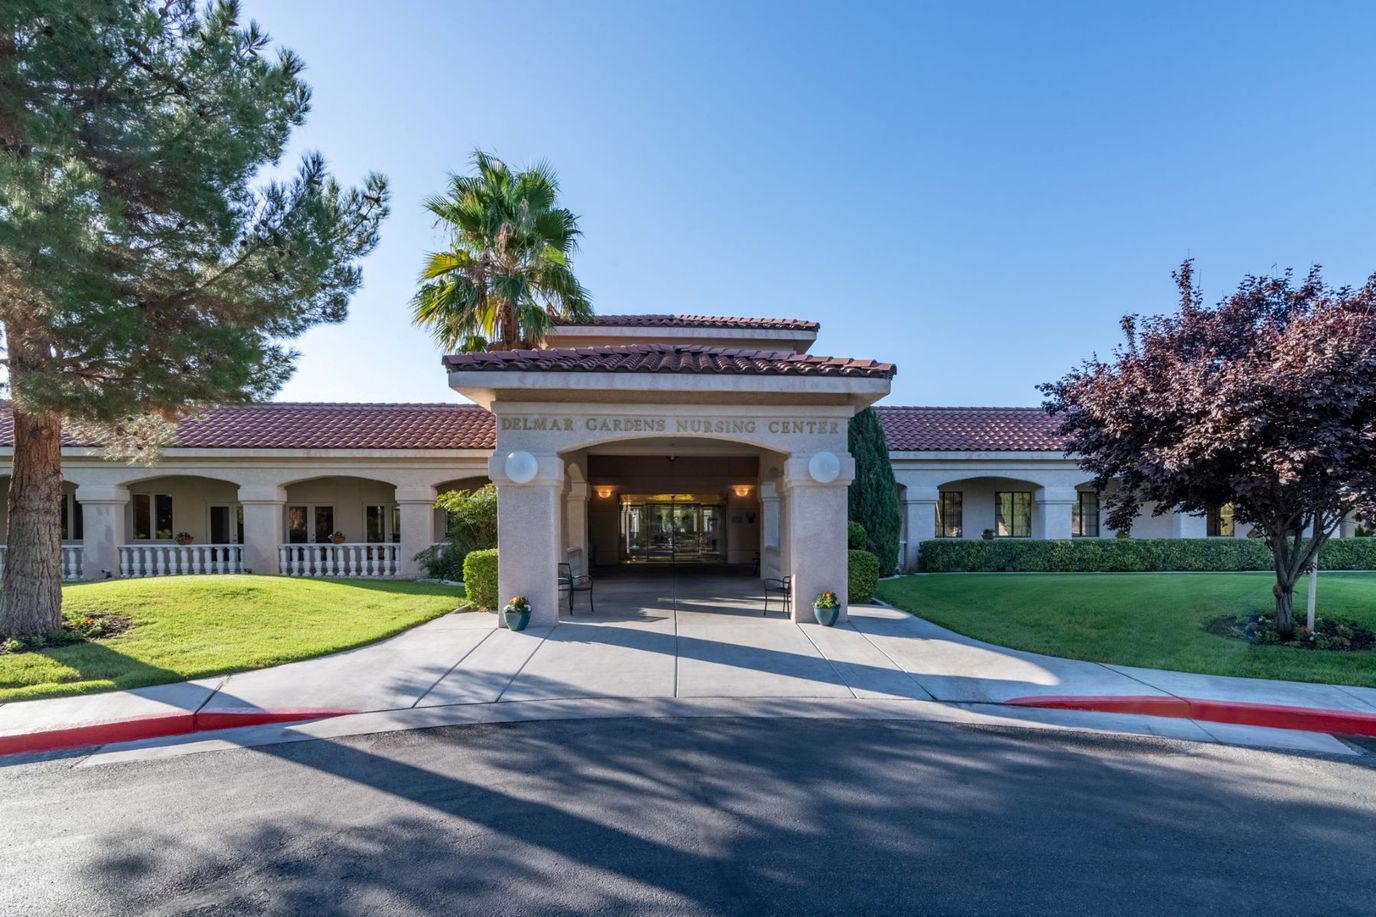
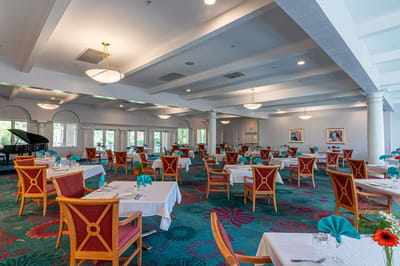

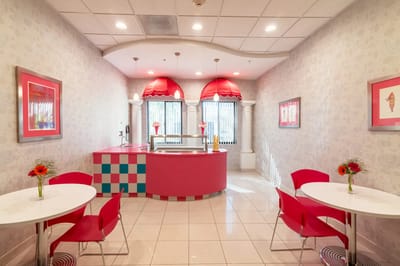
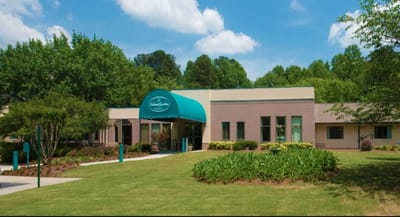
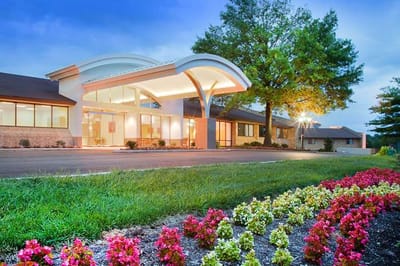
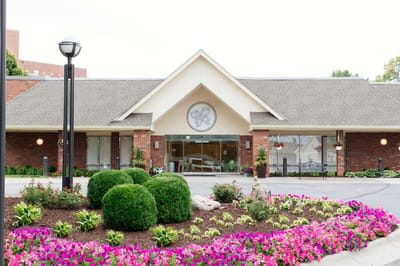
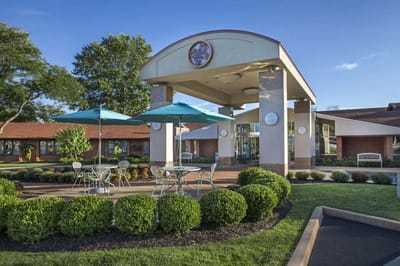
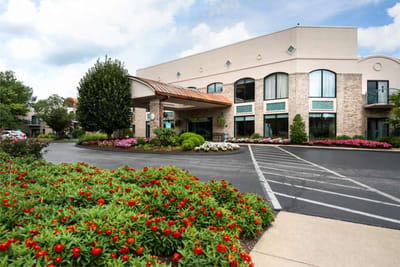


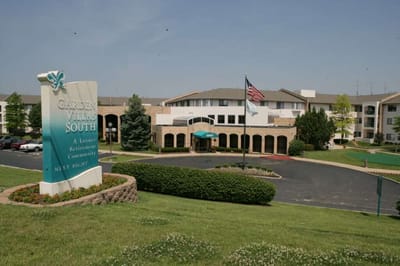


Delmar Gardens of Green Valley is the city’s premier skilled nursing and rehabilitation center. The results-driven nursing home aims to change the meaning of skilled nursing and rehabilitation for seniors through the exceptional care delivered by their patient-friendly staff to offer the best care possible for their residents. Delmar Gardens is trusted as a safe and secure community that cares for every patient’s needs.
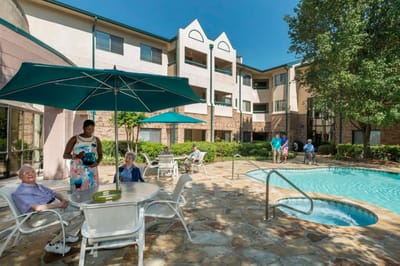
Convenience and hassle-free living are the centers of Delmar Gardens’ service medication management, post-surgical care, and wound care; their 24-hour skilled nursing care services provide compassionate care as it is their utmost priority. Other benefits include 24/7 easy admission, fall prevention, IV therapy, discharge planning, and case management.
| Staff type | Hours / Day / Resident | vs state avg |
|---|---|---|
|
Registered Nurse (RN)
| 27m per day | ▼ 58% State avg: 1h 4m per day · National avg: 41m per day |
|
LPN / LVN
| 1h 2m per day | ▲ 15% State avg: 54m per day · National avg: 52m per day |
|
Nurse Aide
| 2h 17m per day | ▼ 4% State avg: 2h 23m per day · National avg: 2h 21m per day |
|
Weekend Total Nursing
| 3h 26m per day | ▼ 11% State avg: 3h 51m per day · National avg: 3h 26m per day |
|
Physical Therapist
| 2m per day | ▼ 60% State avg: 5m per day · National avg: 4m per day |
|
Weekend RN
| 22m per day | ▼ 57% State avg: 51m per day · National avg: 29m per day |
Key information about the people who lead and staff this community.
In Nevada, the Department of Health and Human Services, Bureau of Health Care Quality and Compliance performs unannounced onsite surveys to evaluate resident safety and care quality.
Deficiencies
| This Facility | NV Average | vs. NV Avg |
|---|---|---|---|
|
Total deficiencies
| 34 | 62 | This facility has 45% fewer total deficiencies than a typical Nevada nursing home (34 vs. NV avg 62).↓ 45% better |
|
Deficiencies per year
| 11.3 | 20.7 | This facility has 45% fewer deficiencies per year than a typical Nevada nursing home (11.3 vs. NV avg 20.7).↓ 45% better |
Nevada average 5.1
Last Health inspection on May 2025
Nevada average 36.2
Nevada average 7.08
Health citations are formal notices following inspections when they fail to comply with safety and care standards.
29 of 34 citations resulted from standard inspections; 3 of 34 resulted from complaint investigations; and 2 of 34 came from combined inspections (standard and complaint).
Nevada average: 0.1
Nevada average: 0.5
Reporting period: October 1 – December 31, 2025 (Q4 2025). Source: CMS Payroll-Based Journal report.
Manages medical care and health needs.
Assists with medical care and medications.
Helps with daily care and mobility.
| Certified Nursing Assistant | 152 | 0 | 152 | 43,510 | 92 | 100% | 7.7 |
| Licensed Practical Nurse | 53 | 0 | 53 | 18,382 | 92 | 100% | 8.1 |
| Physical Therapist | 20 | 0 | 20 | 9,220 | 92 | 100% | 7.9 |
| Registered Nurse | 30 | 0 | 30 | 8,768 | 92 | 100% | 8 |
| Other Dietary Services Staff | 5 | 0 | 5 | 2,329 | 92 | 100% | 7.8 |
| RN Director of Nursing | 3 | 0 | 3 | 1,480 | 66 | 72% | 8 |
| Mental Health Service Worker | 3 | 0 | 3 | 1,399 | 66 | 72% | 7.7 |
| Speech Language Pathologist | 6 | 0 | 6 | 1,080 | 87 | 95% | 7.6 |
| Dietitian | 2 | 0 | 2 | 1,024 | 67 | 73% | 8 |
| Physical Therapy Aide | 6 | 0 | 6 | 931 | 77 | 84% | 7.7 |
| Clinical Nurse Specialist | 2 | 0 | 2 | 573 | 48 | 52% | 8 |
| Qualified Social Worker | 1 | 0 | 1 | 554 | 75 | 82% | 7.4 |
| Physical Therapy Assistant | 2 | 0 | 2 | 550 | 64 | 70% | 7.5 |
| Occupational Therapy Aide | 1 | 0 | 1 | 528 | 66 | 72% | 8 |
| Respiratory Therapy Technician | 2 | 0 | 2 | 515 | 58 | 63% | 8.6 |
| Administrator | 1 | 0 | 1 | 488 | 62 | 67% | 7.9 |
| Nurse Practitioner | 2 | 0 | 2 | 480 | 60 | 65% | 8 |
Federal penalties imposed by CMS for regulatory violations, including civil money penalties (fines) and denials of payment for new Medicare/Medicaid admissions.
Source: CMS Penalties Database
No penalties in the past 3 years
No civil money penalties or payment denials were reported in the last 3 years.
These measures show how residents usually do over time at this home, based on health outcomes and preventive care.
Nevada average: 9.7
Nevada average: 17.5
Nevada average: 15.6%
Nevada average: 20.8%
Nevada average: 16.9%
Nevada average: 2.5%
Nevada average: 5.5%
Nevada average: 1.4%
Nevada average: 5.4%
Nevada average: 4.2%
Nevada average: 14.1%
Nevada average: 91.0%
Nevada average: 89.6%
Nevada average: 1.82
Nevada average: 1.50
Nevada average: 83.9%
Nevada average: 2.0%
Nevada average: 80.7%
Nevada average: 23.4%
Nevada average: 9.8%
Nevada average: 0.8%
Nevada average: 53.7%
Nevada average: 50.6%
Quality measures are calculated from Minimum Data Set (MDS) assessments. For most measures, lower percentages indicate better care quality.
18% of new residents, usually for short-term rehab.
56% of new residents, often for short stays.
27% of new residents, often for long-term daily care.
Source: CMS Long-Term Care Facility Characteristics (Data as of Jan 2026)
Residents meet regularly to discuss policies, care quality, and activities
State-approved Nurse Aide Training and Competency Evaluation Program on-site
Organized group of residents that meets regularly to discuss facility policies, quality of life, and activities.
Data sourced from CMS Long-Term Care Facility Characteristics quarterly report. Payer mix reflects the current resident census by primary payment source.
Historical financial and operational data for Delmar Gardens of Green Valley based on CMS SNF Cost Reports.
Most residents stay for extended periods and receive ongoing daily care.
Tara serves as the Administrator at Delmar Gardens of Green Valley, providing attentive and professional leadership to the community. Known for her dedication and hands-on approach, she ensures high-quality service and a warm environment for residents.
![]() 7.4 miles from city center
7.4 miles from city center
![]() Estimated distance in miles from Henderson's city center to Delmar Gardens of Green Valley's address, calculated via Google Maps.
— 2.39 miles to nearest hospital (Dignity Health - St. Rose Dominican Hospital, Siena Campus - Henderson, NV)
Estimated distance in miles from Henderson's city center to Delmar Gardens of Green Valley's address, calculated via Google Maps.
— 2.39 miles to nearest hospital (Dignity Health - St. Rose Dominican Hospital, Siena Campus - Henderson, NV)
Add your location
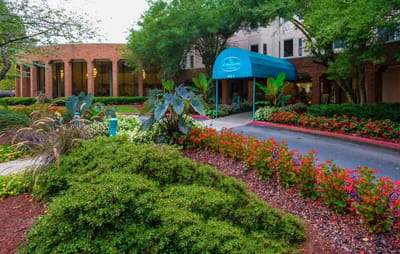
Delmar Gardens of Green Valley is located in Henderson, Nevada.
Here are the financial assistance programs available to residents in Nevada.
The information below is reported by the Nevada Department of Health and Human Services, Bureau of Health Care Quality and Compliance.
| Lake Mead Health and Rehabilitation Center |
NH Nursing Home Licensed facility providing 24/7 skilled nursing care for residents with complex, ongoing medical needs. Staffed by RNs, LPNs, and CNAs. Inspected and star-rated annually by CMS. Accepts Medicare (short-term rehab) and Medicaid (long-term care).
AL Assisted Living A licensed, long-term care setting for seniors or individuals with disabilities who need help with daily activities — like bathing, dressing, and medication management — but not 24-hour skilled nursing. Offers housing, meals, and around-the-clock support while aiming to maximize resident independence. | Henderson (East Lake Mead Parkway) | 120
Facility
120
NV AVG
43
Rank
#42 / 321 | - | - | 3.17 | +11% | -21% | $40.4k | 33 | 8.3 | 2 | 100 | - |
20
Facility
20
NV AVG
45
Rank
#340 / 414 | - | $5.4M | $2.1M | 39.2% | 295075 | ||||
| Delmar Gardens of Green Valley |
NH Nursing Home Licensed facility providing 24/7 skilled nursing care for residents with complex, ongoing medical needs. Staffed by RNs, LPNs, and CNAs. Inspected and star-rated annually by CMS. Accepts Medicare (short-term rehab) and Medicaid (long-term care).
AL Assisted Living A licensed, long-term care setting for seniors or individuals with disabilities who need help with daily activities — like bathing, dressing, and medication management — but not 24-hour skilled nursing. Offers housing, meals, and around-the-clock support while aiming to maximize resident independence. | Henderson (Green Valley South) | 242
Facility
242
NV AVG
43
Rank
#4 / 321 | 72.7% | -11% | 3.46 | -31% | -14% | $0 | 34 | 8.5 | - | 195 | - |
55
Facility
55
NV AVG
45
Rank
#152 / 414 | Candace Dooling | $23.5M | $11.1M | 47.3% | 295041 | ||||
| Nevada State Veterans Home – Boulder City |
NH Nursing Home Licensed facility providing 24/7 skilled nursing care for residents with complex, ongoing medical needs. Staffed by RNs, LPNs, and CNAs. Inspected and star-rated annually by CMS. Accepts Medicare (short-term rehab) and Medicaid (long-term care).
AL Assisted Living A licensed, long-term care setting for seniors or individuals with disabilities who need help with daily activities — like bathing, dressing, and medication management — but not 24-hour skilled nursing. Offers housing, meals, and around-the-clock support while aiming to maximize resident independence. | Boulder City (Veterans Memorial Drive) | 180
Facility
180
NV AVG
43
Rank
#11 / 321 | 88.9% | +9% | - | -25% | - | $10.4k | 29 | 5.8 | 1 | 160 | - |
3
Facility
3
NV AVG
45
Rank
#400 / 414 | - | $25.3M | $14.4M | 57% | 295081 | ||||
| TLC Care Center |
NH Nursing Home Licensed facility providing 24/7 skilled nursing care for residents with complex, ongoing medical needs. Staffed by RNs, LPNs, and CNAs. Inspected and star-rated annually by CMS. Accepts Medicare (short-term rehab) and Medicaid (long-term care).
AL Assisted Living A licensed, long-term care setting for seniors or individuals with disabilities who need help with daily activities — like bathing, dressing, and medication management — but not 24-hour skilled nursing. Offers housing, meals, and around-the-clock support while aiming to maximize resident independence. | Henderson (Whitney Ranch) | 255
Facility
255
NV AVG
43
Rank
#3 / 321 | 88.6% | +9% | 3.36 | -57% | -17% | $20.7k | 58 | 9.7 | 1 | 230 | A+ |
68
Facility
68
NV AVG
45
Rank
#56 / 414 | Phillip Sterling | $9.3M | $4.5M | 47.7% | 295071 |
Delmar Gardens of Green Valley is in the Green Valley South neighborhood of Henderson.
Delmar Gardens of Green Valley has a walk score of 55. Moderately walkable. Some errands can be accomplished on foot, with a mix of nearby amenities.
Delmar Gardens of Green Valley's occupancy is 72.7%.
Yes — there are 44 photos of Delmar Gardens of Green Valley in the photo gallery on this page.
(702) 361-6111 will put you in contact with the team at Delmar Gardens of Green Valley.
Yes — Delmar Gardens of Green Valley is a CMS-certified provider of Medicare and Medicaid.
Care Cost Calculator: See Prices in Your Area
Nursing Home Data Explorer
Don’t Wait Too Long: 7 Red Flag Signs Your Parent Needs Assisted Living Now
The True Cost of Assisted Living in 2025 – And How Families Are Paying For It
Understanding Senior Living Costs: Pricing Models, Discounts & Financial Assistance


Thank you for your interest!
Our team will be in touch shortly to help with next steps.
