Delmar Gardens of Green Valley
Nursing Home, Assisted Living, Independent Living, Memory Care, Respite Care & Hospice Care · Henderson, NV
CMS overall rating Info The Overall CMS Rating is scored from 1 to 5 stars and combines results from health inspections, staffing levels, and quality measures. Health inspections carry the most weight. Staffing and quality scores can increase or decrease the final rating based on performance compared to state and national standards.

Delmar Gardens of Green Valley

Nursing Home, Assisted Living, Independent Living, Memory Care, Respite Care & Hospice Care · Henderson, NV
CMS overall rating Info The Overall CMS Rating is scored from 1 to 5 stars and combines results from health inspections, staffing levels, and quality measures. Health inspections carry the most weight. Staffing and quality scores can increase or decrease the final rating based on performance compared to state and national standards.
Calculator: See prices in your area
Delmar Gardens of Green Valley accepts Medicare, Medicaid, and private pay.

Overview of Delmar Gardens of Green Valley

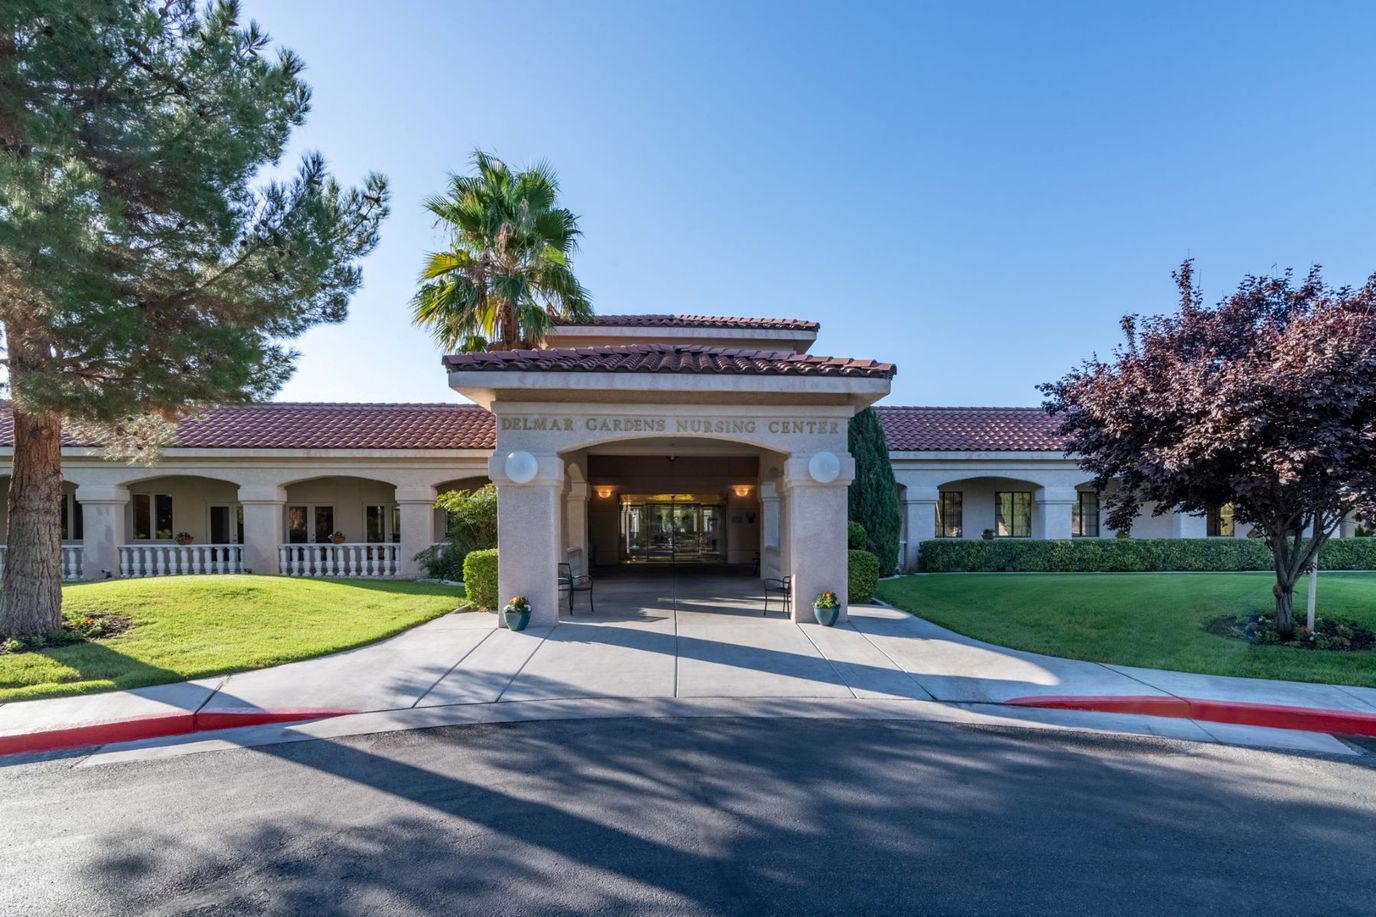
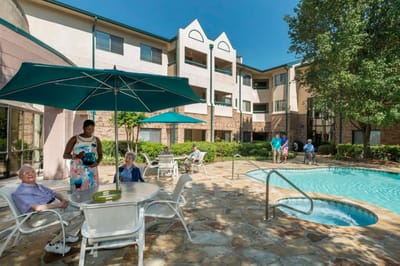
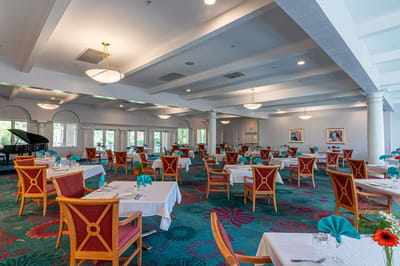
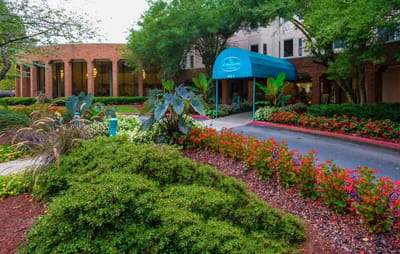
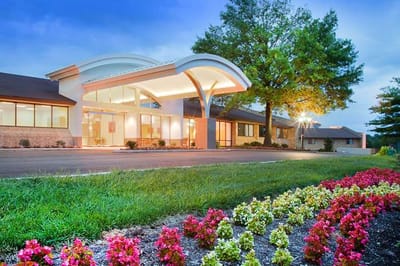
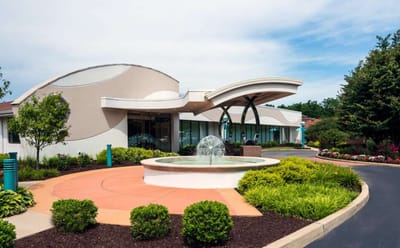
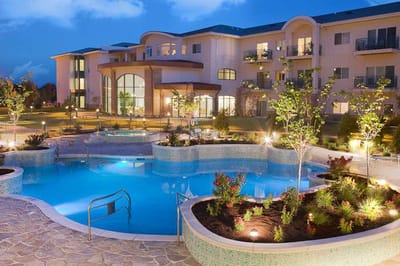
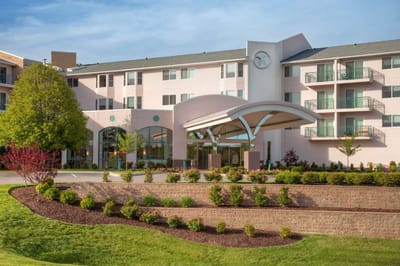
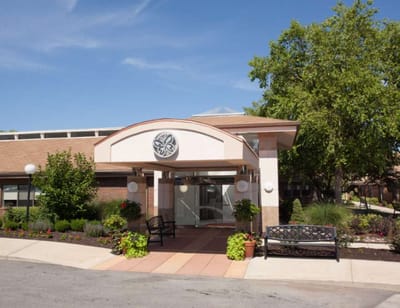
Delmar Gardens of Green Valley is the city’s premier skilled nursing and rehabilitation center. The results-driven nursing home aims to change the meaning of skilled nursing and rehabilitation for seniors through the exceptional care delivered by their patient-friendly staff to offer the best care possible for their residents. Delmar Gardens is trusted as a safe and secure community that cares for every patient’s needs.
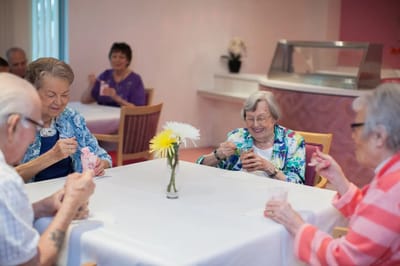
Convenience and hassle-free living are the centers of Delmar Gardens’ service medication management, post-surgical care, and wound care; their 24-hour skilled nursing care services provide compassionate care as it is their utmost priority. Other benefits include 24/7 easy admission, fall prevention, IV therapy, discharge planning, and case management.

Quality ratings

Measured by Centers for Medicare & Medicaid Services (CMS)

Overall rating Info The Overall CMS Rating combines results from health inspections, staffing levels and quality measures. Health inspections carry the most weight. Staffing and quality scores can increase or decrease the final rating based on performance compared to state and national standards.
▼ 25.4% Below NV avg. ▼ 25.4% Below NV avg.Click the badge to see the full State ranking.Click here to see the full State ranking.
Health Inspection Info Based on the results of the facility's three most recent standard inspections and any complaint investigations. CMS reviews the number, scope, and severity of deficiencies, with more recent findings weighted more heavily.
▼ 21.9% Below NV avg. ▼ 21.9% Below NV avg.Click the badge to see the full State ranking.Click here to see the full State ranking.
Staffing Info Measures average nursing staff hours per resident per day, including Registered Nurses (RNs) and total nursing staff. Ratings are adjusted based on the level of care residents require and are compared to state and national benchmarks.
▲ 7.5% Above NV avg. ▲ 7.5% Above NV avg.Click the badge to see the full State ranking.Click here to see the full State ranking.
Quality Measures Info Based on clinical and physical health indicators reported to CMS, such as hospital readmissions, falls, pressure ulcers, and improvements in mobility. These measures reflect how well residents' health needs are being managed.
▼ 46.2% Below NV avg. ▼ 46.2% Below NV avg.Click the badge to see the full State ranking.Click here to see the full State ranking.

Staffing hours breakdown

Info Daily nursing hours per resident by staff type, reported to CMS. Higher is generally better — compare this facility to state and national averages to see where staffing stands.

Hours per resident per day — compared to Nevada state averages

Total nursing care / resident Info This home is ranked 22nd out of 44 homes in Nevada. Total adjusted nursing hours per resident per day, combining RN, LPN, and aide time. CMS adjusts this for case-mix so facilities can be fairly compared.
3h 27m per day
Rank #22 / 44Nurse hours — State benchmarkedThis home is ranked 22nd out of 44 homes in Nevada. Shows adjusted nurse hours per resident per day benchmarked to the Nevada average, with a ranking across 44 Nevada SNFs. More hours mean more direct care. The national average is about 3.5 hrs; below 3.0 is a red flag.Click the rank badge to see the full State ranking.Click here to see the full State ranking.
This facility Nevada avg (3h 34m per day)
vs Nevada avg
-3%

5 of 6 metrics below state avg

Standout metric LPN / LVN is +15% above state avg
Staff typeHours / Day / Residentvs state avg
Registered Nurse (RN) Info RNs hold the highest nursing license and can assess residents, interpret test results, and direct care plans. More RN hours per day often signals stronger clinical oversight and faster response to health changes. 27m per day ▼ 58% State avg: 1h 4m per day · National avg: 41m per day
LPN / LVN Info Licensed Practical Nurses (LPNs) or Licensed Vocational Nurses (LVNs) deliver routine hands-on care — medication administration, wound dressing, and monitoring vital signs. They work under RN supervision and make up a large share of daily bedside care. 1h 2m per day ▲ 15% State avg: 54m per day · National avg: 52m per day
Nurse Aide Info Certified Nurse Aides (CNAs) provide the most direct day-to-day assistance: bathing, dressing, feeding, and mobility. Nurse aide hours are typically the largest staffing category and directly affect residents' quality of life. 2h 17m per day ▼ 4% State avg: 2h 23m per day · National avg: 2h 21m per day
Weekend Total Nursing Info Combined nursing hours (RN + LPN + Nurse Aide) per resident per day on weekends. Staffing often drops on weekends — this figure reveals whether the facility maintains adequate coverage outside of weekday hours. 3h 26m per day ▼ 11% State avg: 3h 51m per day · National avg: 3h 26m per day
Physical Therapist Info Hours per resident per day provided by licensed Physical Therapists (PTs) or PT Assistants. PT services help residents recover mobility after injury or illness and are especially important for post-acute (short-stay) rehabilitation. 2m per day ▼ 60% State avg: 5m per day · National avg: 4m per day
Weekend RN Info Registered nurse hours specifically on weekends. Facilities sometimes reduce RN presence on Saturdays and Sundays — a low weekend RN figure compared to weekday hours can indicate reduced clinical oversight when most administrative staff are absent. 22m per day ▼ 57% State avg: 51m per day · National avg: 29m per day

Types of Care at Delmar Gardens of Green Valley

Assisted Living Independent Living Memory Care Respite Care Nursing Home Hospice Care

Capacity and availability

This home usually has availability

Occupancy lower than 85% suggests more openings may be available.

Lower occupancy than the Nevada average: 81.5%
Occupancy rate 72.7% Rank #189 / 265Occupancy rate — State benchmarkedThis home is ranked 189th out of 265 homes in Nevada. Shows this facility's occupancy rate versus the Nevada average, with its Statewide rank out of 265. Higher occupancy signals strong local demand and financial stability.Click the rank badge to see the full State ranking.Click here to see the full State ranking.
Avg. Length of Stay 38 days
Occupancy rate
72.7% Rank #189 / 265Occupancy rate — State benchmarkedThis home is ranked 189th out of 265 homes in Nevada. Shows this facility's occupancy rate versus the Nevada average, with its Statewide rank out of 265. Higher occupancy signals strong local demand and financial stability.Click the rank badge to see the full State ranking.Click here to see the full State ranking.
Avg. Length of Stay
38 days
Years in operation
46 years in operation Rank #6 / 276Years in operation — State benchmarkedThis home is ranked 6th out of 276 homes in Nevada. Shows how long this facility has been in operation compared to other Nevada SNFs. Longer operating histories may benefit residents, families, and staff.Click the rank badge to see the full State ranking.Click here to see the full State ranking.
A longer operating history, which may indicate experience navigating regulations and delivering ongoing care.
Walk Score
Walk Score: 55 / 100 Rank #152 / 413Walk Score — State benchmarkedThis home is ranked 152nd out of 413 homes in Nevada. Shows how walkable this facility's neighborhood is compared to the average Walk Score across Nevada SNFs. Higher scores benefit residents, families, and staff.Click the rank badge to see the full State ranking.Click here to see the full State ranking.
Moderately walkable. Some errands can be accomplished on foot, with a mix of nearby amenities.

About this community

License Details

CMS Certification Number295041

Staffing

Key information about the people who lead and staff this community.

Leadership

ContactMr. Gabe Grossberg, President

Therapy & Rehabilitation

3 services
Rehabilitation Services
Respite Care
Short-Term Rehab

Memory & Specialized Care

1 service
No Alzheimer's certification

Additional Services

1 service
Short-Term Rehabilitation

Amenities & Lifestyle

Specific ProgramsRespite Care and Transitional Stays, Pharmacy, Home Care, Hospice & Palliative Care, Early Childhood Education Center

Contact Delmar Gardens of Green Valley

Inspection History

In Nevada, the Department of Health and Human Services, Bureau of Health Care Quality and Compliance performs unannounced onsite surveys to evaluate resident safety and care quality.

Since 2023 · 3 years of data 34 deficiencies

Inspection Scorecard Info This scorecard compares key inspection, citation, and complaint metrics at this facility against the Nevada state average. Metrics rated ≥15% worse than average are highlighted in red; those ≥15% better are highlighted in green.

Since 2023 vs. Nevada state average
Overall vs. NV average 0 Worse No metrics in this bucket. 2 Better Metrics better than Nevada average:
• Total deficiencies (45% below)
• Deficiencies per year (45% below)
Latest Inspection September 26, 2025 Complaint Investigation

Deficiencies Info Deficiencies are formal regulatory issues recorded during state inspections.

This FacilityNV Averagevs. NV Avg
Total deficiencies Info Formal regulatory issues recorded by inspectors across all inspection types. 3462 This facility has 45% fewer total deficiencies than a typical Nevada nursing home (34 vs. NV avg 62).↓ 45% better
Deficiencies per year Info Average deficiencies per year since 2023. 11.320.7 This facility has 45% fewer deficiencies per year than a typical Nevada nursing home (11.3 vs. NV avg 20.7).↓ 45% better

Inspection Reports Summary Info An editor-reviewed summary of the themes and findings across this facility's recent inspection reports.

The most recent inspection on September 26, 2025, identified deficiencies related to informed consent for psychoactive medications, care planning for hospice residents, assistance with daily living activities, pressure ulcer risk assessments, resident supervision, and food safety in personal refrigerators. Earlier inspections showed a pattern of issues including resident abuse, medication errors, infection control lapses, inaccurate assessments, inadequate feeding assistance, and incomplete care planning. Inspectors cited concerns primarily involving resident care, medication management, supervision, and food safety. Complaint investigations substantiated abuse and medication errors but most other complaints were unsubstantiated or related to care deficiencies. The facility’s deficiencies have persisted over time with recurring themes, indicating ongoing challenges in several areas.

Read the full inspection reports for this facility, including detailed findings and corrective actions.

Show Inspection Reports

Health Inspection History

Inspections since 2022
Total health inspections 4

Nevada average 5.1


Last Health inspection on May 2025

Total health citations
34 Rank #25 / 46Health citations — State benchmarkedThis home is ranked 25th out of 46 homes in Nevada. Shows this facility's total health deficiency citations benchmarked to the Nevada State average, with a ranking across all 46 NV SNFs. Lower citation counts earn a better rank.Click the rank badge to see the full State ranking.Click here to see the full State ranking.

Nevada average 36.2

Citations per inspection
8.5 Rank #34 / 46Citations per inspection — State benchmarkedThis home is ranked 34th out of 46 homes in Nevada. Shows average deficiency citations per CMS inspection for this facility versus the Nevada mean across 46 SNFs with citation data. Lower is better.Click the rank badge to see the full State ranking.Click here to see the full State ranking.

Nevada average 7.08


Health citations are formal notices following inspections when they fail to comply with safety and care standards.

29 of 34 citations resulted from standard inspections; 3 of 34 resulted from complaint investigations; and 2 of 34 came from combined inspections (standard and complaint).

Breakdown of citation severity (last 4 years)
Critical Health citations
0
100% better than Nevada average

Nevada average: 0.1


Serious Health citations
0
100% better than Nevada average

Nevada average: 0.5

0 critical citations Nevada average: 0.1

0 serious citations Nevada average: 0.5

34 moderate citations Nevada average: 35

0 minor citations Nevada average: 0.5
Citations history (last 4 years)
Abuse/Neglect moderate citation May 22, 2025
Corrected

Infection Control moderate citation May 22, 2025
Corrected

Pharmacy moderate citation May 22, 2025
Corrected

Nursing Services moderate citation Sep 27, 2024
Corrected

Staffing Data

Reporting period: October 1 – December 31, 2025 (Q4 2025). Source: CMS Payroll-Based Journal report.

Total staff 291
Employees 291
Contractors 0
Staff to resident ratio 1.52:1
0% compared with Nevada average
Nevada average ratio: 1.54:1 Nevada average ratio: 1.54:1See full Nevada ranking
Avg staff/day 127
Average shift 7.9 hours
10% worse than Nevada average
Nevada average: 8.8 hours Nevada average shift: 8.8 hoursSee full Nevada ranking
Total staff hours (quarter) 91,810

Nursing staff breakdown

Q4 2025 · Oct 1 – Dec 31 More info This data comes from the CMS Payroll-Based Journal report covering October 1 – December 31, 2025.
Registered Nurse

Manages medical care and health needs.

RN Staff 30
Average shift length Info Average shift length. Calculated as total hours divided by days worked and average staff per day. 8 hours

No contractors work on this role.

Licensed Practical Nurse

Assists with medical care and medications.

LPN Staff 53
Average shift length Info Average shift length. Calculated as total hours divided by days worked and average staff per day. 8.1 hours

No contractors work on this role.

Certified Nursing Assistant

Helps with daily care and mobility.

CNA Staff 152
Average shift length Info Average shift length. Calculated as total hours divided by days worked and average staff per day. 7.7 hours

No contractors work on this role.

Contractor staffing

Q4 2025 · Oct 1 – Dec 31 More info This data comes from the CMS Payroll-Based Journal report covering October 1 – December 31, 2025.

Total hours from contractors

0%

0 contractor hours this quarter

No contractor roles were reported this quarter.

Staff by category

Q4 2025 · Oct 1 – Dec 31 More info This data comes from the CMS Payroll-Based Journal report covering October 1 – December 31, 2025.
Certified Nursing Assistant152015243,51092100%7.7
Licensed Practical Nurse5305318,38292100%8.1
Physical Therapist200209,22092100%7.9
Registered Nurse300308,76892100%8
Other Dietary Services Staff5052,32992100%7.8
RN Director of Nursing3031,4806672%8
Mental Health Service Worker3031,3996672%7.7
Speech Language Pathologist6061,0808795%7.6
Dietitian2021,0246773%8
Physical Therapy Aide6069317784%7.7
Clinical Nurse Specialist2025734852%8
Qualified Social Worker1015547582%7.4
Physical Therapy Assistant2025506470%7.5
Occupational Therapy Aide1015286672%8
Respiratory Therapy Technician2025155863%8.6
Administrator1014886267%7.9
Nurse Practitioner2024806065%8
152 Certified Nursing Assistant
% of Days 100%
53 Licensed Practical Nurse
% of Days 100%
20 Physical Therapist
% of Days 100%
30 Registered Nurse
% of Days 100%
5 Other Dietary Services Staff
% of Days 100%
3 RN Director of Nursing
% of Days 72%
3 Mental Health Service Worker
% of Days 72%
6 Speech Language Pathologist
% of Days 95%
2 Dietitian
% of Days 73%
6 Physical Therapy Aide
% of Days 84%
2 Clinical Nurse Specialist
% of Days 52%
1 Qualified Social Worker
% of Days 82%
2 Physical Therapy Assistant
% of Days 70%
1 Occupational Therapy Aide
% of Days 72%
2 Respiratory Therapy Technician
% of Days 63%
1 Administrator
% of Days 67%
2 Nurse Practitioner
% of Days 65%

Penalties and fines

Federal penalties imposed by CMS for regulatory violations, including civil money penalties (fines) and denials of payment for new Medicare/Medicaid admissions.

Source: CMS Penalties Database

No penalties in the past 3 years

No civil money penalties or payment denials were reported in the last 3 years.

Quality of care over time

These measures show how residents usually do over time at this home, based on health outcomes and preventive care.

High-risk clinical events score Info A composite score based on pressure ulcers, falls with injury, weight loss, walking ability decline, and activities of daily living decline. 17.3
78% worse than Nevada average

Nevada average: 9.7

Functional decline score Info A composite score based on activities of daily living decline, walking ability decline, and incontinence. 29.1
67% worse than Nevada average

Nevada average: 17.5

Long-stay resident measures
Below average Nevada avg: 3.1 Info CMS star rating based on long-stay quality measure performance. 5 stars = significantly above average, 1 star = significantly below average.
Need for Help with Daily Activities Increased Info Percent of long-stay residents whose need for help with daily activities has increased 33.7%
116% worse than Nevada average

Nevada average: 15.6%

Walking Ability Worsened Info Percent of long-stay residents whose ability to move independently worsened 30.8%
48% worse than Nevada average

Nevada average: 20.8%

Low Risk Residents with Bowel/Bladder Incontinence Info Percent of low risk long-stay residents who lose control of their bowels or bladder 22.9%
36% worse than Nevada average

Nevada average: 16.9%

Falls with Major Injury Info Percent of long-stay residents experiencing one or more falls with major injury 2.8%
12% worse than Nevada average

Nevada average: 2.5%

High Risk Residents with Pressure Ulcers Info Percent of long-stay high risk residents with pressure ulcers 6.2%
13% worse than Nevada average

Nevada average: 5.5%

Urinary Tract Infection Info Percent of long-stay residents with a urinary tract infection 1.8%
26% worse than Nevada average

Nevada average: 1.4%

Lost Too Much Weight Info Percent of long-stay residents who lose too much weight 12.9%
138% worse than Nevada average

Nevada average: 5.4%

Depressive Symptoms Info Percent of long-stay residents who have depressive symptoms 7.3%
73% worse than Nevada average

Nevada average: 4.2%

Antipsychotic Use Info Percent of long-stay residents who received an antipsychotic medication 23.6%
67% worse than Nevada average

Nevada average: 14.1%

Pneumococcal Vaccine Info Percent of long-stay residents assessed and appropriately given the pneumococcal vaccine 41.5%
54% worse than Nevada average

Nevada average: 91.0%

Influenza Vaccine Info Percent of long-stay residents assessed and appropriately given the seasonal influenza vaccine 60.7%
32% worse than Nevada average

Nevada average: 89.6%

Hospitalizations per 1,000 days Info Number of hospitalizations per 1,000 long-stay resident days. 1.76
In line with Nevada average

Nevada average: 1.82

ED visits per 1,000 days Info Number of outpatient emergency department visits per 1,000 long-stay resident days. 0.91
39% better than Nevada average

Nevada average: 1.50

Short-stay resident measures
Average Nevada avg: 3.1 Info CMS star rating based on short-stay quality measure performance. 5 stars = much above average, 1 star = much below average.
Pneumococcal Vaccine Info Percent of short-stay residents assessed and appropriately given the pneumococcal vaccine 46.8%
44% worse than Nevada average

Nevada average: 83.9%

Antipsychotic medication increase Info Percent of short-stay residents who newly received an antipsychotic medication 1.9%
8% better than Nevada average

Nevada average: 2.0%

Influenza Vaccine Info Percent of short-stay residents assessed and appropriately given the seasonal influenza vaccine 25.7%
68% worse than Nevada average

Nevada average: 80.7%

Re-hospitalized after SNF stay Info Percentage of short-stay residents who were re-hospitalized after their nursing home admission. 24.5%
5% worse than Nevada average

Nevada average: 23.4%

Emergency department visits Info Percentage of short-stay residents who had an outpatient emergency department visit. 6.3%
36% better than Nevada average

Nevada average: 9.8%

Falls with major injury Info Percentage of SNF residents who experience falls with major injury during their stay. 0.0%
100% better than Nevada average

Nevada average: 0.8%

Ability to care for self at discharge Info Percentage of residents at or above expected ability to care for themselves at discharge. 38.6%
28% worse than Nevada average

Nevada average: 53.7%

Successful return to home or community Info Rate of successful return to home or community from a skilled nursing facility. 47.5%
6% worse than Nevada average

Nevada average: 50.6%

Breakdown by payment type

Medicare

18% of new residents, usually for short-term rehab.

Typical stay 29 days

Private pay

56% of new residents, often for short stays.

Typical stay 1 - 2 months

Medicaid

27% of new residents, often for long-term daily care.

Typical stay 1 years

Facility Characteristics

Source: CMS Long-Term Care Facility Characteristics (Data as of Jan 2026)

Total residents 192
Medicare
12
6.3% of residents
Medicaid
138
71.9% of residents
Private pay or other
42
21.9% of residents
Programs & Services
Residents Group

Residents meet regularly to discuss policies, care quality, and activities

Nurse Aide Training

State-approved Nurse Aide Training and Competency Evaluation Program on-site

Active Resident Council

Organized group of residents that meets regularly to discuss facility policies, quality of life, and activities.

Finances and operations

Privately-owned community
Home revenue
$23.5M
Operating loss
-$72.4K
Privately-owned community
Home revenue
$23.5M Rank #19 / 44Revenue — State benchmarkedThis home is ranked 19th out of 44 homes in Nevada. Shows this facility's annual revenue compared to the Nevada SNF average. Higher revenue generally means more resources for staffing and capital — read alongside Payroll %.Click the rank badge to see the full State ranking.Click here to see the full State ranking.
Operating loss
-$72.4K
Payroll costs Info The portion of the home's budget spent on staff, including nurses, caregivers, and other employees who support care and operations. Rank #14 / 44Payroll — State benchmarkedThis home is ranked 14th out of 44 homes in Nevada. Shows total annual staff payroll benchmarked to the Nevada average. Higher payroll investment relative to peers often signals better staffing and less reliance on cheaper contract labor.Click the rank badge to see the full State ranking.Click here to see the full State ranking.
$11.1M
47.3% of revenue Rank #14 / 44Payroll % — State benchmarkedThis home is ranked 14th out of 44 homes in Nevada. Shows payroll as a percentage of revenue versus the Nevada average. Well-run Nevada SNFs typically land around 47–60% — the top third Statewide. Below 25% may signal understaffing or heavy agency use — read with Staffing ratings.Click the rank badge to see the full State ranking.Click here to see the full State ranking.
Other operating costs Info All remaining costs needed to run the home, such as food, utilities, building maintenance, supplies and administrative expenses.
$12.4M
Total costs $23.5M

Who this home usually serves

TYPE OF STAY

Mostly long-term care residents

Most residents stay for extended periods and receive ongoing daily care.

Managed by Tara

Administrator

Tara serves as the Administrator at Delmar Gardens of Green Valley, providing attentive and professional leadership to the community. Known for her dedication and hands-on approach, she ensures high-quality service and a warm environment for residents.

Places of interest near Delmar Gardens of Green Valley

Address 7.4 miles from city center Info Estimated distance in miles from Henderson's city center to Delmar Gardens of Green Valley's address, calculated via Google Maps. — 2.39 miles to nearest hospital (Dignity Health - St. Rose Dominican Hospital, Siena Campus - Henderson, NV)

Calculate Travel Distance to Delmar Gardens of Green Valley

Add your location

Address

Financial Assistance for
Nursing Home in Nevada

Delmar Gardens of Green Valley is located in Henderson, Nevada.
Here are the financial assistance programs available to residents in Nevada.

Get Financial aid guidance

Home and Community Based Waiver

Nevada Medicaid HCBW

Age 65+ or disabled
General Nevada resident, Medicaid-eligible, nursing home-level care need.
Income Limits (2025) ~$2,829/month 300% FBR, individual
Asset Limits $2,000 (individual), $3,000 (couple).
NV

High urban demand (e.g., Las Vegas); rural challenges.

Benefits
Personal care (5-7 hours/day) Respite (240 hours/year) Home modifications ($1,500 avg.) Meals ($6/meal)

Nevada Senior Services Program

NV SSP

Age 60+
General Nevada resident, at risk of decline.
Income Limits ~$1,800/month individual, varies
Asset Limits $5,000 individual
NV

Limited funding; rural focus.

Benefits
In-home care (3-5 hours/week) Respite (up to 10 days/year) Transportation (~5 trips/month)

Personal Care Services (PCS)

Nevada Personal Care Services

Age 19+ (65+ for seniors focus)
General Nevada resident, Medicaid-eligible, needs help with 1+ ADL.
Income Limits (2025) ~$967/month (individual); spenddown allowed.
Asset Limits $2,000 (individual), $3,000 (couple).
NV

Self-directed (family can be paid); statewide via DHHS.

Benefits
Personal care (4-6 hours/day) Limited homemaker services Respite (~200 hours/year)

Senior Rx Program

Nevada Senior Rx Program

Age 65+
General Nevada resident, enrolled in Medicare Part D, income below limit.
Income Limits (2025) ~$2,510/month (individual), ~$3,380/month (couple).
Asset Limits Not assessed.
NV

Covers up to $38.75/month premium; funded by tobacco settlement.

Benefits
Prescription drug premium assistance (~$465/year) Reducing out-of-pocket costs

Medicare Savings Program (MSP)

Nevada Medicare Savings Program

Age 65+ or disabled
General Nevada resident, Medicare Part A/B.
Income Limits (2025) ~$2,510/month (QMB), ~$3,380/month (SLMB), ~$3,598/month (QI)—individual.
Asset Limits $9,430 (individual), $14,130 (couple).
NV

Three tiers; no waitlist; includes Extra Help for Part D.

Benefits
Covers Part B premiums ($174.70/month) Deductibles ($240/year) Copays (~20%)

Nevada Caregiver Support Program (via NFCSP)

Nevada Caregiver Support Program

Age
General Caregivers of 60+ needing care or 55+ caregivers of others; Nevada resident; functional needs (2+ ADLs).
Income Limits (2025) Prioritizes ~$24,980/year (individual); no strict cap.
Asset Limits Not assessed; need-based.
NV

5 AAAs; prioritizes rural, low-income caregivers.

Benefits
Respite (4-6 hours/week or 5 days/year) Adult day care ($60/day) Training Supplies (~$500/year)

VA Aid and Attendance (A&A) and Housebound Benefits

Nevada VA Aid and Attendance/Housebound

Age 65+ or disabled veteran/spouse
General Nevada resident, wartime service, need for ADL help (A&A) or homebound.
Income Limits (2025) Net income < ~$1,984/month (veteran with dependent, A&A); pension offsets income.
Asset Limits ~$155,356 net worth limit
NV

High veteran demand in urban/rural areas.

Benefits
Cash (~$1,433-$2,642/month veteran, ~$951-$1,318 spouse) for care costs (e.g., in-home, assisted living)

Compare Nursing Home around Henderson

The information below is reported by the Nevada Department of Health and Human Services, Bureau of Health Care Quality and Compliance.

4 facilities compared · CMS & NV Dept. of Health data

Filter by care type
Lake Mead Health and Rehabilitation Center
NH

Nursing Home Licensed facility providing 24/7 skilled nursing care for residents with complex, ongoing medical needs. Staffed by RNs, LPNs, and CNAs. Inspected and star-rated annually by CMS. Accepts Medicare (short-term rehab) and Medicaid (long-term care).

AL

Assisted Living A licensed, long-term care setting for seniors or individuals with disabilities who need help with daily activities — like bathing, dressing, and medication management — but not 24-hour skilled nursing. Offers housing, meals, and around-the-clock support while aiming to maximize resident independence.

Henderson (East Lake Mead Parkway)120 70.7% -13%3.17 +11%-21%$40.4k338.32100- 20 -$5.4M$2.1M39.2%295075
Delmar Gardens of Green Valley
NH

Nursing Home Licensed facility providing 24/7 skilled nursing care for residents with complex, ongoing medical needs. Staffed by RNs, LPNs, and CNAs. Inspected and star-rated annually by CMS. Accepts Medicare (short-term rehab) and Medicaid (long-term care).

AL

Assisted Living A licensed, long-term care setting for seniors or individuals with disabilities who need help with daily activities — like bathing, dressing, and medication management — but not 24-hour skilled nursing. Offers housing, meals, and around-the-clock support while aiming to maximize resident independence.

Henderson (Green Valley South)242 72.7% -11%3.46 -31%-14%$0348.5-195- 55 Candace Dooling$23.5M$11.1M47.3%295041
Nevada State Veterans Home – Boulder City
NH

Nursing Home Licensed facility providing 24/7 skilled nursing care for residents with complex, ongoing medical needs. Staffed by RNs, LPNs, and CNAs. Inspected and star-rated annually by CMS. Accepts Medicare (short-term rehab) and Medicaid (long-term care).

AL

Assisted Living A licensed, long-term care setting for seniors or individuals with disabilities who need help with daily activities — like bathing, dressing, and medication management — but not 24-hour skilled nursing. Offers housing, meals, and around-the-clock support while aiming to maximize resident independence.

Boulder City (Veterans Memorial Drive)180 88.4% +8%- -25%-$10.4k295.81164- 3 -$25.3M$14.4M57%295081
TLC Care Center
NH

Nursing Home Licensed facility providing 24/7 skilled nursing care for residents with complex, ongoing medical needs. Staffed by RNs, LPNs, and CNAs. Inspected and star-rated annually by CMS. Accepts Medicare (short-term rehab) and Medicaid (long-term care).

AL

Assisted Living A licensed, long-term care setting for seniors or individuals with disabilities who need help with daily activities — like bathing, dressing, and medication management — but not 24-hour skilled nursing. Offers housing, meals, and around-the-clock support while aiming to maximize resident independence.

Henderson (Whitney Ranch)255 83.9% +3%3.36 -57%-17%$20.7k589.71230A+ 68 Phillip Sterling$9.3M$4.5M47.7%295071

Frequently Asked Questions about Delmar Gardens of Green Valley

What neighborhood is Delmar Gardens of Green Valley in?

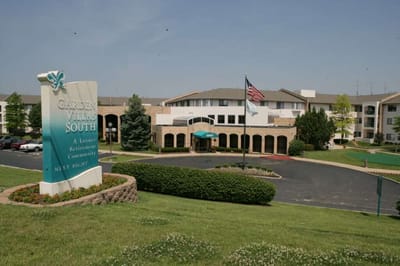
Delmar Gardens of Green Valley is in the Green Valley South neighborhood of Henderson.

Is Delmar Gardens of Green Valley in a walkable area?

Delmar Gardens of Green Valley has a walk score of 55. Moderately walkable. Some errands can be accomplished on foot, with a mix of nearby amenities.

What is the occupancy rate at Delmar Gardens of Green Valley?

Delmar Gardens of Green Valley's occupancy is 72.7%.

Who is the administrator of Delmar Gardens of Green Valley?

field_administrator is the administrator of Delmar Gardens of Green Valley.

Are there photos of Delmar Gardens of Green Valley?

Yes — there are 40 photos of Delmar Gardens of Green Valley in the photo gallery on this page.

What is the phone number of Delmar Gardens of Green Valley?

(702) 361-6111 will put you in contact with the team at Delmar Gardens of Green Valley.

Is Delmar Gardens of Green Valley Medicare or Medicaid certified?

Yes — Delmar Gardens of Green Valley is a CMS-certified provider of Medicare and Medicaid.

Guides for Better Senior Living

Care Cost Calculator: See Prices in Your Area

Nursing Home Data Explorer

Don’t Wait Too Long: 7 Red Flag Signs Your Parent Needs Assisted Living Now

The True Cost of Assisted Living in 2025 – And How Families Are Paying For It

Understanding Senior Living Costs: Pricing Models, Discounts & Financial Assistance

Explore Open Rooms
1 Contact details
2 What type of senior care service are you looking for?
3 What budget do you have in mind for senior care?
4 How soon do you need to find care?
5 Additional details

Thank you for your interest!

Our team will be in touch shortly to help with next steps.