The Chesapeake
Nursing Home, Assisted Living, Independent Living & Memory Care · Newport News, VA
CMS overall rating Info CMS (the Centers for Medicare & Medicaid Services) is the federal agency that rates nursing home quality. Its Overall Rating runs from 1 to 5 stars, combining health inspections, staffing, and quality measures, with inspections weighted most heavily.

The Chesapeake

Nursing Home, Assisted Living, Independent Living & Memory Care · Newport News, VA
CMS overall rating Info CMS (the Centers for Medicare & Medicaid Services) is the federal agency that rates nursing home quality. Its Overall Rating runs from 1 to 5 stars, combining health inspections, staffing, and quality measures, with inspections weighted most heavily.
Calculator: See prices in your area
The Chesapeake accepts Medicare and private pay.

Overview of The Chesapeake

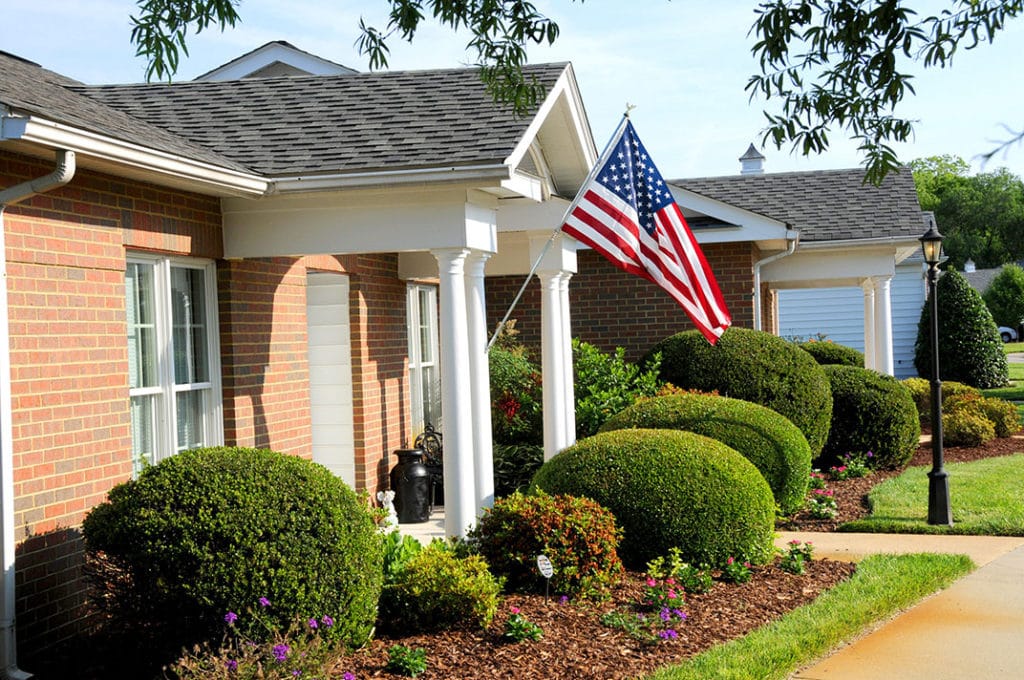
Virginia Baptist Homes Inc operates The Chesapeake, a 644-bed continuing care retirement community in the Newport News suburbs. The nonprofit, faith-affiliated facility provides independent living, assisted living, memory care, and nursing home care in a large-scale setting. Residents are predominantly private-pay (87.5% of current census), with Medicare and Medicaid comprising 8.3 and 4.2% respectively.

Occupancy has declined from 66.2% in 2022 to 55.1% in 2023. Average stays run 140 days across all care levels.

The facility earns five-star CMS ratings in health inspection, staffing, and quality measures; each category exceeding benchmarks.

Staffing investment reflects this designation: nurses and aides deliver 5 hours 9 minutes of combined care/resident/day, ranking 19th statewide. Registered nurses provide 1 hour 6 minutes of daily coverage, 61% above state norms. The staff-to-resident ratio reaches 2.04:1, outperforming the average by 23%. Physical therapist hours at 10 minutes/resident/day, are double state averages, indicating emphasis on rehabilitation infrastructure.

The facility’s most recent inspection was January 2022. That inspection identified 23 citations from an eight-year window: no critical or serious deficiencies, 21 moderate, two minor. Resident Rights concerns comprised 35% of findings. No federal penalties have been assessed.

2023 net income was negative $1.1 million, though this represents improvement from negative $2.3 million in 2022. Annual revenue totals $29.5 million. Payroll consumes 46.9% of revenue; a reasonable level for nonprofit operations but below the typical 51–60% range.

Functional decline scores of 37.5 rank 90% worse than average.

Walking ability worsened in 56.1% of residents, 184% above the average. Unintended weight loss affected 18.0% of long-stay residents, 206% above the baseline. Falls resulting in major injury occurred in 6.6% of long-stay residents, 82% above state norms. Urinary tract infections appeared in 2.3% of residents, 51% above state incidence.

High-risk clinical events score 22.3, representing 120% worse performance than average.

Measurable strengths include depressive symptoms at 3.1% (79% better than average) and antipsychotic use at 5.2% (60% better). Influenza vaccination compliance reaches 100%.

Short-stay rehabilitation residents show zero antipsychotic medication initiations versus the average of 1.2%, and zero major-injury falls versus 0.8% statewide. Successful community return reached 58.2%, 15% above baseline. Emergency department visits ran 54% lower than state norms.

The Chesapeake presents as a highly-resourced facility optimized for post-acute rehabilitation with infrastructure that does not translate into sustained functional maintenance for long-term residents.

Quality ratings

Measured by Centers for Medicare & Medicaid Services (CMS)

Overall rating Info The Overall CMS Rating combines results from health inspections, staffing levels and quality measures. Health inspections carry the most weight. Staffing and quality scores can increase or decrease the final rating based on performance compared to state and national standards.
Health Inspection Info Based on the results of the facility's three most recent standard inspections and any complaint investigations. CMS reviews the number, scope, and severity of deficiencies, with more recent findings weighted more heavily.
Staffing Info Measures average nursing staff hours per resident per day, including Registered Nurses (RNs) and total nursing staff. Ratings are adjusted based on the level of care residents require and are compared to state and national benchmarks.
Quality Measures Info Based on clinical and physical health indicators reported to CMS, such as hospital readmissions, falls, pressure ulcers, and improvements in mobility. These measures reflect how well residents' health needs are being managed.

Staffing hours breakdown

Info Daily nursing hours per resident by staff type, reported to CMS. Higher is generally better — compare this facility to state and national averages to see where staffing stands.

Hours per resident per day — compared to state averages

Total nursing care / resident Info Total adjusted nursing hours per resident per day, combining RN, LPN, and aide time. CMS adjusts this for case-mix so facilities can be fairly compared.
5h 9m per day
Rank #20 / 89Nurse hours — State benchmarkedThis home is ranked 20th out of 89 homes in Virginia. Shows adjusted nurse hours per resident per day benchmarked to the Virginia average, with a ranking across 89 Virginia facilities. More hours mean more direct care. The national average is about 3.5 hrs; below 3.0 is a red flag.Rankings are based only on facilities in Virginia that report data for that category. Facilities without available data are excluded from the ranking.Click the rank badge to see the full State ranking.Click here to see the full State ranking.
vs avg

1 of 6 metrics below state avg

Standout metric Registered Nurse (RN) is +33% above state avg
Staff typeHours / Day / Residentvs state avg
Registered Nurse (RN) Info RNs hold the highest nursing license and can assess residents, interpret test results, and direct care plans. More RN hours per day often signals stronger clinical oversight and faster response to health changes. 54m per day ▲ 33% State avg: 41m per day · National avg: 41m per day
LPN / LVN Info Licensed Practical Nurses (LPNs) or Licensed Vocational Nurses (LVNs) deliver routine hands-on care — medication administration, wound dressing, and monitoring vital signs. They work under RN supervision and make up a large share of daily bedside care. 1h 19m per day ▲ 31% State avg: 1h 0m per day · National avg: 52m per day
Nurse Aide Info Certified Nurse Aides (CNAs) provide the most direct day-to-day assistance: bathing, dressing, feeding, and mobility. Nurse aide hours are typically the largest staffing category and directly affect residents' quality of life. 2h 41m per day ▲ 27% State avg: 2h 7m per day · National avg: 2h 20m per day
Weekend Total Nursing Info Combined nursing hours (RN + LPN + Nurse Aide) per resident per day on weekends. Staffing often drops on weekends — this figure reveals whether the facility maintains adequate coverage outside of weekday hours. 4h 1m per day ▲ 21% State avg: 3h 19m per day · National avg: 3h 26m per day
Physical Therapist Info Hours per resident per day provided by licensed Physical Therapists (PTs) or PT Assistants. PT services help residents recover mobility after injury or illness and are especially important for post-acute (short-stay) rehabilitation. 7m per day ▲ 32% State avg: 5m per day · National avg: 4m per day
Weekend RN Info Registered nurse hours specifically on weekends. Facilities sometimes reduce RN presence on Saturdays and Sundays — a low weekend RN figure compared to weekday hours can indicate reduced clinical oversight when most administrative staff are absent. 23m per day ▼ 19% State avg: 28m per day · National avg: 28m per day

Capacity and availability

This home usually has availability

Lower occupancy than the state average
Occupancy rate
55.1% Rank #249 / 314Occupancy rate — State benchmarkedThis home is ranked 249th out of 314 homes in Virginia. Shows this facility's occupancy rate versus the Virginia average, with its Statewide rank out of 314. Higher occupancy signals strong local demand and financial stability.Rankings are based only on facilities in Virginia that report data for that category. Facilities without available data are excluded from the ranking.Click the rank badge to see the full State ranking.Click here to see the full State ranking.
Avg. Length of Stay
140 days
Bed community size
52-bed community Rank #304 / 371Bed count — State benchmarkedThis home is ranked 304th out of 371 homes in Virginia. Shows this facility's certified or reported bed count compared to other Virginia facilities. Larger communities may offer more amenities, programs, and on-site services for residents and families.Rankings are based only on facilities in Virginia that report data for that category. Facilities without available data are excluded from the ranking.Click the rank badge to see the full State ranking.Click here to see the full State ranking.
A moderately sized community that may balance personal attention with shared amenities and social activities.
Walk Score
Walk Score: 30 / 100 Rank #304 / 449Walk Score — State benchmarkedThis home is ranked 304th out of 449 homes in Virginia. Shows how walkable this facility's neighborhood is compared to the average Walk Score across Virginia facilities. Higher scores benefit residents, families, and staff.Rankings are based only on facilities in Virginia that report data for that category. Facilities without available data are excluded from the ranking.Click the rank badge to see the full State ranking.Click here to see the full State ranking.
Somewhat walkable. A few nearby services may be reachable on foot, but most trips require transportation.

About this community

License Details

CMS Certification Number495397

Contact The Chesapeake

Health Inspection History

Inspections since 2018
Total health inspections 3

State average N/A


Last Health inspection on Jan 2022

Total health citations
23 Rank #39 / 90Health citations — State benchmarkedThis home is ranked 39th out of 90 homes in Virginia. Shows this facility's total health deficiency citations benchmarked to the Virginia State average, with a ranking across all 90 VA facilities. Lower citation counts earn a better rank.Rankings are based only on facilities in Virginia that report data for that category. Facilities without available data are excluded from the ranking.Click the rank badge to see the full State ranking.Click here to see the full State ranking.

State average N/A

Citations per inspection
7.67 Rank #44 / 90Citations per inspection — State benchmarkedThis home is ranked 44th out of 90 homes in Virginia. Shows average deficiency citations per CMS inspection for this facility versus the Virginia mean across 90 facilities with citation data. Lower is better.Rankings are based only on facilities in Virginia that report data for that category. Facilities without available data are excluded from the ranking.Click the rank badge to see the full State ranking.Click here to see the full State ranking.

State average N/A


Health citations are formal notices following inspections when they fail to comply with safety and care standards.

All 23 citations resulted from standard inspections.

Breakdown of citation severity (last 8 years)
Critical health citations
0
In line with State average

State average: N/A


Serious health citations
0
In line with State average

State average: N/A

0 critical citations State average: N/A

0 serious citations State average: N/A

21 moderate citations State average: N/A

2 minor citations State average: N/A
Citations history (last 8 years)
Abuse/Neglect moderate citation Jan 06, 2022
Corrected

Quality of Care moderate citation Jan 06, 2022
Corrected

Care Planning moderate citation Jan 06, 2022
Corrected

Resident Rights moderate citation Jan 06, 2022
Corrected

Staffing Data

Reporting period: October 1 – December 31, 2025 (Q4 2025). Source: CMS Payroll-Based Journal report.

Total staff 98
Employees 79
Contractors 19
Staff to resident ratio 2.04 : 1
0% compared with State average

State average ratio: 0 : 0

Avg staff/day 38
Average shift 7.2 hours
0% compared with State average

State average: 0 hours

Total staff hours (quarter) 25,127

Nursing staff breakdown

Q4 2025 · Oct 1 – Dec 31 More info This data comes from the CMS Payroll-Based Journal report covering October 1 – December 31, 2025.
Registered Nurse

Manages medical care and health needs.

RN Staff Info All 9 RN Staff are full-time employees. No contractors work on this role. 9
Average shift length Info Average shift length. Calculated as total hours divided by days worked and average staff per day. 6.8 hours
Licensed Practical Nurse

Assists with medical care and medications.

LPN Staff Info All 18 LPN Staff are full-time employees. No contractors work on this role. 18
Average shift length Info Average shift length. Calculated as total hours divided by days worked and average staff per day. 8.4 hours
Certified Nursing Assistant

Helps with daily care and mobility.

CNA Staff Info 40 total: 37 full-time employees and 3 contractors. 40
Average shift length Info Average shift length. Calculated as total hours divided by days worked and average staff per day. 7.7 hours

Contractor staffing

Q4 2025 · Oct 1 – Dec 31 More info This data comes from the CMS Payroll-Based Journal report covering October 1 – December 31, 2025.

Total hours from contractors

8.5%

2,147 contractor hours this quarter

Physical Therapy Assistant: 4 Certified Nursing Assistant: 3 Physical Therapy Aide: 3 Speech Language Pathologist: 3 Respiratory Therapy Technician: 2 Qualified Social Worker: 1 Occupational Therapy Aide: 1 Medical Director: 1 Occupational Therapy Assistant: 1

Staff by category

Q4 2025 · Oct 1 – Dec 31 More info This data comes from the CMS Payroll-Based Journal report covering October 1 – December 31, 2025.
Certified Nursing Assistant3734011,49892100%7.7
Licensed Practical Nurse180185,61392100%8.4
Registered Nurse9092,03592100%6.8
Clinical Nurse Specialist5051,3506571%8
Other Dietary Services Staff4045977379%5.2
Dietitian1015186267%8.4
Nurse Practitioner2025045762%8
Mental Health Service Worker2024916267%7.9
Respiratory Therapy Technician0224736672%4.2
Physical Therapy Aide0334676065%5.2
Administrator1014085155%8
Qualified Social Worker0113876166%6.3
Speech Language Pathologist0333636267%5.7
Physical Therapy Assistant0442284953%3.7
Occupational Therapy Aide0111344145%3.3
Medical Director011423235%1.3
Occupational Therapy Assistant011213033%0.7
40 Certified Nursing Assistant
% of Days 100%
18 Licensed Practical Nurse
% of Days 100%
9 Registered Nurse
% of Days 100%
5 Clinical Nurse Specialist
% of Days 71%
4 Other Dietary Services Staff
% of Days 79%
1 Dietitian
% of Days 67%
2 Nurse Practitioner
% of Days 62%
2 Mental Health Service Worker
% of Days 67%
2 Respiratory Therapy Technician
% of Days 72%
3 Physical Therapy Aide
% of Days 65%
1 Administrator
% of Days 55%
1 Qualified Social Worker
% of Days 66%
3 Speech Language Pathologist
% of Days 67%
4 Physical Therapy Assistant
% of Days 53%
1 Occupational Therapy Aide
% of Days 45%
1 Medical Director
% of Days 35%
1 Occupational Therapy Assistant
% of Days 33%

Penalties and fines

Federal penalties imposed by CMS for regulatory violations, including civil money penalties (fines) and denials of payment for new Medicare/Medicaid admissions.

Source: CMS Penalties Database

No penalties in the past 3 years

No civil money penalties or payment denials were reported in the last 3 years.

Quality of care over time

These measures show how residents usually do over time at this home, based on health outcomes and preventive care.

High-risk clinical events score Info A composite score based on pressure ulcers, falls with injury, weight loss, walking ability decline, and activities of daily living decline. 22.3
120% worse than State average

State average: 10.1

Functional decline score Info A composite score based on activities of daily living decline, walking ability decline, and incontinence. 37.5
90% worse than State average

State average: 19.7

Long-stay resident measures
Average State avg: 3.9 Info CMS star rating based on long-stay quality measure performance. 5 stars = significantly above average, 1 star = significantly below average.
Need for Help with Daily Activities Increased Info Percent of long-stay residents whose need for help with daily activities has increased 25.2%
50% worse than State average

State average: 16.8%

Walking Ability Worsened Info Percent of long-stay residents whose ability to move independently worsened 56.1%
184% worse than State average

State average: 19.7%

Low Risk Residents with Bowel/Bladder Incontinence Info Percent of low risk long-stay residents who lose control of their bowels or bladder 31.1%
38% worse than State average

State average: 22.6%

Falls with Major Injury Info Percent of long-stay residents experiencing one or more falls with major injury 6.6%
82% worse than State average

State average: 3.6%

High Risk Residents with Pressure Ulcers Info Percent of long-stay high risk residents with pressure ulcers 5.6%
In line with State average

State average: 5.4%

Urinary Tract Infection Info Percent of long-stay residents with a urinary tract infection 2.3%
51% worse than State average

State average: 1.5%

Lost Too Much Weight Info Percent of long-stay residents who lose too much weight 18.0%
206% worse than State average

State average: 5.9%

Depressive Symptoms Info Percent of long-stay residents who have depressive symptoms 3.1%
79% better than State average

State average: 14.9%

Antipsychotic Use Info Percent of long-stay residents who received an antipsychotic medication 5.2%
60% better than State average

State average: 12.9%

Pneumococcal Vaccine Info Percent of long-stay residents assessed and appropriately given the pneumococcal vaccine 92.7%
In line with State average

State average: 91.3%

Influenza Vaccine Info Percent of long-stay residents assessed and appropriately given the seasonal influenza vaccine 100.0%
6% better than State average

State average: 94.0%

Hospitalizations per 1,000 days Info Number of hospitalizations per 1,000 long-stay resident days. 1.73
18% worse than State average

State average: 1.46

ED visits per 1,000 days Info Number of outpatient emergency department visits per 1,000 long-stay resident days. 0.87
38% better than State average

State average: 1.41

Short-stay resident measures
Significantly above average State avg: 3.9 Info CMS star rating based on short-stay quality measure performance. 5 stars = much above average, 1 star = much below average.
Pneumococcal Vaccine Info Percent of short-stay residents assessed and appropriately given the pneumococcal vaccine 83.1%
11% better than State average

State average: 74.9%

Antipsychotic medication increase Info Percent of short-stay residents who newly received an antipsychotic medication 0.0%
100% better than State average

State average: 1.2%

Influenza Vaccine Info Percent of short-stay residents assessed and appropriately given the seasonal influenza vaccine 90.7%
23% better than State average

State average: 73.6%

Re-hospitalized after SNF stay Info Percentage of short-stay residents who were re-hospitalized after their nursing home admission. 17.7%
20% better than State average

State average: 22.0%

Emergency department visits Info Percentage of short-stay residents who had an outpatient emergency department visit. 5.4%
54% better than State average

State average: 11.7%

Falls with major injury Info Percentage of SNF residents who experience falls with major injury during their stay. 0.0%
100% better than State average

State average: 0.8%

Ability to care for self at discharge Info Percentage of residents at or above expected ability to care for themselves at discharge. 57.1%
6% better than State average

State average: 53.7%

Successful return to home or community Info Rate of successful return to home or community from a skilled nursing facility. 58.2%
15% better than State average

State average: 50.6%

Breakdown by payment type

Medicare

79% of new residents, usually for short-term rehab.

Typical stay 1 - 2 months

Private pay

21% of new residents, often for short stays.

Typical stay 13 years

Facility Characteristics

Source: CMS Long-Term Care Facility Characteristics (Data as of Jan 2026)

Total residents 48
Medicare
4
8.3% of residents
Medicaid
2
4.2% of residents
Private pay or other
42
87.5% of residents
Programs & Services
Residents Group

Residents meet regularly to discuss policies, care quality, and activities

CCRC

Part of a Continuing Care Retirement Community offering multiple care levels

Active Resident Council

Organized group of residents that meets regularly to discuss facility policies, quality of life, and activities.

Finances and operations

Based on CMS SNF Cost Report for fiscal year ending in 12/2023.

Nonprofit
Nonprofit Corporation
Net patient revenue Info Net patient revenue — what the home actually collects for resident care, after contractual allowances, bad debt and discounts are subtracted from its gross charges (CMS cost report, Worksheet G-3). It covers resident care only; money the home earns from other sources is shown separately as "Other income."
$27.0M
Net patient income Info Net patient income: net patient revenue minus the home's total operating expenses. A positive figure means it earns more from resident care than it spends to deliver it; a negative figure means the opposite. It excludes non-operating "other income."
-$3.3M
Nonprofit Nonprofit Corporation
Net patient revenue Info Net patient revenue — what the home actually collects for resident care, after contractual allowances, bad debt and discounts are subtracted from its gross charges (CMS cost report, Worksheet G-3). It covers resident care only; money the home earns from other sources is shown separately as "Other income."
$27.0M Rank #38 / 89Revenue — State benchmarkedThis home is ranked 38th out of 89 homes in Virginia. Shows this facility's annual revenue compared to the Virginia average. Higher revenue generally means more resources for staffing and capital — read alongside Payroll %.Rankings are based only on facilities in Virginia that report data for that category. Facilities without available data are excluded from the ranking.Click the rank badge to see the full State ranking.Click here to see the full State ranking.
Net patient income Info Net patient income: net patient revenue minus the home's total operating expenses. A positive figure means it earns more from resident care than it spends to deliver it; a negative figure means the opposite. It excludes non-operating "other income."
-$3.3M
Other income Info Money the home earns outside of resident care — such as investments, grants, rentals and other non-operating sources (CMS cost report, Worksheet G-3). It is tracked separately from net patient revenue: it is not part of that figure, and it is not included in net patient income.
$2.2M
Payroll costs Info Staff salaries plus wage-related costs — benefits such as payroll taxes, health insurance and retirement — from the home's own accounting records (CMS cost report, Worksheet A). Contract or agency labor is counted separately, under other operating costs. Rank #25 / 89Payroll — State benchmarkedThis home is ranked 25th out of 89 homes in Virginia. Shows total annual staff payroll benchmarked to the Virginia average. Higher payroll investment relative to peers often signals better staffing and less reliance on cheaper contract labor.Rankings are based only on facilities in Virginia that report data for that category. Facilities without available data are excluded from the ranking.Click the rank badge to see the full State ranking.Click here to see the full State ranking.
$12.7M 47.1% of net patient revenue Info Payroll as a share of revenue: staff salaries and wage-related benefits divided by net patient revenue. A higher figure means more of each revenue dollar goes to staff pay. Rank #39 / 89Payroll % — State benchmarkedThis home is ranked 39th out of 89 homes in Virginia. Shows payroll as a percentage of revenue versus the Virginia average. Well-run Virginia facilities typically land around 51–60% — the top third Statewide. Below 25% may signal understaffing or heavy agency use — read with Staffing ratings.Rankings are based only on facilities in Virginia that report data for that category. Facilities without available data are excluded from the ranking.Click the rank badge to see the full State ranking.Click here to see the full State ranking.
Other operating costs Info Everything it costs to run the home apart from payroll — food, utilities, supplies, maintenance, contract labor and administration. Calculated as total operating expense minus payroll (staff salaries and wage-related benefits).
$17.5M
Total costs Info The home's total operating expense for the year — all the costs of running it, salaries included (CMS cost report, Worksheet G-3).
$30.3M

What does this home offer?

Pets allowed icon
Pets allowed icon

Pets Allowed

Room sizes icon
Room sizes icon

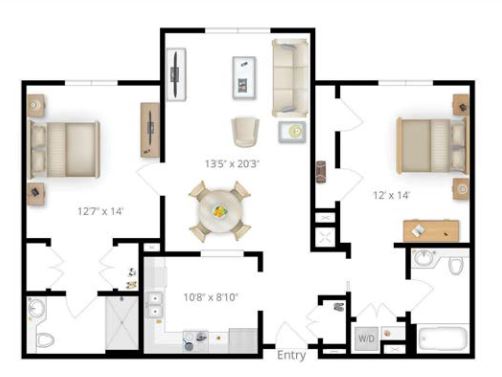
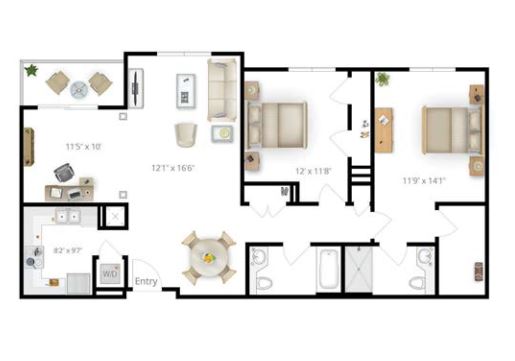
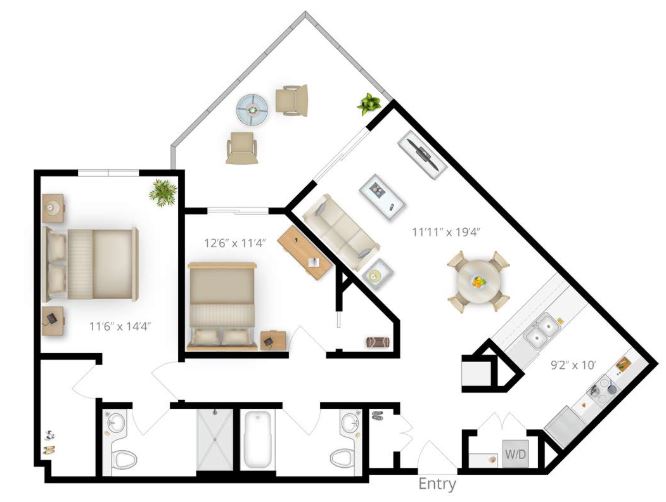
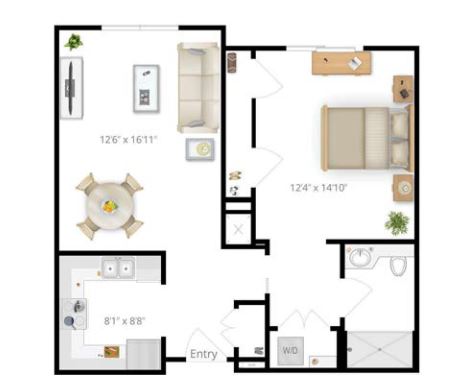
Room Sizes: 760 - 1,469 sq. ft

Housing options icon

Housing Options: 1 Bed / 2 Bed

Building type icon
Building type icon

Building Type: Mid-rise

Transportation services icon

Transportation Services

Fitness and recreation icon

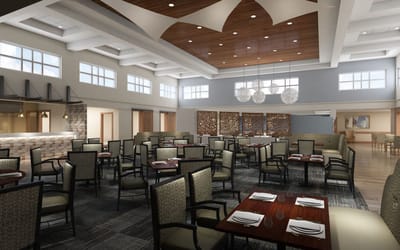
Fitness and Recreation

Who this home usually serves

TYPE OF STAY

Mostly short-term rehab stays

Most residents typically stay for a few weeks or months before returning home or moving on.

Most new residents arrive under Medicare (79% of admissions), and a typical Medicare stay runs around 1 - 2 months.

Admissions
127 total

Coverage residents most often arrive under.

Medicare 79%
Private pay 21%
Discharges
225 total

Coverage residents most often leave under.

Medicare 57%
Private pay 43%
Medicaid 1%

Living Spaces & Floor Plans for The Chesapeake

Places of interest near The Chesapeake

Address 2.1 miles from city center Info Estimated distance in miles from Newport News's city center to The Chesapeake's address, calculated via Google Maps. — 2.67 miles to nearest hospital (Riverside Regional Medical Center)

Calculate Travel Distance to The Chesapeake

Add your location

Address

Compare Nursing Homes around the area

The information below is reported by the Virginia Department of Social Services and Department of Health.

The Chesapeake
NH
AL
IL
MC
Newport News (Saunders) -52 - 30 1 Bed / 2 Bed
The Summit
NH
AL
HC
IL
MC
Lynchburg (Enterprise Drive) -50 A+ 56 1 Bed / 2 Bed
Brandermill Woods Healthcare Communities
NH
AL
IL
MC
Midlothian (Brandermill) -91 - 4 Apartment / Cottage / 1 Bed / 2 Bed / 3 Bed
The Blake at Charlottesville
NH
AL
MC
RC
Charlottesville -130 - 28 Studio / 1 Bed / 2 Bed
The Devonshire Senior Living
NH
AL
IL
MC
RC
Hampton (Coliseum Central) -61 - 63 Studio / 1 Bed / 2 Bed

Frequently Asked Questions about The Chesapeake

What neighborhood is The Chesapeake in?

The Chesapeake is in the Saunders neighborhood of Newport News.

Is The Chesapeake in a walkable area?

The Chesapeake has a walk score of 30. Somewhat walkable. A few nearby services may be reachable on foot, but most trips require transportation.

What is the occupancy rate at The Chesapeake?

The Chesapeake's occupancy is 55.1%.

Does The Chesapeake operate as a for-profit or non-profit?

The Chesapeake is registered as a non-profit in VA.

Are there photos of The Chesapeake?

Yes — there are 4 photos of The Chesapeake in the photo gallery on this page.

What is the address of The Chesapeake?

The Chesapeake is located at 955 Harpersville Rd, Newport News, VA 23601.

What is the phone number of The Chesapeake?

(757) 223-1600 will put you in contact with the team at The Chesapeake.

Guides for Better Senior Living

Care Cost Calculator: See Prices in Your Area

Nursing Home Data Explorer

Don’t Wait Too Long: 7 Red Flag Signs Your Parent Needs Assisted Living Now

The True Cost of Assisted Living in 2025 – And How Families Are Paying For It

Understanding Senior Living Costs: Pricing Models, Discounts & Financial Assistance