


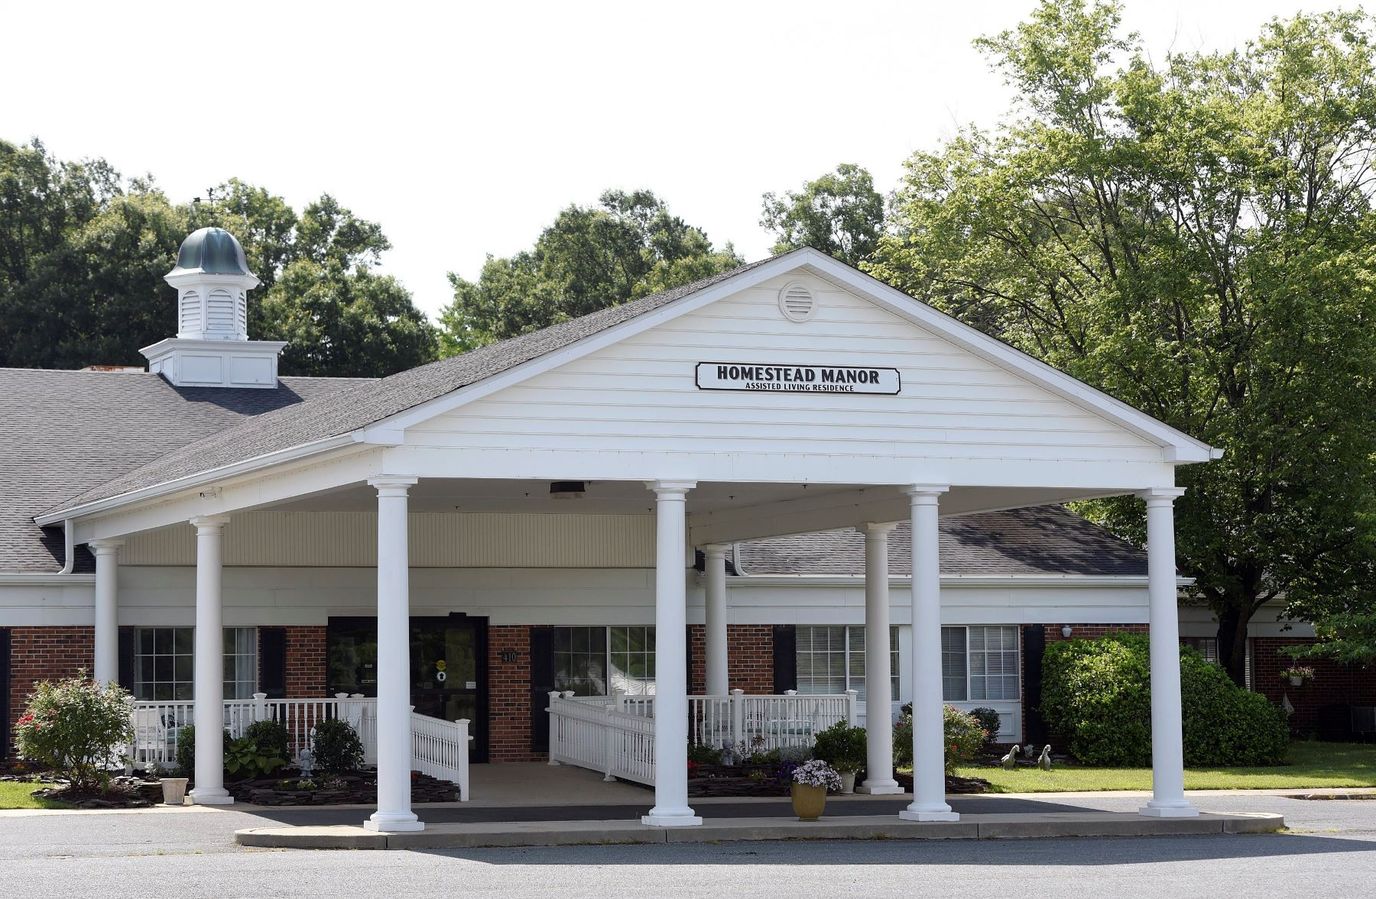
Homestead Manor Assisted Living
Assisted Living, Independent Living, Memory Care & Respite Care · Denton, MD
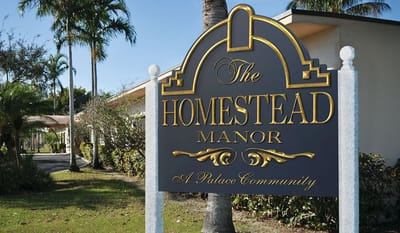

Homestead Manor Assisted Living
Assisted Living, Independent Living, Memory Care & Respite Care · Denton, MD
Homestead Manor Assisted Living sits at 410 Colonial Drive in Denton, Maryland, in a neighborhood where a car is essential; a Walk Score of 4 means buses don’t run frequently enough to matter, and neither sidewalks nor shops cluster nearby. That’s real information for families deciding whether location works.
Beds are 78.9% full. That’s below Maryland’s average and means the facility has immediate availability if you’re in a time crunch. The average resident stays about four months, suggesting the community handles both post-acute transitions and longer placements.
Financially, the facility takes Medicare, Medicaid, and private pay, removing one class of barrier to access for families already stressed about care decisions.
On staffing: 2 hours 55 minutes of nursing care per resident daily, plus 3 hours 3 minutes from nursing aides. That breaks down to 10 RNs, 16 LPNs, and 54 CNAs working from a full-time pool of 112 people. The staff-to-resident ratio lands at 1.40 per resident; not matching the state average of 1.81. Staffing levels matter for load management and burnout prevention in residential care, and this facility runs leaner than most comparable Maryland communities.
Homestead Manor serves both nursing home and assisted living residents, positioning itself for medically complex transitions and ongoing nursing-level support in a residential setting.
Walk Score: 4 / 100 Rank #916 / 985Walk Score — State benchmarkedThis home is ranked 916th out of 985 homes in Maryland for Walk Score. Shows how walkable this facility's neighborhood is compared to the average Walk Score across Maryland facilities. Higher scores benefit residents, families, and staff.Facilities with the same value for a metric share the same rank. Rankings are based only on facilities in Maryland that report data for that category. Facilities without available data are excluded from the ranking.Click the rank badge to see the full State ranking.Click here to see the full State ranking.
Car-dependent. Most errands require a car, with limited nearby walkable options.
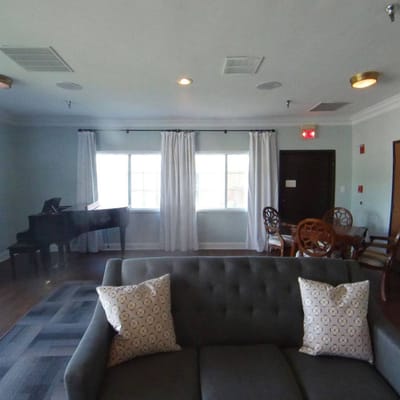
What does this home offer?
Pets Allowed
Building Type: Single-story
Transportation Services
Fitness and Recreation
Places of interest near Homestead Manor Assisted Living
![]() 1.2 miles from city center
1.2 miles from city center
![]() Estimated distance in miles from Denton's city center to Homestead Manor Assisted Living's address, calculated via Google Maps.
Estimated distance in miles from Denton's city center to Homestead Manor Assisted Living's address, calculated via Google Maps.
Calculate Travel Distance to Homestead Manor Assisted Living
Add your location
Financial Assistance for
Assisted Living in Maryland
Homestead Manor Assisted Living is located in Denton, Maryland.
Here are the financial assistance programs available to residents in Maryland.
Frequently Asked Questions about Homestead Manor Assisted Living
What neighborhood is Homestead Manor Assisted Living in?
Homestead Manor Assisted Living is in the Colonial Drive neighborhood.
Is Homestead Manor Assisted Living in a walkable area?
Homestead Manor Assisted Living has a walk score of 4. Car-dependent. Most errands require a car, with limited nearby walkable options.
Are there photos of Homestead Manor Assisted Living?
Yes — there are 4 photos of Homestead Manor Assisted Living in the photo gallery on this page.
What is the address of Homestead Manor Assisted Living?
Homestead Manor Assisted Living is located at 410 Colonial Dr, Denton, MD 21629.
What is the phone number of Homestead Manor Assisted Living?
(410) 479-2273 will put you in contact with the team at Homestead Manor Assisted Living.
Guides for Better Senior Living
Care Cost Calculator: See Prices in Your Area
Assisted Living Explorer
Don’t Wait Too Long: 7 Red Flag Signs Your Parent Needs Assisted Living Now
The True Cost of Assisted Living in 2025 – And How Families Are Paying For It
Understanding Senior Living Costs: Pricing Models, Discounts & Financial Assistance
Updated on
