Cedars Healthcare Center Rehab, Skilled Nursing & Short Term Care
CMS overall rating Info CMS (the Centers for Medicare & Medicaid Services) is the federal agency that rates nursing home quality. Its Overall Rating runs from 1 to 5 stars, combining health inspections, staffing, and quality measures, with inspections weighted most heavily.

Cedars Healthcare Center Rehab, Skilled Nursing & Short Term Care

CMS overall rating Info CMS (the Centers for Medicare & Medicaid Services) is the federal agency that rates nursing home quality. Its Overall Rating runs from 1 to 5 stars, combining health inspections, staffing, and quality measures, with inspections weighted most heavily.
Calculator: See prices in your area
Cedars Healthcare Center Rehab, Skilled Nursing & Short Term Care accepts Medicare, Medicaid, and private pay.

Overview of Cedars Healthcare Center Rehab, Skilled Nursing & Short Term Care

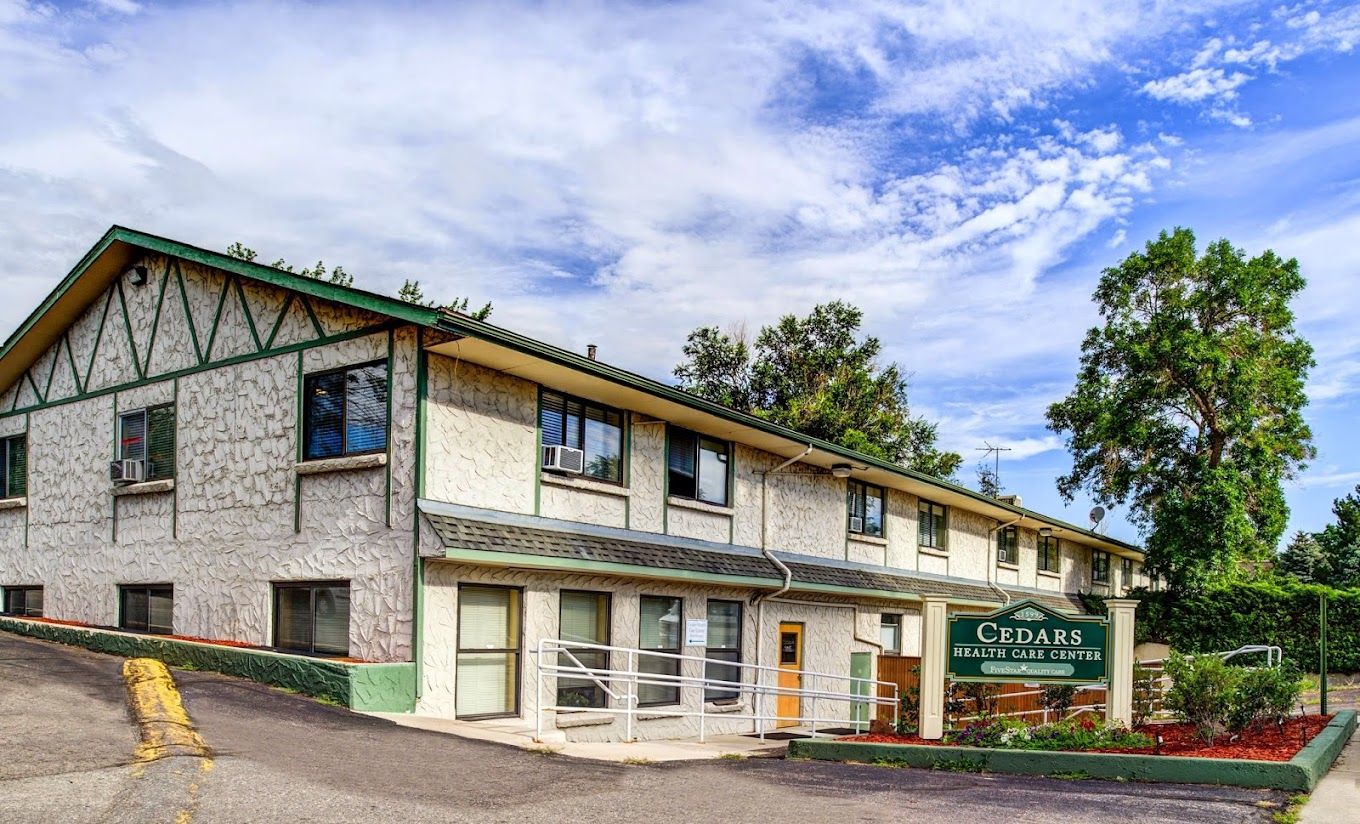
Nestled in the peaceful neighborhood of Ingalls Street, Lakewood, CO, Cedars Healthcare Center Rehab is a prominent senior living community providing skilled nursing, rehabilitation, and short-term stays. With cozy and purposely-designed accommodations, the community encourages residents to customize their chosen rooms for familiarity. Committed to providing seniors with the highest quality of care, Cedars Healthcare Center Rehab takes pride in a team of kind, compassionate, and well-trained professionals. Live a fabulous retirement and thrive with Cedars Healthcare Center Rehab.

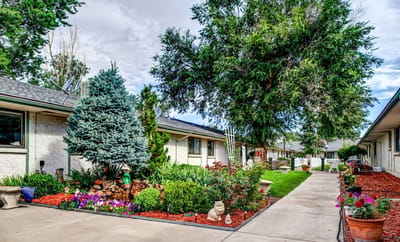
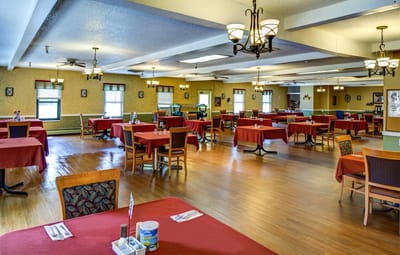
The community respects the differences of seniors, providing them with comprehensive care to meet their special needs and aspirations. Fun activities onsite and offsite are conducted for seniors’ leisure and wellness. With restaurant-style dining, residents enjoy delightful and healthy meals. Cedars Healthcare Center Rehab provides a safe place for seniors to find solace.

(303) 232-3551

Quality ratings

Measured by Centers for Medicare & Medicaid Services (CMS)

Overall rating Info The Overall CMS Rating combines results from health inspections, staffing levels and quality measures. Health inspections carry the most weight. Staffing and quality scores can increase or decrease the final rating based on performance compared to state and national standards.
▼ 36.4% Below CO avg. ▼ 36.4% Below CO avg.CO average: 3.1Click the badge to see the full State ranking.Click here to see the full State ranking.
Health Inspection Info Based on the results of the facility's three most recent standard inspections and any complaint investigations. CMS reviews the number, scope, and severity of deficiencies, with more recent findings weighted more heavily.
▼ 63.9% Below CO avg. ▼ 63.9% Below CO avg.CO average: 2.8Click the badge to see the full State ranking.Click here to see the full State ranking.
Staffing Info Measures average nursing staff hours per resident per day, including Registered Nurses (RNs) and total nursing staff. Ratings are adjusted based on the level of care residents require and are compared to state and national benchmarks.
▲ 31.6% Above CO avg. ▲ 31.6% Above CO avg.CO average: 3.0Click the badge to see the full State ranking.Click here to see the full State ranking.
Quality Measures Info Based on clinical and physical health indicators reported to CMS, such as hospital readmissions, falls, pressure ulcers, and improvements in mobility. These measures reflect how well residents' health needs are being managed.
▲ 20.5% Above CO avg. ▲ 20.5% Above CO avg.CO average: 4.1Click the badge to see the full State ranking.Click here to see the full State ranking.

Staffing hours breakdown

Info Daily nursing hours per resident by staff type, reported to CMS. Higher is generally better — compare this facility to state and national averages to see where staffing stands.

Hours per resident per day — compared to Colorado state averages

Total nursing care / resident Info This home is ranked 66th out of 215 homes in Colorado for nurse hours. Total adjusted nursing hours per resident per day, combining RN, LPN, and aide time. CMS adjusts this for case-mix so facilities can be fairly compared.
4h 2m per day
Rank #66 / 215Nurse hours — State benchmarkedThis home is ranked 66th out of 215 homes in Colorado. Shows adjusted nurse hours per resident per day benchmarked to the Colorado average, with a ranking across 215 Colorado facilities. More hours mean more direct care. The national average is about 3.5 hrs; below 3.0 is a red flag.Rankings are based only on facilities in Colorado that report data for that category. Facilities without available data are excluded from the ranking.Click the rank badge to see the full State ranking.Click here to see the full State ranking.
This facility Colorado avg (3h 52m per day)
vs Colorado avg
+5%

5 of 6 metrics below state avg

Standout metric LPN / LVN is +20% above state avg
Staff typeHours / Day / Residentvs state avg
Registered Nurse (RN) Info RNs hold the highest nursing license and can assess residents, interpret test results, and direct care plans. More RN hours per day often signals stronger clinical oversight and faster response to health changes. 29m per day ▼ 43% State avg: 50m per day · National avg: 41m per day
LPN / LVN Info Licensed Practical Nurses (LPNs) or Licensed Vocational Nurses (LVNs) deliver routine hands-on care — medication administration, wound dressing, and monitoring vital signs. They work under RN supervision and make up a large share of daily bedside care. 49m per day ▲ 20% State avg: 41m per day · National avg: 52m per day
Nurse Aide Info Certified Nurse Aides (CNAs) provide the most direct day-to-day assistance: bathing, dressing, feeding, and mobility. Nurse aide hours are typically the largest staffing category and directly affect residents' quality of life. 1h 47m per day ▼ 19% State avg: 2h 13m per day · National avg: 2h 21m per day
Weekend Total Nursing Info Combined nursing hours (RN + LPN + Nurse Aide) per resident per day on weekends. Staffing often drops on weekends — this figure reveals whether the facility maintains adequate coverage outside of weekday hours. 3h 1m per day ▼ 8% State avg: 3h 17m per day · National avg: 3h 26m per day
Physical Therapist Info Hours per resident per day provided by licensed Physical Therapists (PTs) or PT Assistants. PT services help residents recover mobility after injury or illness and are especially important for post-acute (short-stay) rehabilitation. 5m per day ▼ 6% State avg: 5m per day · National avg: 4m per day
Weekend RN Info Registered nurse hours specifically on weekends. Facilities sometimes reduce RN presence on Saturdays and Sundays — a low weekend RN figure compared to weekday hours can indicate reduced clinical oversight when most administrative staff are absent. 25m per day ▼ 30% State avg: 36m per day · National avg: 29m per day

Capacity and availability

This home usually has availability

Lower occupancy than the Colorado average: 76.5%
Occupancy rate
26.2% Rank #213 / 221Occupancy rate — State benchmarkedThis home is ranked 213th out of 221 homes in Colorado. Shows this facility's occupancy rate versus the Colorado average, with its Statewide rank out of 221. Higher occupancy signals strong local demand and financial stability.Rankings are based only on facilities in Colorado that report data for that category. Facilities without available data are excluded from the ranking.Click the rank badge to see the full State ranking.Click here to see the full State ranking.
Avg. Length of Stay
189 days
Bed community size
130-bed community Rank #66 / 533Bed count — State benchmarkedThis home is ranked 66th out of 533 homes in Colorado. Shows this facility's certified or reported bed count compared to other Colorado facilities. Larger communities may offer more amenities, programs, and on-site services for residents and families.Rankings are based only on facilities in Colorado that report data for that category. Facilities without available data are excluded from the ranking.Click the rank badge to see the full State ranking.Click here to see the full State ranking.
A larger shared setting that may offer more common spaces and organized community services.
Years in operation
53 years in operation
A longer operating history, which may indicate experience navigating regulations and delivering ongoing care.
Walk Score
Walk Score: 77 / 100 Rank #138 / 872Walk Score — State benchmarkedThis home is ranked 138th out of 872 homes in Colorado. Shows how walkable this facility's neighborhood is compared to the average Walk Score across Colorado facilities. Higher scores benefit residents, families, and staff.Rankings are based only on facilities in Colorado that report data for that category. Facilities without available data are excluded from the ranking.Click the rank badge to see the full State ranking.Click here to see the full State ranking.
Very walkable. Most errands can be accomplished on foot, and many essentials are within a short walk.
BBB Rating
BBB Rating: A+ (Not Accredited)
An independent rating from the Better Business Bureau based on factors such as complaint history, transparency, and business practices.
How BBB ratings work

Staffing

Key information about the people who lead and staff this community.

Leadership

ContactMs. Kayla Capuchino, Marketing Manager

Contact Cedars Healthcare Center Rehab, Skilled Nursing & Short Term Care

Inspection History

In Colorado, the Department of Public Health and Environment, Health Facilities Division is the regulatory body that performs unannounced surveys and publishes facility inspection findings.

Since 2021 · 5 years of data 96 deficiencies

Inspection Scorecard Info This scorecard compares key inspection, citation, and complaint metrics at this facility against the Colorado state average. Metrics rated ≥15% worse than average are highlighted in red; those ≥15% better are highlighted in green.

Since 2021 vs. Colorado state average
Overall vs. CO average 2 Worse Metrics worse than Colorado average:
• Total deficiencies (220% above)
• Deficiencies per year (220% above)
0 Better No metrics in this bucket.
Latest Inspection July 16, 2025 Enforcement

Deficiencies Info Deficiencies are formal regulatory issues recorded during state inspections.

This FacilityCO Averagevs. CO Avg
Total deficiencies Info Formal regulatory issues recorded by inspectors across all inspection types. 9630 This facility has 220% more total deficiencies than a typical Colorado nursing home (96 vs. CO avg 30).↑ 220% worse
Deficiencies per year Info Average deficiencies per year since 2021. 19.26 This facility has 220% more deficiencies per year than a typical Colorado nursing home (19.2 vs. CO avg 6).↑ 220% worse

Inspection Reports Summary Info An editor-reviewed summary of the themes and findings across this facility's recent inspection reports.

  • July 16, 2025 inspection found 2 deficiencies including immediate jeopardy for failure to manage seizures properly and maintain accurate medication records.
  • October 17, 2023 complaint investigation substantiated failures to assist a resident with mobility and to treat a non-pressure skin condition, resulting in amputation.
  • March 19, 2024 routine inspection cited 13 deficiencies across restraint use, PASRR screening, catheter care, trauma-informed care, and infection control practices.

Health Inspection History

Inspections since 2021
Total health inspections 8

Colorado average 4.8


Last Health inspection on Jul 2025

Total health citations
44 Rank #199 / 221Health citations — State benchmarkedThis home is ranked 199th out of 221 homes in Colorado. Shows this facility's total health deficiency citations benchmarked to the Colorado State average, with a ranking across all 221 CO facilities. Lower citation counts earn a better rank.Rankings are based only on facilities in Colorado that report data for that category. Facilities without available data are excluded from the ranking.Click the rank badge to see the full State ranking.Click here to see the full State ranking.

Colorado average 24.8

Citations per inspection
5.5 Rank #132 / 221Citations per inspection — State benchmarkedThis home is ranked 132nd out of 221 homes in Colorado. Shows average deficiency citations per CMS inspection for this facility versus the Colorado mean across 221 facilities with citation data. Lower is better.Rankings are based only on facilities in Colorado that report data for that category. Facilities without available data are excluded from the ranking.Click the rank badge to see the full State ranking.Click here to see the full State ranking.

Colorado average 5.2


Health citations are formal notices following inspections when they fail to comply with safety and care standards.

28 of 44 citations resulted from standard inspections; 9 of 44 resulted from complaint investigations; and 7 of 44 came from combined inspections (standard and complaint).

Breakdown of citation severity (last 5 years)
Critical health citations
2
400% worse than Colorado average

Colorado average: 0.4


Serious health citations
1
52% better than Colorado average

Colorado average: 2.1

2 critical citations Colorado average: 0.4

1 serious citation Colorado average: 2.1

39 moderate citations Colorado average: 22.2

2 minor citations Colorado average: 0.2
Citations history (last 5 years)
Quality of Care critical citation Jul 16, 2025
Corrected

Care Planning moderate citation Jul 16, 2025
Corrected

Quality of Care moderate citation Aug 20, 2024
Corrected

Abuse/Neglect moderate citation Mar 19, 2024
Corrected

Staffing Data

Reporting period: October 1 – December 31, 2025 (Q4 2025). Source: CMS Payroll-Based Journal report.

Total staff 134
Employees 89
Contractors 45
Staff to resident ratio 1.63 : 1
13% fewer staff per resident than Colorado average
Colorado average ratio: 1.88 : 1 Colorado average ratio: 1.88 : 1See full Colorado ranking
Avg staff/day 47
Average shift 8.5 hours
0% compared with Colorado average
Colorado average: 8.3 hours Colorado average shift: 8.3 hoursSee full Colorado ranking
Total staff hours (quarter) 36,576

Nursing staff breakdown

Q4 2025 · Oct 1 – Dec 31 More info This data comes from the CMS Payroll-Based Journal report covering October 1 – December 31, 2025.
Registered Nurse

Manages medical care and health needs.

RN Staff Info 16 total: 7 full-time employees and 9 contractors. 16
Average shift length Info Average shift length. Calculated as total hours divided by days worked and average staff per day. 9.6 hours
Licensed Practical Nurse

Assists with medical care and medications.

LPN Staff Info All 20 LPN Staff are full-time employees. No contractors work on this role. 20
Average shift length Info Average shift length. Calculated as total hours divided by days worked and average staff per day. 9.3 hours
Certified Nursing Assistant

Helps with daily care and mobility.

CNA Staff Info 76 total: 45 full-time employees and 31 contractors. 76
Average shift length Info Average shift length. Calculated as total hours divided by days worked and average staff per day. 8.7 hours

Contractor staffing

Q4 2025 · Oct 1 – Dec 31 More info This data comes from the CMS Payroll-Based Journal report covering October 1 – December 31, 2025.

Total hours from contractors

1.3%

489 contractor hours this quarter

Certified Nursing Assistant: 31 Registered Nurse: 9 Other Physician: 4 Medical Director: 1

Staff by category

Q4 2025 · Oct 1 – Dec 31 More info This data comes from the CMS Payroll-Based Journal report covering October 1 – December 31, 2025.
Certified Nursing Assistant45317618,37392100%8.7
Licensed Practical Nurse200208,44492100%9.3
Registered Nurse79163,08592100%9.6
Clinical Nurse Specialist3031,3918087%7.6
Dental Services Staff2029127177%6.9
Occupational Therapy Aide2029118188%6.6
Other Dietary Services Staff2028578289%7.6
Respiratory Therapy Technician3038066773%7.1
Administrator1014806470%7.5
Nurse Practitioner1014285762%7.5
Dietitian1014165863%7.2
Physical Therapy Assistant1014156470%6.5
Medical Director011241213%2
Other Physician0442367%2.9
Qualified Social Worker1011155%2.3
76 Certified Nursing Assistant
% of Days 100%
20 Licensed Practical Nurse
% of Days 100%
16 Registered Nurse
% of Days 100%
3 Clinical Nurse Specialist
% of Days 87%
2 Dental Services Staff
% of Days 77%
2 Occupational Therapy Aide
% of Days 88%
2 Other Dietary Services Staff
% of Days 89%
3 Respiratory Therapy Technician
% of Days 73%
1 Administrator
% of Days 70%
1 Nurse Practitioner
% of Days 62%
1 Dietitian
% of Days 63%
1 Physical Therapy Assistant
% of Days 70%
1 Medical Director
% of Days 13%
4 Other Physician
% of Days 7%
1 Qualified Social Worker
% of Days 5%

Penalties and fines

Includes penalties issued in 2023

Federal penalties imposed by CMS for regulatory violations, including civil money penalties (fines) and denials of payment for new Medicare/Medicaid admissions.

Source: CMS Penalties Database (Data as of Jan 2026)

Total fines amount $32K Rank #157 / 221Federal fines — State benchmarkedThis home is ranked 157th out of 221 homes in Colorado. Shows this facility's cumulative CMS federal fine dollars versus the Colorado average among facilities with fines, and where it ranks among 221 facilities in the pool. Lower total dollars mean a better rank.Rankings are based only on facilities in Colorado that report data for that category. Facilities without available data are excluded from the ranking.Click the rank badge to see the full State ranking.Click here to see the full State ranking.
20% lower than Colorado average

Colorado average: $40K

Number of fines 1
55% fewer fines than Colorado average

Colorado average: 2.2

Payment Denials Info Serious action where Medicare and/or Medicaid temporarily stops payments for new residents until issues are fixed. 0
100% fewer payment denials than Colorado average

Colorado average: 0.3

Fines amount comparison
This facility $32K
Colorado average $40K
Penalty History

Penalties are imposed by CMS for violations of federal nursing home regulations.

1 penalty in the past 3 years

Sep 27, 2023 · $32K

Civil Money Penalty Info Fines imposed for noncompliance, which can be assessed per day or per instance of violation. Sep 27, 2023
$32K

Last updated: Jan 2026

Quality of care over time

These measures show how residents usually do over time at this home, based on health outcomes and preventive care.

High-risk clinical events score Info A composite score based on pressure ulcers, falls with injury, weight loss, walking ability decline, and activities of daily living decline. 6.8
25% better than Colorado average

Colorado average: 9.0

Functional decline score Info A composite score based on activities of daily living decline, walking ability decline, and incontinence. 11.2
40% better than Colorado average

Colorado average: 18.8

Long-stay resident measures
Above average Colorado avg: 3.9 Info CMS star rating based on long-stay quality measure performance. 5 stars = significantly above average, 1 star = significantly below average.
Need for Help with Daily Activities Increased Info Percent of long-stay residents whose need for help with daily activities has increased 6.5%
59% better than Colorado average

Colorado average: 16.0%

Walking Ability Worsened Info Percent of long-stay residents whose ability to move independently worsened 12.0%
29% better than Colorado average

Colorado average: 17.0%

Low Risk Residents with Bowel/Bladder Incontinence Info Percent of low risk long-stay residents who lose control of their bowels or bladder 15.2%
35% better than Colorado average

Colorado average: 23.2%

Falls with Major Injury Info Percent of long-stay residents experiencing one or more falls with major injury 5.5%
65% worse than Colorado average

Colorado average: 3.3%

High Risk Residents with Pressure Ulcers Info Percent of long-stay high risk residents with pressure ulcers 7.2%
84% worse than Colorado average

Colorado average: 3.9%

Urinary Tract Infection Info Percent of long-stay residents with a urinary tract infection 0.8%
45% better than Colorado average

Colorado average: 1.4%

Lost Too Much Weight Info Percent of long-stay residents who lose too much weight 2.8%
46% better than Colorado average

Colorado average: 5.2%

Depressive Symptoms Info Percent of long-stay residents who have depressive symptoms 0.0%
100% better than Colorado average

Colorado average: 7.2%

Antipsychotic Use Info Percent of long-stay residents who received an antipsychotic medication 17.9%
5% better than Colorado average

Colorado average: 18.8%

Pneumococcal Vaccine Info Percent of long-stay residents assessed and appropriately given the pneumococcal vaccine 97.4%
In line with Colorado average

Colorado average: 93.3%

Influenza Vaccine Info Percent of long-stay residents assessed and appropriately given the seasonal influenza vaccine 98.1%
In line with Colorado average

Colorado average: 94.7%

Short-stay resident measures
Pneumococcal Vaccine Info Percent of short-stay residents assessed and appropriately given the pneumococcal vaccine 74.4%
In line with Colorado average

Colorado average: 76.6%

Antipsychotic medication increase Info Percent of short-stay residents who newly received an antipsychotic medication 0.0%
100% better than Colorado average

Colorado average: 1.4%

Influenza Vaccine Info Percent of short-stay residents assessed and appropriately given the seasonal influenza vaccine 81.0%
7% better than Colorado average

Colorado average: 75.6%

Breakdown by payment type

Medicare

7% of new residents, usually for short-term rehab.

Typical stay 1 - 2 months

Private pay

44% of new residents, often for short stays.

Typical stay 2 - 3 months

Medicaid

48% of new residents, often for long-term daily care.

Typical stay 1 - 2 years

Facility Characteristics

Source: CMS Long-Term Care Facility Characteristics (Data as of Jan 2026)

Total residents 82
Medicare
1
1.2% of residents
Medicaid
75
91.5% of residents
Private pay or other
6
7.3% of residents
Programs & Services
Residents Group

Residents meet regularly to discuss policies, care quality, and activities

Active Resident Council

Organized group of residents that meets regularly to discuss facility policies, quality of life, and activities.

Finances and operations

Based on CMS SNF Cost Report for fiscal year ending in 12/2023.

Privately-owned community
Operated by a single business entity.
Net patient revenue Info Net patient revenue — what the home actually collects for resident care, after contractual allowances, bad debt and discounts are subtracted from its gross charges (CMS cost report, Worksheet G-3). It covers resident care only; money the home earns from other sources is shown separately as "Other income."
$8.8M
Net patient income Info Net patient income: net patient revenue minus the home's total operating expenses. A positive figure means it earns more from resident care than it spends to deliver it; a negative figure means the opposite. It excludes non-operating "other income."
-$2.9M
Privately-owned community Operated by a single business entity.
Net patient revenue Info Net patient revenue — what the home actually collects for resident care, after contractual allowances, bad debt and discounts are subtracted from its gross charges (CMS cost report, Worksheet G-3). It covers resident care only; money the home earns from other sources is shown separately as "Other income."
$8.8M Rank #150 / 221Revenue — State benchmarkedThis home is ranked 150th out of 221 homes in Colorado. Shows this facility's annual revenue compared to the Colorado average. Higher revenue generally means more resources for staffing and capital — read alongside Payroll %.Rankings are based only on facilities in Colorado that report data for that category. Facilities without available data are excluded from the ranking.Click the rank badge to see the full State ranking.Click here to see the full State ranking.
Net patient income Info Net patient income: net patient revenue minus the home's total operating expenses. A positive figure means it earns more from resident care than it spends to deliver it; a negative figure means the opposite. It excludes non-operating "other income."
-$2.9M
Other income Info Money the home earns outside of resident care — such as investments, grants, rentals and other non-operating sources (CMS cost report, Worksheet G-3). It is tracked separately from net patient revenue: it is not part of that figure, and it is not included in net patient income.
$126.4K
Payroll costs Info Staff salaries plus wage-related costs — benefits such as payroll taxes, health insurance and retirement — from the home's own accounting records (CMS cost report, Worksheet A). Contract or agency labor is counted separately, under other operating costs. Rank #77 / 221Payroll — State benchmarkedThis home is ranked 77th out of 221 homes in Colorado. Shows total annual staff payroll benchmarked to the Colorado average. Higher payroll investment relative to peers often signals better staffing and less reliance on cheaper contract labor.Rankings are based only on facilities in Colorado that report data for that category. Facilities without available data are excluded from the ranking.Click the rank badge to see the full State ranking.Click here to see the full State ranking.
$6.9M 78.3% of net patient revenue Info Payroll as a share of revenue: staff salaries and wage-related benefits divided by net patient revenue. A higher figure means more of each revenue dollar goes to staff pay. Rank #5 / 221Payroll % — State benchmarkedThis home is ranked 5th out of 221 homes in Colorado. Shows payroll as a percentage of revenue versus the Colorado average. Well-run Colorado facilities typically land around 59–66% — the top third Statewide. Below 25% may signal understaffing or heavy agency use — read with Staffing ratings.Rankings are based only on facilities in Colorado that report data for that category. Facilities without available data are excluded from the ranking.Click the rank badge to see the full State ranking.Click here to see the full State ranking.
Other operating costs Info Everything it costs to run the home apart from payroll — food, utilities, supplies, maintenance, contract labor and administration. Calculated as total operating expense minus payroll (staff salaries and wage-related benefits).
$4.8M
Total costs Info The home's total operating expense for the year — all the costs of running it, salaries included (CMS cost report, Worksheet G-3).
$11.7M

What does this home offer?

Building type icon
Building type icon

Building Type: Two-story

Transportation services icon

Transportation Services

Fitness and recreation icon

Fitness and Recreation

Who this home usually serves

TYPE OF STAY

Mostly long-term care residents

Most residents stay for extended periods and receive ongoing daily care.

New residents most often arrive under Medicaid (48% of admissions), and a typical Medicaid stay runs around 1 - 2 years.

Admissions
81 total

Coverage residents most often arrive under.

Medicare 7%
Private pay 44%
Medicaid 48%
Discharges
146 total

Coverage residents most often leave under.

Medicare 4%
Private pay 33%
Medicaid 63%

Places of interest near Cedars Healthcare Center Rehab, Skilled Nursing & Short Term Care

Address 3.4 miles from city center Info Estimated distance in miles from Lakewood's city center to Cedars Healthcare Center Rehab, Skilled Nursing & Short Term Care's address, calculated via Google Maps. — 3.87 miles to nearest hospital (CommonSpirit St. Anthony Hospital)

Calculate Travel Distance to Cedars Healthcare Center Rehab, Skilled Nursing & Short Term Care

Add your location

Address

Compare Nursing Homes around Lakewood

The information below is reported by the Colorado Department of Public Health and Environment, Health Facilities Division.

5 facilities compared · CMS & CO Dept. of Health data

Westlake Care Community
NH
Lakewood (South Alameda)
69
Facility 69
CO AVG 76
Rank #274 / 533
45.0%
Facility 45.0%
CO AVG 76.5%
Rank #189 / 221
-41%
3.98
Facility 3.98
CO AVG 3.86
Rank #66 / 215
+3%+3%
$0
Facility $0
CO AVG $39.2k
Rank #1 / 221
12
Facility 12
CO AVG 24.8
Rank #27 / 221
4.0
Facility 4.0
CO AVG 5.2
Rank #67 / 221
167A+
85
Facility 85
CO AVG 51
Rank #56 / 872
Mark Bedinger
$7.3M
Facility $7.3M
CO AVG $11.2M
Rank #192 / 221
$3.4M
Facility $3.4M
CO AVG $4.9M
Rank #168 / 221
47%
Facility 47%
CO AVG 46.6%
Rank #44 / 221
65171
Ahc of Lakewood LLC
NH
Lakewood
36
Facility 36
CO AVG 76
Rank #398 / 533
75.2%
Facility 75.2%
CO AVG 76.5%
Rank #125 / 221
-2%
5.12
Facility 5.12
CO AVG 3.86
Rank #19 / 215
+12%+33%
$72.6k
Facility $72.6k
CO AVG $39.2k
Rank #197 / 221
7
Facility 7
CO AVG 24.8
Rank #13 / 221
7.0
Facility 7.0
CO AVG 5.2
Rank #175 / 221
-32-
68
Facility 68
CO AVG 51
Rank #260 / 872
Mauricio Waintrub
$6.6M
Facility $6.6M
CO AVG $11.2M
Rank #152 / 221
$3.5M
Facility $3.5M
CO AVG $4.9M
Rank #177 / 221
52.7%
Facility 52.7%
CO AVG 46.6%
Rank #165 / 221
65435
Lakewood Villa
NH
MC
NC
Lakewood (South Alameda)
57
Facility 57
CO AVG 76
Rank #329 / 533
87.7%
Facility 87.7%
CO AVG 76.5%
Rank #61 / 221
+15%
3.82
Facility 3.82
CO AVG 3.86
Rank #88 / 215
+36%-1%
$40.0k
Facility $40.0k
CO AVG $39.2k
Rank #174 / 221
22
Facility 22
CO AVG 24.8
Rank #100 / 221
2.8
Facility 2.8
CO AVG 5.2
Rank #30 / 221
554A
85
Facility 85
CO AVG 51
Rank #56 / 872
-
$5.4M
Facility $5.4M
CO AVG $11.2M
Rank #197 / 221
$2.9M
Facility $2.9M
CO AVG $4.9M
Rank #185 / 221
54.2%
Facility 54.2%
CO AVG 46.6%
Rank #80 / 221
65408
Cedars Healthcare Center Rehab, Skilled Nursing & Short Term Care
NH
Lakewood (Edgewood)
130
Facility 130
CO AVG 76
Rank #66 / 533
26.2%
Facility 26.2%
CO AVG 76.5%
Rank #213 / 221
-66%
4.04
Facility 4.04
CO AVG 3.86
Rank #66 / 215
-15%+5%
$31.7k
Facility $31.7k
CO AVG $39.2k
Rank #157 / 221
44
Facility 44
CO AVG 24.8
Rank #199 / 221
5.5
Facility 5.5
CO AVG 5.2
Rank #132 / 221
334A+
77
Facility 77
CO AVG 51
Rank #138 / 872
Snh Proj Lincoln Trs LLC
$8.8M
Facility $8.8M
CO AVG $11.2M
Rank #150 / 221
$6.9M
Facility $6.9M
CO AVG $4.9M
Rank #77 / 221
78.3%
Facility 78.3%
CO AVG 46.6%
Rank #5 / 221
65202
Bethany Nursing and Rehab
NH
Lakewood
170
Facility 170
CO AVG 76
Rank #24 / 533
65.3%
Facility 65.3%
CO AVG 76.5%
Rank #157 / 221
-15%
3.24
Facility 3.24
CO AVG 3.86
Rank #158 / 215
-5%-16%
$217.3k
Facility $217.3k
CO AVG $39.2k
Rank #219 / 221
65
Facility 65
CO AVG 24.8
Rank #218 / 221
8.1
Facility 8.1
CO AVG 5.2
Rank #195 / 221
11119-
57
Facility 57
CO AVG 51
Rank #392 / 872
-
$12.9M
Facility $12.9M
CO AVG $11.2M
Rank #66 / 221
$8.3M
Facility $8.3M
CO AVG $4.9M
Rank #30 / 221
64.3%
Facility 64.3%
CO AVG 46.6%
Rank #28 / 221
65248

Financial Assistance for
Nursing Home in Colorado

Cedars Healthcare Center Rehab, Skilled Nursing & Short Term Care is located in Lakewood, Colorado.
Here are the financial assistance programs available to residents in Colorado.

Get Financial aid guidance

Elderly, Blind, and Disabled Waiver

Colorado Medicaid EBD Waiver

Age 65+ or disabled
General Colorado resident, Medicaid- eligible, nursing home-level care need.
Income Limits (2025) ~$2,829/month 300% FBR, individual
Asset Limits $2,000 (individual), $3,000 (couple).
CO

Requires level-of-care assessment by case manager.

Benefits
Personal care (5-7 hours/day) Respite care (up to 240 hours/year) Adult day care ($65/day) Home modifications ($1,500 avg.)

Old Age Pension (OAP) Health Care Program

Colorado OAP

Age 60+
General Colorado resident.
Income Limits ~$1,215/month individual
Asset Limits $2,000 individual
CO

Supplements SSI; limited medical coverage.

Benefits
Cash (~$100-$800/month) Limited in-home care (2-3 hours/week) Medical assistance

Program of All-Inclusive Care for the Elderly (PACE)

Colorado Medicaid PACE

Age 55+
General Colorado resident, nursing home-level care need, safe with PACE support.
Income Limits (2025) ~$2,829/month 300% FBR
Asset Limits $2,000 (individual), $3,000 (couple).
CO

Limited to specific regions (e.g., Denver, Pueblo).

Benefits
All-inclusive care—personal care (5-7 hours/day) Meals Transportation Therapy Medical visits

Home Care Allowance (HCA)

Colorado Home Care Allowance (HCA)

Age
General Seniors typically 65+, Age 5+ with disability, Colorado resident, financial/functional need.
Income Limits (2025) ~$1,004/month individual, stricter than waivers
Asset Limits $2,000 (individual), $3,000 (couple).
CO

Must need help with ADLs; not Medicaid-waiver eligible.

Benefits
Personal care (~4-6 hours/day, paid to provider) E.g. Bathing Dressing

Frequently Asked Questions about Cedars Healthcare Center Rehab, Skilled Nursing & Short Term Care

What neighborhood is Cedars Healthcare Center Rehab, Skilled Nursing & Short Term Care in?

Cedars Healthcare Center Rehab, Skilled Nursing & Short Term Care is in the Edgewood neighborhood of Lakewood.

Is Cedars Healthcare Center Rehab, Skilled Nursing & Short Term Care in a walkable area?

Cedars Healthcare Center Rehab, Skilled Nursing & Short Term Care has a walk score of 77. Very walkable. Most errands can be accomplished on foot, and many essentials are within a short walk.

What is the occupancy rate at Cedars Healthcare Center Rehab, Skilled Nursing & Short Term Care?

Cedars Healthcare Center Rehab, Skilled Nursing & Short Term Care's occupancy is 58.1%.

Are there photos of Cedars Healthcare Center Rehab, Skilled Nursing & Short Term Care?

Yes — there are 4 photos of Cedars Healthcare Center Rehab, Skilled Nursing & Short Term Care in the photo gallery on this page.

What is the address of Cedars Healthcare Center Rehab, Skilled Nursing & Short Term Care?

Cedars Healthcare Center Rehab, Skilled Nursing & Short Term Care is located at 1599 Ingalls St, Lakewood, CO 80214.

What is the phone number of Cedars Healthcare Center Rehab, Skilled Nursing & Short Term Care?

(303) 232-3551 will put you in contact with the team at Cedars Healthcare Center Rehab, Skilled Nursing & Short Term Care.

Is Cedars Healthcare Center Rehab, Skilled Nursing & Short Term Care Medicare or Medicaid certified?

Yes — Cedars Healthcare Center Rehab, Skilled Nursing & Short Term Care is a CMS-certified provider of Medicare and Medicaid.

Guides for Better Senior Living

Care Cost Calculator: See Prices in Your Area

Nursing Home Data Explorer

Don’t Wait Too Long: 7 Red Flag Signs Your Parent Needs Assisted Living Now

The True Cost of Assisted Living in 2025 – And How Families Are Paying For It

Understanding Senior Living Costs: Pricing Models, Discounts & Financial Assistance