


Humanity Family Choice, LLC
Assisted Living & Residential Care · Bowie, MD
Humanity Family Choice, LLC
Assisted Living & Residential Care · Bowie, MD
Tucked away in the peaceful neighborhood of Bowie, MD, Humanity Family Choice is a dependable senior living community that offers comprehensive assisted living services. Residents thrive and live in comfort, knowing that a dedicated team of caregivers are readily available to offer personal care, including assistance with daily living activities, grooming assistance, incontinence care, and medication management. With home maintenance services and scheduled transportation, residents live a worry-free lifestyle with more time to enjoy their retirement life.
Committed to helping residents live an active and productive life, the community offers an array of recreation, group programs, games, and entertainment. The community also makes sure residents eat healthy by offering them assistance with dietary planning and meal preparation. Here, residents enjoy the comfort of having various supportive services while maintaining their routine and sense of purpose.
5-bed community Rank #424 / 685Bed count — State benchmarkedThis home is ranked 424th out of 685 homes in Maryland for bed count. Shows this facility's certified or reported bed count compared to other Maryland facilities. Larger communities may offer more amenities, programs, and on-site services for residents and families.Facilities with the same value for a metric share the same rank. Rankings are based only on facilities in Maryland that report data for that category. Facilities without available data are excluded from the ranking.Click the rank badge to see the full State ranking.Click here to see the full State ranking.
A smaller, more intimate setting that may offer a quieter environment and closer staff-resident interactions.
Walk Score: 20 / 100 Rank #740 / 985Walk Score — State benchmarkedThis home is ranked 740th out of 985 homes in Maryland for walk score. Shows how walkable this facility's neighborhood is compared to the average walk score across Maryland facilities. Higher scores benefit residents, families, and staff.Facilities with the same value for a metric share the same rank. Rankings are based only on facilities in Maryland that report data for that category. Facilities without available data are excluded from the ranking.Click the rank badge to see the full State ranking.Click here to see the full State ranking.
Car-dependent. Most errands require a car, with limited nearby walkable options.
About this community
CountyPrince George's
No Alzheimer's certification
No mild Alzheimer's level
No moderate Alzheimer's level
No severe Alzheimer's level
What does this home offer?
No pets allowed
Housing Options: Private Rooms
Building Type: Single-story
Transportation Services
Places of interest near Humanity Family Choice, LLC
![]() 1.8 miles from city center
1.8 miles from city center
![]() Estimated distance in miles from Bowie's city center to Humanity Family Choice, LLC's address, calculated via Google Maps.
Estimated distance in miles from Bowie's city center to Humanity Family Choice, LLC's address, calculated via Google Maps.
Calculate Travel Distance to Humanity Family Choice, LLC
Add your location
Compare Assisted Living around Bowie
Info below is compiled from the MD Dept. of Health (OHCQ), senior community websites & trusted data sources such as Walk Score & BBB.
Communities are listed from highest to lowest based on our ranking methodology.
| Tribute at Melford | AL MC | Bowie (Melford Boulevard) | 140
Facility
140
MD AVG
42
Rank
#49 / 685 | Yes |
17
Facility
17
MD AVG
43
Rank
#766 / 985 | Studio / 1 Bed | 5
Facility
5
MD AVG
21
Rank
#184 / 210 | - |
32% Male Residents — State Benchmarked 32% of residents are male, compared to the Maryland average of 31%. This facility caters to a majority female resident pool (68% female), consistent with the broader assisted living trend where women significantly outnumber men. |
68% Female Residents — State Benchmarked 68% of residents are female, compared to the Maryland average of 69%. Women comprise the large majority, consistent with national assisted living demographics where women live longer and enter care facilities at higher rates. |
24% White Residents — State Benchmarked 24% of residents are reported as White, compared to the Maryland average of 81%. A lower White share than the Maryland average — the community may draw a more diverse resident mix relative to other facilities in Maryland. |
58% African American Residents — State Benchmarked 58% of residents are reported as African American or Black, compared to the Maryland average of 13%. A higher African American share than the typical Maryland average — useful context when comparing cultural fit and community composition. |
18% Other Ethnicity Residents — State Benchmarked 18% of residents fall into categories other than White or African American (combined), compared to the Maryland average of 6%. This column aggregates Hispanic, Asian, multiracial, and any other labeled groups that are not classified as White or African American. Reported subgroups in this total: Mixed Race (10%), Asian (4%), Hispanic (4%). |
16% Residents Age 65–74 — State Benchmarked 16% of residents are 65–74, compared to the Maryland average of 13%. In line with the statewide profile for this youngest senior bracket in assisted living. |
26% Residents Age 75–84 — State Benchmarked 26% of residents are 75–84, compared to the Maryland average of 31%. Below the state norm — the resident mix may skew either younger or older than this typical middle bracket. |
36% Residents Age 85–94 — State Benchmarked 36% of residents are 85–94, compared to the Maryland average of 44%. The population here skews younger than the statewide norm, which may indicate a more active, lower-acuity community. |
18% Residents Age 95+ — State Benchmarked 18% of residents are 95 or older, compared to the Maryland average of 16%. In line with the statewide profile for the oldest resident bracket. |
| Brookdale Woodward Estates | AL | Bowie (Bowie Town Center) | 100
Facility
100
MD AVG
42
Rank
#109 / 685 | No |
27
Facility
27
MD AVG
43
Rank
#668 / 985 | Studio / 1 Bed / 2 Bed | 27
Facility
27
MD AVG
21
Rank
#62 / 210 | - |
31% Male Residents — State Benchmarked 31% of residents are male, compared to the Maryland average of 31%. This facility caters to a majority female resident pool (69% female), consistent with the broader assisted living trend where women significantly outnumber men. |
69% Female Residents — State Benchmarked 69% of residents are female, compared to the Maryland average of 69%. Women comprise the large majority, consistent with national assisted living demographics where women live longer and enter care facilities at higher rates. |
29% White Residents — State Benchmarked 29% of residents are reported as White, compared to the Maryland average of 81%. A lower White share than the Maryland average — the community may draw a more diverse resident mix relative to other facilities in Maryland. |
69% African American Residents — State Benchmarked 69% of residents are reported as African American or Black, compared to the Maryland average of 13%. A higher African American share than the typical Maryland average — useful context when comparing cultural fit and community composition. |
2% Other Ethnicity Residents — State Benchmarked 2% of residents fall into categories other than White or African American (combined), compared to the Maryland average of 6%. This column aggregates Hispanic, Asian, multiracial, and any other labeled groups that are not classified as White or African American. Reported subgroups in this total: Asian (2%). |
10% Residents Age 65–74 — State Benchmarked 10% of residents are 65–74, compared to the Maryland average of 13%. Fewer younger seniors suggests the resident population skews older, likely requiring higher acuity care and more hands-on support. |
49% Residents Age 75–84 — State Benchmarked 49% of residents are 75–84, compared to the Maryland average of 31%. A high concentration in this mid-range bracket, where residents typically need moderate support with daily activities. |
33% Residents Age 85–94 — State Benchmarked 33% of residents are 85–94, compared to the Maryland average of 44%. The population here skews younger than the statewide norm, which may indicate a more active, lower-acuity community. |
6% Residents Age 95+ — State Benchmarked 6% of residents are 95 or older, compared to the Maryland average of 16%. Most residents here have not yet reached the oldest-old bracket, suggesting a younger overall community. |
| Arbor Terrace at Waugh Chapel | AL MC | Gambrills (Waugh Chapel Towne Centre) | 96
Facility
96
MD AVG
42
Rank
#131 / 685 | Yes |
47
Facility
47
MD AVG
43
Rank
#459 / 985 | - | 4
Facility
4
MD AVG
21
Rank
#195 / 210 | A+ |
30% Male Residents — State Benchmarked 30% of residents are male, compared to the Maryland average of 31%. This facility caters to a majority female resident pool (70% female), consistent with the broader assisted living trend where women significantly outnumber men. |
70% Female Residents — State Benchmarked 70% of residents are female, compared to the Maryland average of 69%. Women comprise the large majority, consistent with national assisted living demographics where women live longer and enter care facilities at higher rates. |
86% White Residents — State Benchmarked 86% of residents are reported as White, compared to the Maryland average of 81%. Close to the average for this category among assisted living facilities in Maryland with reported race/ethnicity data. |
12% African American Residents — State Benchmarked 12% of residents are reported as African American or Black, compared to the Maryland average of 13%. In line with the Maryland average for African American residents among facilities reporting this breakdown. |
3% Other Ethnicity Residents — State Benchmarked 3% of residents fall into categories other than White or African American (combined), compared to the Maryland average of 6%. This column aggregates Hispanic, Asian, multiracial, and any other labeled groups that are not classified as White or African American. Reported subgroups in this total: Asian (1%), Hawaiian/Pacific Islander (1%). |
10% Residents Age 65–74 — State Benchmarked 10% of residents are 65–74, compared to the Maryland average of 13%. Fewer younger seniors suggests the resident population skews older, likely requiring higher acuity care and more hands-on support. |
43% Residents Age 75–84 — State Benchmarked 43% of residents are 75–84, compared to the Maryland average of 31%. A high concentration in this mid-range bracket, where residents typically need moderate support with daily activities. |
39% Residents Age 85–94 — State Benchmarked 39% of residents are 85–94, compared to the Maryland average of 44%. This is typically the most common age bracket in assisted living — this facility is in line with the statewide norm. |
8% Residents Age 95+ — State Benchmarked 8% of residents are 95 or older, compared to the Maryland average of 16%. Most residents here have not yet reached the oldest-old bracket, suggesting a younger overall community. |
| Charter Senior Living of Bowie | AL MC RC | Bowie (Laurel Bowie Road) | 52
Facility
52
MD AVG
42
Rank
#209 / 685 | Yes |
30
Facility
30
MD AVG
43
Rank
#627 / 985 | Studio / 1 Bed / 2 Bed | 26
Facility
26
MD AVG
21
Rank
#77 / 210 | - |
21% Male Residents — State Benchmarked 21% of residents are male, compared to the Maryland average of 31%. This facility caters to a majority female resident pool (79% female), consistent with the broader assisted living trend where women significantly outnumber men. |
79% Female Residents — State Benchmarked 79% of residents are female, compared to the Maryland average of 69%. Women comprise the large majority, consistent with national assisted living demographics where women live longer and enter care facilities at higher rates. |
52% White Residents — State Benchmarked 52% of residents are reported as White, compared to the Maryland average of 81%. A lower White share than the Maryland average — the community may draw a more diverse resident mix relative to other facilities in Maryland. |
46% African American Residents — State Benchmarked 46% of residents are reported as African American or Black, compared to the Maryland average of 13%. A higher African American share than the typical Maryland average — useful context when comparing cultural fit and community composition. |
2% Other Ethnicity Residents — State Benchmarked 2% of residents fall into categories other than White or African American (combined), compared to the Maryland average of 6%. This column aggregates Hispanic, Asian, multiracial, and any other labeled groups that are not classified as White or African American. Reported subgroups in this total: American Indian (2%). | - | - |
83% Residents Age 85–94 — State Benchmarked 83% of residents are 85–94, compared to the Maryland average of 44%. A high concentration of very elderly residents signals a higher-acuity facility with experience caring for advanced age-related needs. |
17% Residents Age 95+ — State Benchmarked 17% of residents are 95 or older, compared to the Maryland average of 16%. In line with the statewide profile for the oldest resident bracket. |
| Humanity Family Choice, LLC | AL RESC | Bowie | 5
Facility
5
MD AVG
42
Rank
#424 / 685 | No |
20
Facility
20
MD AVG
43
Rank
#740 / 985 | Private Rooms | - | - | - | - | - | - | - | - | - | - | - |
Financial Assistance for
Assisted Living in Maryland
Humanity Family Choice, LLC is located in Bowie, Maryland.
Here are the financial assistance programs available to residents in Maryland.
More homes from the same operator
Operated by
Humanity Assisted Living Homes
Frequently Asked Questions about Humanity Family Choice, LLC
Is Humanity Family Choice, LLC in a walkable area?
Humanity Family Choice, LLC has a walk score of 20. Car-dependent. Most errands require a car, with limited nearby walkable options.
Are pets allowed at Humanity Family Choice, LLC?
No, Humanity Family Choice, LLC has a no-pet policy.
How many beds does Humanity Family Choice, LLC have?
Humanity Family Choice, LLC has 5 beds.
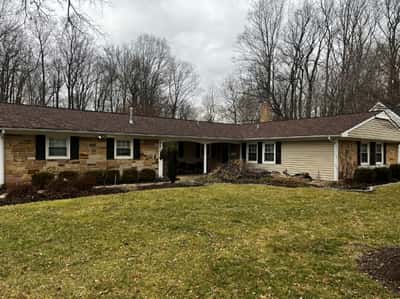
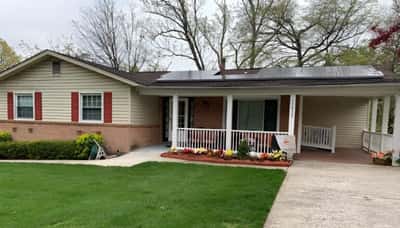
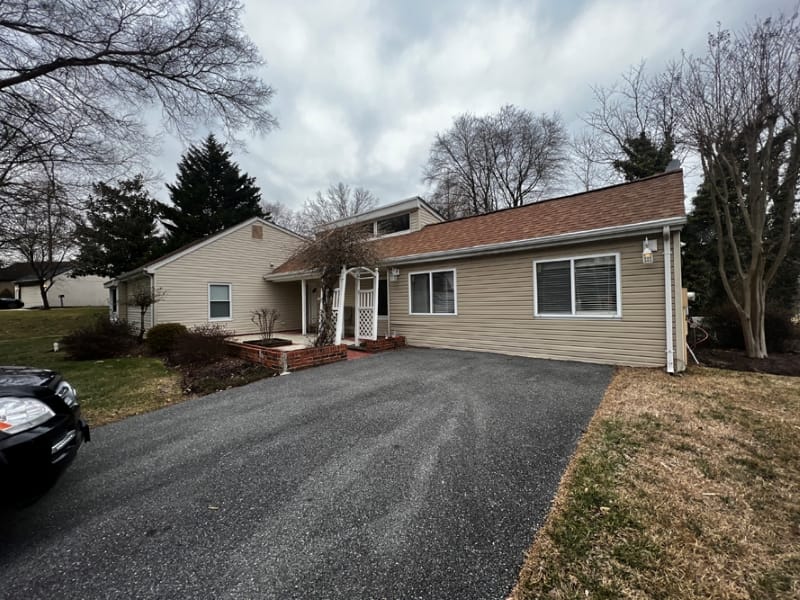
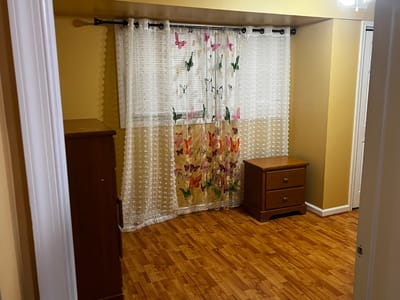
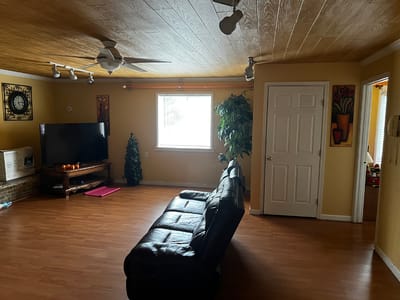
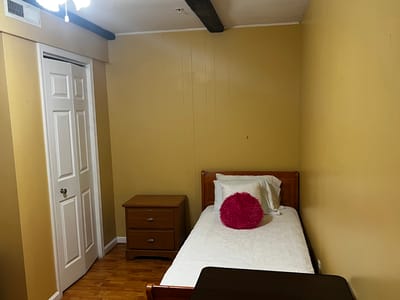
Are there photos of Humanity Family Choice, LLC?
Yes — there are 4 photos of Humanity Family Choice, LLC in the photo gallery on this page.
What is the address of Humanity Family Choice, LLC?
Humanity Family Choice, LLC is located at 2214 Pecan Ln, Bowie, MD 20716.
What is the phone number of Humanity Family Choice, LLC?
(667) 895-3577 will put you in contact with the team at Humanity Family Choice, LLC.
What county is Humanity Family Choice, LLC located in?
Humanity Family Choice, LLC is in Prince George's County.
Guides for Better Senior Living
Care Cost Calculator: See Prices in Your Area
Assisted Living Explorer
Don’t Wait Too Long: 7 Red Flag Signs Your Parent Needs Assisted Living Now
The True Cost of Assisted Living in 2025 – And How Families Are Paying For It
Understanding Senior Living Costs: Pricing Models, Discounts & Financial Assistance
Updated on
