


Kensington Park – Groves & Woodlands
Independent Living, Assisted Living & Memory Care · Kensington, MD


Kensington Park – Groves & Woodlands
Independent Living, Assisted Living & Memory Care · Kensington, MD
Overview of Kensington Park – Groves & Woodlands
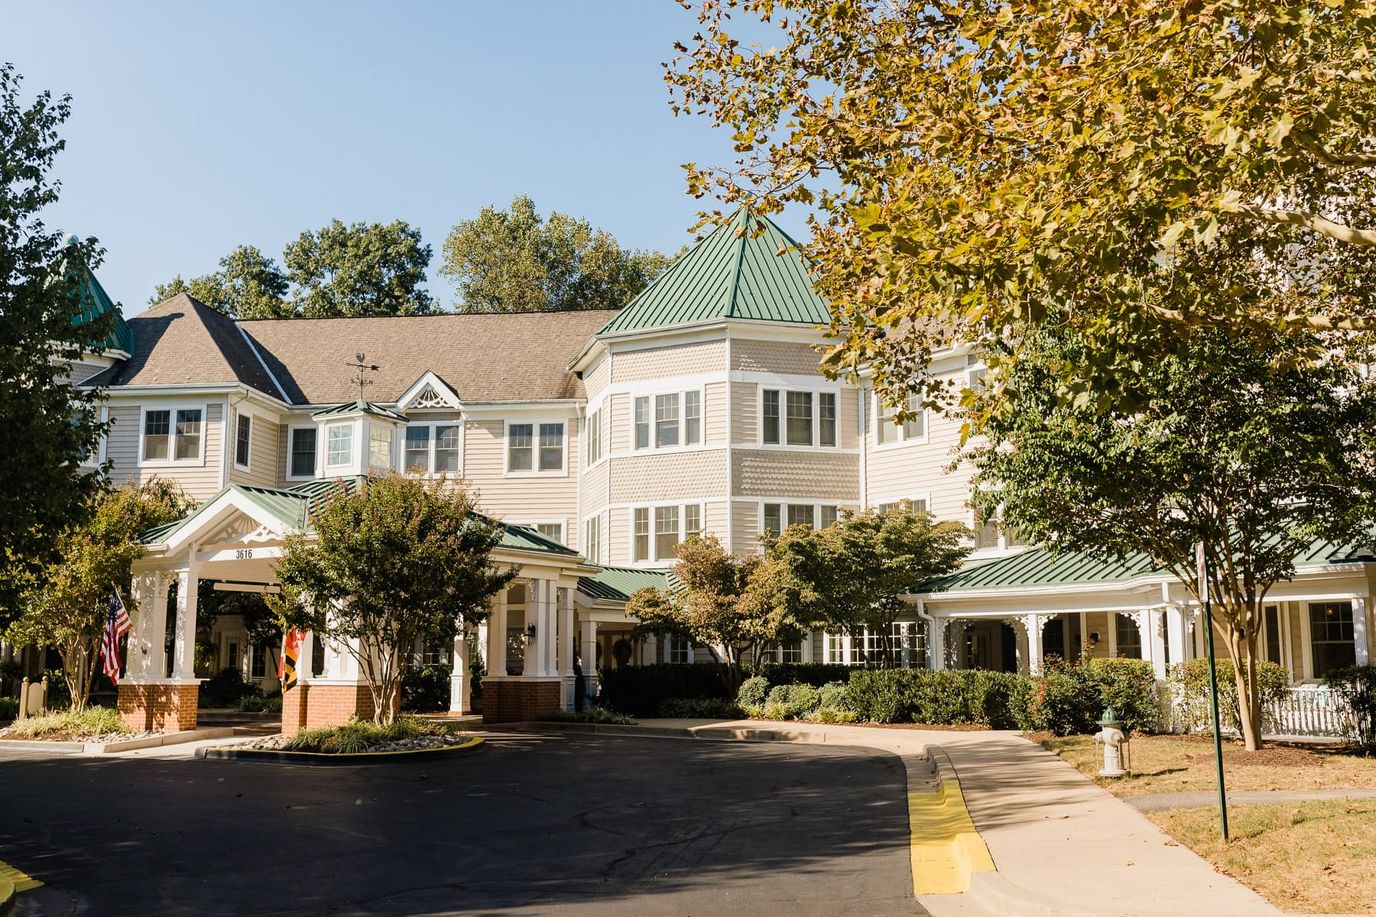
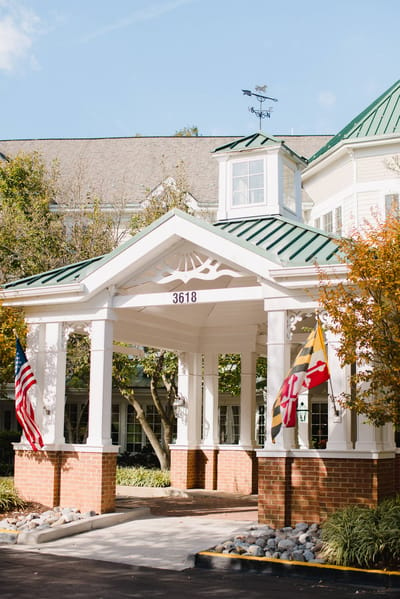
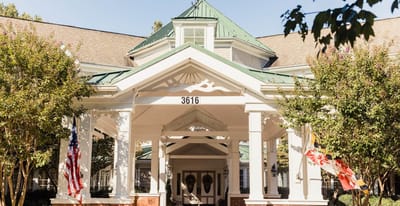
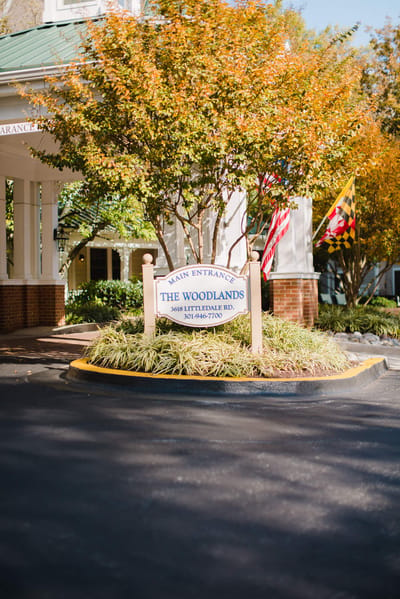
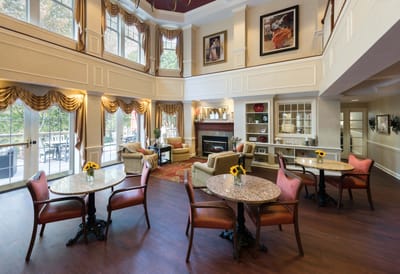
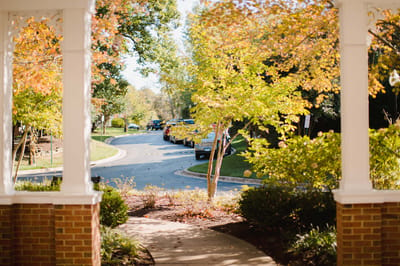
Kensington Park – Groves & Woodlands is a 160-bed senior living community located at 3616–3618 Littledale Road in Kensington, Maryland. Serving older adults in Montgomery County, the facility operates as part of Kensington Park Senior Living and provides independent living, assisted living, memory care, and rehabilitation services.
The Maryland Department of Health, Office of Health Care Quality, oversees the inspection of this facility. No specific inspection history is reported in the current source records, and the community maintains a citations-per-inspection rate of zero. No civil money penalties or payment denials appear in the available regulatory data.
The community features specialized programming including a social and lifestyle club, post-acute rehabilitation, and an in-home care extension. A dedicated couples care program is available for residents with differing care requirements. Specific details regarding staffing ratios, on-site amenities, dining menus, and monthly pricing are not reported in the source data, so families should request these details during a tour.
Situated in Kensington, the facility suits families seeking a continuum-of-care community with specific provisions for couples requiring different levels of support. Families evaluating Kensington Park – Groves & Woodlands should confirm Medicaid acceptance, current occupancy, and the full inspection history directly with the Maryland Department of Health before making a placement decision.
160-bed community Rank #27 / 685Bed count — State benchmarkedThis home is ranked 27th out of 685 homes in Maryland for bed count. Shows this facility's certified or reported bed count compared to other Maryland facilities. Larger communities may offer more amenities, programs, and on-site services for residents and families.Facilities with the same value for a metric share the same rank. Rankings are based only on facilities in Maryland that report data for that category. Facilities without available data are excluded from the ranking.Click the rank badge to see the full State ranking.Click here to see the full State ranking.
A large-scale community that may provide a wide range of amenities, services, and structured programs.
32 years in operation Rank #36 / 210Years in operation — State benchmarkedThis home is ranked 36th out of 210 homes in Maryland for years in operation. Shows how long this facility has been in operation compared to other Maryland facilities. Longer operating histories may benefit residents, families, and staff.Facilities with the same value for a metric share the same rank. Rankings are based only on facilities in Maryland that report data for that category. Facilities without available data are excluded from the ranking.Click the rank badge to see the full State ranking.Click here to see the full State ranking.
A longer operating history, which may indicate experience navigating regulations and delivering ongoing care.
Walk Score: 91 / 100 Rank #22 / 985Walk Score — State benchmarkedThis home is ranked 22nd out of 985 homes in Maryland for walk score. Shows how walkable this facility's neighborhood is compared to the average walk score across Maryland facilities. Higher scores benefit residents, families, and staff.Facilities with the same value for a metric share the same rank. Rankings are based only on facilities in Maryland that report data for that category. Facilities without available data are excluded from the ranking.Click the rank badge to see the full State ranking.Click here to see the full State ranking.
Walker's paradise. Daily errands do not require a car, with many shops and services nearby.
About this community
Facility TypeAssisted Living
IssuanceSeptember 1, 1993
CountyMontgomery
Private Room
$157 - $283 per day
Semi-Private Room
$163 - $259 per day
Rehabilitation Services
Dedicated Alzheimer's Unit
Specific ProgramsKP at Home, The Kensington Club, Couples Care
What does this home offer?
Pets Allowed
Places of interest near Kensington Park – Groves & Woodlands
![]() 0.0 miles from city center
0.0 miles from city center
![]() Estimated distance in miles from Kensington's city center to Kensington Park – Groves & Woodlands's address, calculated via Google Maps.
Estimated distance in miles from Kensington's city center to Kensington Park – Groves & Woodlands's address, calculated via Google Maps.
Calculate Travel Distance to Kensington Park – Groves & Woodlands
Add your location
Compare Independent Living around Chevy Chase
Info below is compiled from the MD Dept. of Health (OHCQ), senior community websites & trusted data sources such as Walk Score & BBB.
Communities are listed from highest to lowest based on our ranking methodology.
| Kensington Park – Groves & Woodlands | IL AL MC | Kensington | 160
Facility
160
MD AVG
42
Rank
#27 / 685 | Yes |
91
Facility
91
MD AVG
43
Rank
#22 / 985 | - | 32
Facility
32
MD AVG
21
Rank
#36 / 210 | - | - | - | - | - | - | - | - |
| Discover Village Chevy Chase | IL AL | Chevy Chase (Chevy Chase Park) | 31
Facility
31
MD AVG
42
Rank
#238 / 685 | Yes |
50
Facility
50
MD AVG
43
Rank
#419 / 985 | 1 Bed / 2 Bed | 27
Facility
27
MD AVG
21
Rank
#62 / 210 |
22% Male Residents — State Benchmarked 22% of residents are male, compared to the Maryland average of 31%. This facility caters to a majority female resident pool (78% female), consistent with the broader assisted living trend where women significantly outnumber men. |
78% Female Residents — State Benchmarked 78% of residents are female, compared to the Maryland average of 69%. Women comprise the large majority, consistent with national assisted living demographics where women live longer and enter care facilities at higher rates. |
96% White Residents — State Benchmarked 96% of residents are reported as White, compared to the Maryland average of 81%. A higher White share than is typical for assisted living in Maryland in this dataset — compare with peer facilities for local context. |
4% African American Residents — State Benchmarked 4% of residents are reported as African American or Black, compared to the Maryland average of 13%. A lower African American share than is typical in Maryland; local markets still vary widely. |
13% Residents Age 65–74 — State Benchmarked 13% of residents are 65–74, compared to the Maryland average of 13%. In line with the statewide profile for this youngest senior bracket in assisted living. |
17% Residents Age 75–84 — State Benchmarked 17% of residents are 75–84, compared to the Maryland average of 31%. Below the state norm — the resident mix may skew either younger or older than this typical middle bracket. |
48% Residents Age 85–94 — State Benchmarked 48% of residents are 85–94, compared to the Maryland average of 44%. This is typically the most common age bracket in assisted living — this facility is in line with the statewide norm. |
22% Residents Age 95+ — State Benchmarked 22% of residents are 95 or older, compared to the Maryland average of 16%. A high proportion of the oldest-old suggests strong end-of-life care experience and very-high-acuity capabilities. |
| Maplewood Park Place | IL AL MC NH SNF | Bethesda (Pooks Hill) | 29
Facility
29
MD AVG
42
Rank
#240 / 685 | Yes |
38
Facility
38
MD AVG
43
Rank
#542 / 985 | 1 Bed / 2 Bed | 30
Facility
30
MD AVG
21
Rank
#44 / 210 |
18% Male Residents — State Benchmarked 18% of residents are male, compared to the Maryland average of 31%. This facility caters to a majority female resident pool (82% female), consistent with the broader assisted living trend where women significantly outnumber men. |
82% Female Residents — State Benchmarked 82% of residents are female, compared to the Maryland average of 69%. Women comprise the large majority, consistent with national assisted living demographics where women live longer and enter care facilities at higher rates. |
100% White Residents — State Benchmarked 100% of residents are reported as White, compared to the Maryland average of 81%. A higher White share than is typical for assisted living in Maryland in this dataset — compare with peer facilities for local context. |
0% African American Residents — State Benchmarked 0% of residents are reported as African American or Black, compared to the Maryland average of 13%. A lower African American share than is typical in Maryland; local markets still vary widely. | - |
6% Residents Age 75–84 — State Benchmarked 6% of residents are 75–84, compared to the Maryland average of 31%. Below the state norm — the resident mix may skew either younger or older than this typical middle bracket. |
24% Residents Age 85–94 — State Benchmarked 24% of residents are 85–94, compared to the Maryland average of 44%. The population here skews younger than the statewide norm, which may indicate a more active, lower-acuity community. |
71% Residents Age 95+ — State Benchmarked 71% of residents are 95 or older, compared to the Maryland average of 16%. A high proportion of the oldest-old suggests strong end-of-life care experience and very-high-acuity capabilities. |
| Brightview Bethesda Woodmont | IL AL MC | Bethesda (Rugby Avenue) | - | Yes |
93
Facility
93
MD AVG
43
Rank
#13 / 985 | Deluxe Rooms | - | - | - | - | - | - | - | - | - |
| The Leggett | IL | Silver Spring (Downtown Silver Spring) | - | Yes |
82
Facility
82
MD AVG
43
Rank
#78 / 985 | 1 Bed | - | - | - | - | - | - | - | - | - |
Financial Assistance for
Independent Living in Maryland
Kensington Park – Groves & Woodlands is located in Kensington, Maryland.
Here are the financial assistance programs available to residents in Maryland.
Frequently Asked Questions about Kensington Park – Groves & Woodlands
Is Kensington Park – Groves & Woodlands in a walkable area?
Kensington Park – Groves & Woodlands has a walk score of 91. Walker's paradise. Daily errands do not require a car, with many shops and services nearby.
How long has Kensington Park – Groves & Woodlands been in business?
Kensington Park – Groves & Woodlands has been operating for approximately 32 years, based on available licensing and registration records.
Are pets allowed at Kensington Park – Groves & Woodlands?
Yes, Kensington Park – Groves & Woodlands allows residents to bring their pets.
How many beds does Kensington Park – Groves & Woodlands have?
Kensington Park – Groves & Woodlands has 160 beds.
Are there photos of Kensington Park – Groves & Woodlands?
Yes — there are 36 photos of Kensington Park – Groves & Woodlands in the photo gallery on this page.
What is the address of Kensington Park – Groves & Woodlands?
Kensington Park – Groves & Woodlands is located at 3616-3618 Littledale Road, Kensington, MD 20895.
What is the phone number of Kensington Park – Groves & Woodlands?
(301) 946-7700 will put you in contact with the team at Kensington Park – Groves & Woodlands.
Guides for Better Senior Living
Updated on
