


Rolling Meadows
Assisted Living & Respite Care · Catonsville, MD
Rolling Meadows
Assisted Living & Respite Care · Catonsville, MD
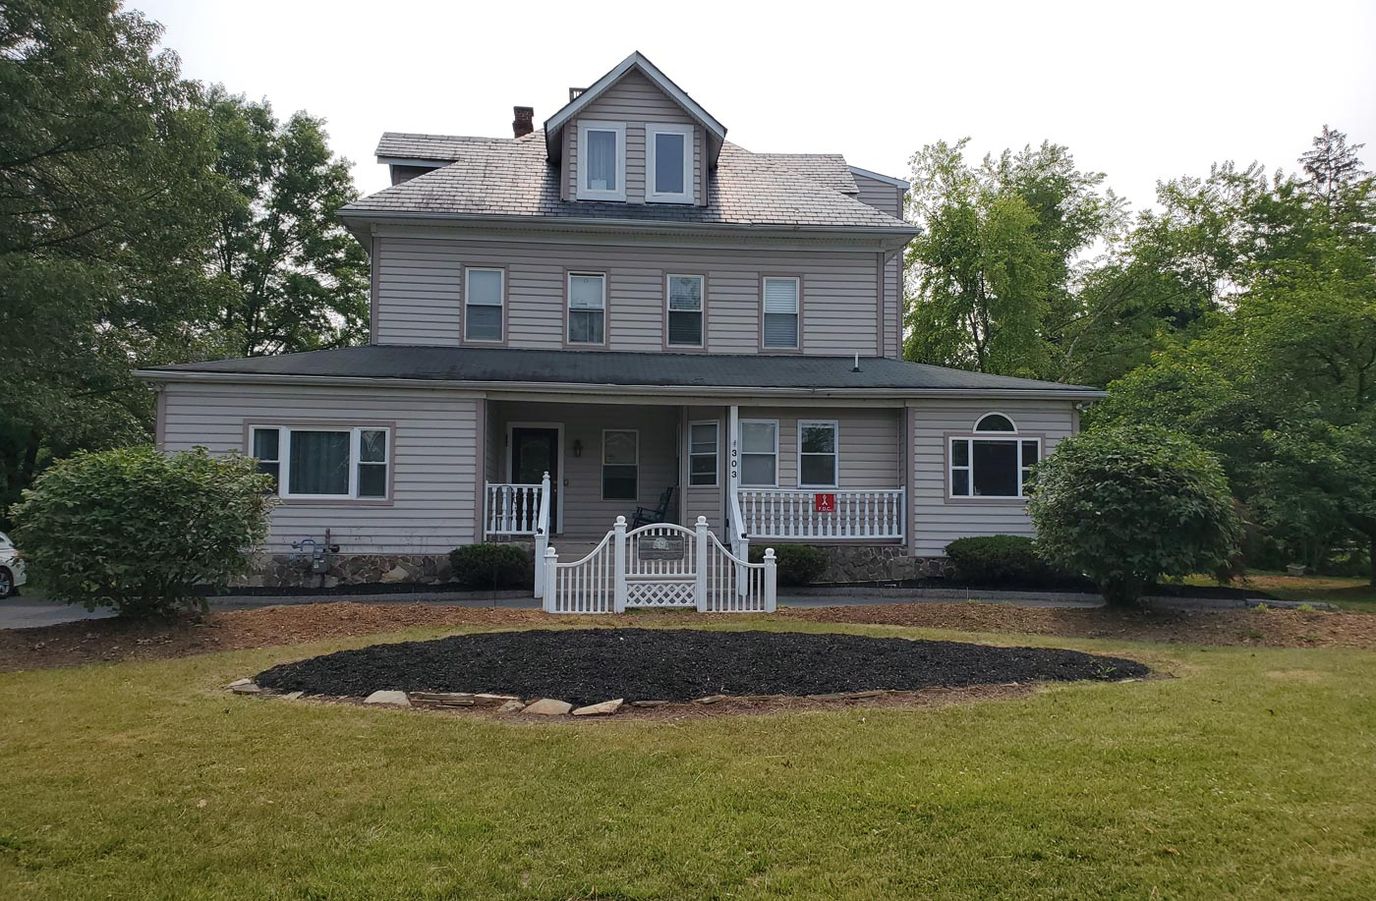
Nestled in Catonsville, Rolling Meadows designed for memory care for seniors. This upscale community fosters an individuality, with personalized care plans tailored to each resident’s unique needs. Rolling Meadows prioritizes warmth and respect in their care approach. A dedicated staff gets to know each resident, creating a personalized care plan that fosters growth and a sense of purpose. Family-like treatment ensures residents feel loved and supported.
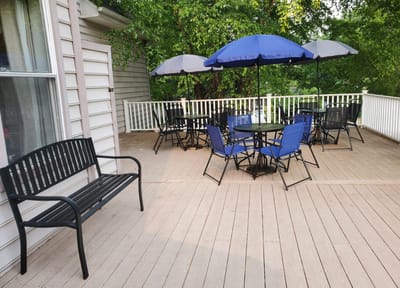
The community features a computerized wandering detection system and is equipped to handle residents prone to wandering or exhibiting challenging behaviors. A doctor is on call 24/7 for added reassurance. Rolling Meadows strives to keep residents active and engaged. They offer a social calendar with a variety of recreational activities designed to stimulate the mind and body. Residents can also enjoy delicious home-cooked meals and participate in devotional services.
15-bed community Rank #263 / 685Bed count — State benchmarkedThis home is ranked 263rd out of 685 homes in Maryland for bed count. Shows this facility's certified or reported bed count compared to other Maryland facilities. Larger communities may offer more amenities, programs, and on-site services for residents and families.Facilities with the same value for a metric share the same rank. Rankings are based only on facilities in Maryland that report data for that category. Facilities without available data are excluded from the ranking.Click the rank badge to see the full State ranking.Click here to see the full State ranking.
A smaller, more intimate setting that may offer a quieter environment and closer staff-resident interactions.
30 years in operation Rank #44 / 210Years in operation — State benchmarkedThis home is ranked 44th out of 210 homes in Maryland for years in operation. Shows how long this facility has been in operation compared to other Maryland facilities. Longer operating histories may benefit residents, families, and staff.Facilities with the same value for a metric share the same rank. Rankings are based only on facilities in Maryland that report data for that category. Facilities without available data are excluded from the ranking.Click the rank badge to see the full State ranking.Click here to see the full State ranking.
A longer operating history, which may indicate experience navigating regulations and delivering ongoing care.
Walk Score: 80 / 100 Rank #93 / 985Walk Score — State benchmarkedThis home is ranked 93rd out of 985 homes in Maryland for walk score. Shows how walkable this facility's neighborhood is compared to the average walk score across Maryland facilities. Higher scores benefit residents, families, and staff.Facilities with the same value for a metric share the same rank. Rankings are based only on facilities in Maryland that report data for that category. Facilities without available data are excluded from the ranking.Click the rank badge to see the full State ranking.Click here to see the full State ranking.
Very walkable. Most errands can be accomplished on foot, and many essentials are within a short walk.
BBB Rating: A+ (Not Accredited)
An independent rating from the Better Business Bureau based on factors such as complaint history, transparency, and business practices.
How BBB ratings work
How BBB ratings work
About this community
Facility TypeAssisted Living
CountyBaltimore
Private Room
$130 - $230 per day
Hospice Affiliations
Staffing
Key information about the people who lead and staff this community.
ContactMs. Margret Decker, President (per BBB, record updated Jul 2026)
Dedicated Alzheimer's Unit
Mild Alzheimer's Level
Moderate Alzheimer's Level
Severe Alzheimer's Level
Demographics
Resident demographic information for this facility.
Gender
- Female 73.3%
- Male 26.7%
Age Distribution
- 65-74 46.7%
- 75-84 26.7%
- 85-94 20%
- 95+ 6.7%
Ethnicity
- White 86.7%
- African American 13.3%
What does this home offer?
No pets allowed
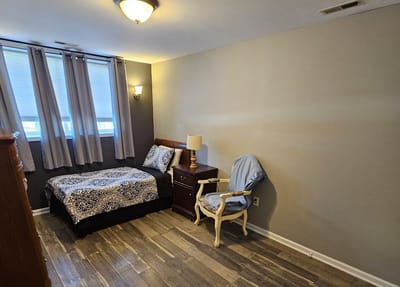
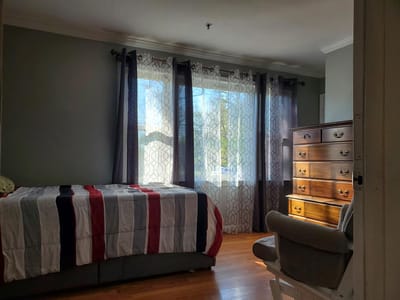
Housing Options: Private Rooms / Semi-Private Rooms
Building Type: Two-story
Transportation Services
Fitness and Recreation
Places of interest near Rolling Meadows
![]() 2.0 miles from city center
2.0 miles from city center
![]() Estimated distance in miles from Catonsville's city center to Rolling Meadows's address, calculated via Google Maps.
— 4.36 miles to nearest hospital (Ascension Saint Agnes Hospital)
Estimated distance in miles from Catonsville's city center to Rolling Meadows's address, calculated via Google Maps.
— 4.36 miles to nearest hospital (Ascension Saint Agnes Hospital)
Calculate Travel Distance to Rolling Meadows
Add your location
Compare Assisted Living around Catonsville
Info below is compiled from the MD Dept. of Health (OHCQ), senior community websites & trusted data sources such as Walk Score & BBB.
Communities are listed from highest to lowest based on our ranking methodology.
| Brightview Rolling Hills | AL MC | Catonsville (College Hills) | 81
Facility
81
MD AVG
42
Rank
#164 / 685 | Yes |
19
Facility
19
MD AVG
43
Rank
#746 / 985 | Studio / 1 Bed /2 Bed | 8
Facility
8
MD AVG
21
Rank
#164 / 210 | - |
16% Male Residents — State Benchmarked 16% of residents are male, compared to the Maryland average of 31%. This facility caters to a majority female resident pool (84% female), consistent with the broader assisted living trend where women significantly outnumber men. |
84% Female Residents — State Benchmarked 84% of residents are female, compared to the Maryland average of 69%. Women comprise the large majority, consistent with national assisted living demographics where women live longer and enter care facilities at higher rates. |
95% White Residents — State Benchmarked 95% of residents are reported as White, compared to the Maryland average of 81%. A higher White share than is typical for assisted living in Maryland in this dataset — compare with peer facilities for local context. |
3% African American Residents — State Benchmarked 3% of residents are reported as African American or Black, compared to the Maryland average of 13%. A lower African American share than is typical in Maryland; local markets still vary widely. |
2% Other Ethnicity Residents — State Benchmarked 2% of residents fall into categories other than White or African American (combined), compared to the Maryland average of 6%. This column aggregates Hispanic, Asian, multiracial, and any other labeled groups that are not classified as White or African American. Reported subgroups in this total: Asian (2%). | - |
8% Residents Age 75–84 — State Benchmarked 8% of residents are 75–84, compared to the Maryland average of 31%. Below the state norm — the resident mix may skew either younger or older than this typical middle bracket. |
83% Residents Age 85–94 — State Benchmarked 83% of residents are 85–94, compared to the Maryland average of 44%. A high concentration of very elderly residents signals a higher-acuity facility with experience caring for advanced age-related needs. |
10% Residents Age 95+ — State Benchmarked 10% of residents are 95 or older, compared to the Maryland average of 16%. Most residents here have not yet reached the oldest-old bracket, suggesting a younger overall community. |
| Peace Gardens Assisted Living | AL MC NH | Catonsville | 47
Facility
47
MD AVG
42
Rank
#217 / 685 | Yes |
60
Facility
60
MD AVG
43
Rank
#316 / 985 | - | 33
Facility
33
MD AVG
21
Rank
#25 / 210 | - |
17% Male Residents — State Benchmarked 17% of residents are male, compared to the Maryland average of 31%. This facility caters to a majority female resident pool (83% female), consistent with the broader assisted living trend where women significantly outnumber men. |
83% Female Residents — State Benchmarked 83% of residents are female, compared to the Maryland average of 69%. Women comprise the large majority, consistent with national assisted living demographics where women live longer and enter care facilities at higher rates. |
58% White Residents — State Benchmarked 58% of residents are reported as White, compared to the Maryland average of 81%. A lower White share than the Maryland average — the community may draw a more diverse resident mix relative to other facilities in Maryland. |
42% African American Residents — State Benchmarked 42% of residents are reported as African American or Black, compared to the Maryland average of 13%. A higher African American share than the typical Maryland average — useful context when comparing cultural fit and community composition. |
0% Other Ethnicity Residents — State Benchmarked 0% of residents fall into categories other than White or African American (combined), compared to the Maryland average of 6%. This column aggregates Hispanic, Asian, multiracial, and any other labeled groups that are not classified as White or African American. |
21% Residents Age 65–74 — State Benchmarked 21% of residents are 65–74, compared to the Maryland average of 13%. A higher share of younger seniors often signals a more independent, active resident community with lower acuity care needs. |
38% Residents Age 75–84 — State Benchmarked 38% of residents are 75–84, compared to the Maryland average of 31%. A high concentration in this mid-range bracket, where residents typically need moderate support with daily activities. |
29% Residents Age 85–94 — State Benchmarked 29% of residents are 85–94, compared to the Maryland average of 44%. The population here skews younger than the statewide norm, which may indicate a more active, lower-acuity community. |
8% Residents Age 95+ — State Benchmarked 8% of residents are 95 or older, compared to the Maryland average of 16%. Most residents here have not yet reached the oldest-old bracket, suggesting a younger overall community. |
| Rolling Meadows | AL RC | Catonsville (Colonial Gardens) | 15
Facility
15
MD AVG
42
Rank
#263 / 685 | No |
80
Facility
80
MD AVG
43
Rank
#93 / 985 | Private Rooms / Semi-Private Rooms | 30
Facility
30
MD AVG
21
Rank
#44 / 210 | A+ |
27% Male Residents — State Benchmarked 27% of residents are male, compared to the Maryland average of 31%. This facility caters to a majority female resident pool (73% female), consistent with the broader assisted living trend where women significantly outnumber men. |
73% Female Residents — State Benchmarked 73% of residents are female, compared to the Maryland average of 69%. Women comprise the large majority, consistent with national assisted living demographics where women live longer and enter care facilities at higher rates. |
87% White Residents — State Benchmarked 87% of residents are reported as White, compared to the Maryland average of 81%. Close to the average for this category among assisted living facilities in Maryland with reported race/ethnicity data. |
13% African American Residents — State Benchmarked 13% of residents are reported as African American or Black, compared to the Maryland average of 13%. In line with the Maryland average for African American residents among facilities reporting this breakdown. |
0% Other Ethnicity Residents — State Benchmarked 0% of residents fall into categories other than White or African American (combined), compared to the Maryland average of 6%. This column aggregates Hispanic, Asian, multiracial, and any other labeled groups that are not classified as White or African American. |
47% Residents Age 65–74 — State Benchmarked 47% of residents are 65–74, compared to the Maryland average of 13%. A higher share of younger seniors often signals a more independent, active resident community with lower acuity care needs. |
27% Residents Age 75–84 — State Benchmarked 27% of residents are 75–84, compared to the Maryland average of 31%. This is the second most common age bracket in assisted living, representing residents with moderate care needs. |
20% Residents Age 85–94 — State Benchmarked 20% of residents are 85–94, compared to the Maryland average of 44%. The population here skews younger than the statewide norm, which may indicate a more active, lower-acuity community. |
7% Residents Age 95+ — State Benchmarked 7% of residents are 95 or older, compared to the Maryland average of 16%. Most residents here have not yet reached the oldest-old bracket, suggesting a younger overall community. |
| Beechwood Assisted Living | AL | Catonsville (North Beechwood Avenue) | 15
Facility
15
MD AVG
42
Rank
#263 / 685 | Yes |
55
Facility
55
MD AVG
43
Rank
#369 / 985 | Private Rooms | 29
Facility
29
MD AVG
21
Rank
#48 / 210 | - |
29% Male Residents — State Benchmarked 29% of residents are male, compared to the Maryland average of 31%. This facility caters to a majority female resident pool (71% female), consistent with the broader assisted living trend where women significantly outnumber men. |
71% Female Residents — State Benchmarked 71% of residents are female, compared to the Maryland average of 69%. Women comprise the large majority, consistent with national assisted living demographics where women live longer and enter care facilities at higher rates. |
93% White Residents — State Benchmarked 93% of residents are reported as White, compared to the Maryland average of 81%. A higher White share than is typical for assisted living in Maryland in this dataset — compare with peer facilities for local context. |
7% African American Residents — State Benchmarked 7% of residents are reported as African American or Black, compared to the Maryland average of 13%. In line with the Maryland average for African American residents among facilities reporting this breakdown. |
0% Other Ethnicity Residents — State Benchmarked 0% of residents fall into categories other than White or African American (combined), compared to the Maryland average of 6%. This column aggregates Hispanic, Asian, multiracial, and any other labeled groups that are not classified as White or African American. |
14% Residents Age 65–74 — State Benchmarked 14% of residents are 65–74, compared to the Maryland average of 13%. In line with the statewide profile for this youngest senior bracket in assisted living. |
50% Residents Age 75–84 — State Benchmarked 50% of residents are 75–84, compared to the Maryland average of 31%. A high concentration in this mid-range bracket, where residents typically need moderate support with daily activities. |
21% Residents Age 85–94 — State Benchmarked 21% of residents are 85–94, compared to the Maryland average of 44%. The population here skews younger than the statewide norm, which may indicate a more active, lower-acuity community. |
14% Residents Age 95+ — State Benchmarked 14% of residents are 95 or older, compared to the Maryland average of 16%. In line with the statewide profile for the oldest resident bracket. |
| LifeSpring Assisted Living | AL | Catonsville | 15
Facility
15
MD AVG
42
Rank
#263 / 685 | No |
21
Facility
21
MD AVG
43
Rank
#731 / 985 | Private Rooms / Semi-Private Rooms | 27
Facility
27
MD AVG
21
Rank
#62 / 210 | - |
60% Male Residents — State Benchmarked 60% of residents are male, compared to the Maryland average of 31%. An unusually high male share for assisted living, where most facilities skew heavily female. |
40% Female Residents — State Benchmarked 40% of residents are female, compared to the Maryland average of 69%. An unusually low female share — most assisted living facilities have 65–75% female residents. |
80% White Residents — State Benchmarked 80% of residents are reported as White, compared to the Maryland average of 81%. Close to the average for this category among assisted living facilities in Maryland with reported race/ethnicity data. |
20% African American Residents — State Benchmarked 20% of residents are reported as African American or Black, compared to the Maryland average of 13%. In line with the Maryland average for African American residents among facilities reporting this breakdown. |
0% Other Ethnicity Residents — State Benchmarked 0% of residents fall into categories other than White or African American (combined), compared to the Maryland average of 6%. This column aggregates Hispanic, Asian, multiracial, and any other labeled groups that are not classified as White or African American. |
13% Residents Age 65–74 — State Benchmarked 13% of residents are 65–74, compared to the Maryland average of 13%. In line with the statewide profile for this youngest senior bracket in assisted living. |
20% Residents Age 75–84 — State Benchmarked 20% of residents are 75–84, compared to the Maryland average of 31%. Below the state norm — the resident mix may skew either younger or older than this typical middle bracket. |
53% Residents Age 85–94 — State Benchmarked 53% of residents are 85–94, compared to the Maryland average of 44%. A high concentration of very elderly residents signals a higher-acuity facility with experience caring for advanced age-related needs. |
13% Residents Age 95+ — State Benchmarked 13% of residents are 95 or older, compared to the Maryland average of 16%. In line with the statewide profile for the oldest resident bracket. |
Financial Assistance for
Assisted Living in Maryland
Rolling Meadows is located in Catonsville, Maryland.
Here are the financial assistance programs available to residents in Maryland.
Frequently Asked Questions about Rolling Meadows
What neighborhood is Rolling Meadows in?
Rolling Meadows is in the Colonial Gardens neighborhood of Catonsville.
Is Rolling Meadows in a walkable area?
Rolling Meadows has a walk score of 80. Very walkable. Most errands can be accomplished on foot, and many essentials are within a short walk.
How long has Rolling Meadows been in business?
Rolling Meadows has been operating for approximately 30 years, based on available licensing and registration records.
Are pets allowed at Rolling Meadows?
No, Rolling Meadows has a no-pet policy.
How many beds does Rolling Meadows have?
Rolling Meadows has 15 beds.
Are there photos of Rolling Meadows?
Yes — there are 4 photos of Rolling Meadows in the photo gallery on this page.
What is the address of Rolling Meadows?
Rolling Meadows is located at 303 N Rolling Rd, Catonsville, MD 21228.
Guides for Better Senior Living
Care Cost Calculator: See Prices in Your Area
Assisted Living Explorer
Don’t Wait Too Long: 7 Red Flag Signs Your Parent Needs Assisted Living Now
The True Cost of Assisted Living in 2025 – And How Families Are Paying For It
Understanding Senior Living Costs: Pricing Models, Discounts & Financial Assistance
Updated on
