


Compare Assisted Living around Frederick
The information below is reported by the Maryland Department of Health, Office of Health Care Quality.
|
|
|
|
|
|
|
|
|
|
|
|
|
|
|
|
|
|
|---|---|---|---|---|---|---|---|---|---|---|---|---|---|---|---|---|
| Homewood Living Frederick |
AL
IL
MC
NH
SNF
|
Frederick |
120
Facility
120
MD AVG
43
Rank
#76 / 690
| Yes |
14
Facility
14
MD AVG
43
Rank
#788 / 985
| 1 Bed / 2 Bed | - | - | - | - | - | - | - | - | - | - |
| Buckingham‘s Choice |
AL
MC
NH
RC
SNF
|
Adamstown (Baker Circle) |
42
Facility
42
MD AVG
43
Rank
#230 / 690
| No |
3
Facility
3
MD AVG
43
Rank
#930 / 985
| Private Rooms |
31
Facility
31
MD AVG
21
Rank
#39 / 210
| - | - | - | - | - | - | - | - | - |
| Tranquillity at Fredericktowne |
AL
MC
|
Frederick |
114
Facility
114
MD AVG
43
Rank
#89 / 690
| Yes |
38
Facility
38
MD AVG
43
Rank
#542 / 985
| Studio / 1 Bed / 2 Bed |
25
Facility
25
MD AVG
21
Rank
#83 / 210
| A+ |
25%
Male Residents — State Benchmarked 25% of residents are male, compared to the Maryland average of 31%. This facility caters to a majority female resident pool (75% female), consistent with the broader assisted living trend where women significantly outnumber men. |
75%
Female Residents — State Benchmarked 75% of residents are female, compared to the Maryland average of 69%. Women comprise the large majority, consistent with national assisted living demographics where women live longer and enter care facilities at higher rates. |
98%
White Residents — State Benchmarked 98% of residents are reported as White, compared to the Maryland average of 81%. A higher White share than is typical for assisted living in Maryland in this dataset — compare with peer facilities for local context. |
2%
Other Ethnicity Residents — State Benchmarked 2% of residents fall into categories other than White or African American (combined), compared to the Maryland average of 6%. This column aggregates Hispanic, Asian, multiracial, and any other labeled groups that are not classified as White or African American. Reported subgroups in this total: Hispanic (1%), Mixed Race (1%). |
6%
Residents Age 65–74 — State Benchmarked 6% of residents are 65–74, compared to the Maryland average of 13%. Fewer younger seniors suggests the resident population skews older, likely requiring higher acuity care and more hands-on support. |
54%
Residents Age 75–84 — State Benchmarked 54% of residents are 75–84, compared to the Maryland average of 31%. A high concentration in this mid-range bracket, where residents typically need moderate support with daily activities. |
16%
Residents Age 85–94 — State Benchmarked 16% of residents are 85–94, compared to the Maryland average of 44%. The population here skews younger than the statewide norm, which may indicate a more active, lower-acuity community. |
24%
Residents Age 95+ — State Benchmarked 24% of residents are 95 or older, compared to the Maryland average of 16%. A high proportion of the oldest-old suggests strong end-of-life care experience and very-high-acuity capabilities. |
| Sunrise of Frederick |
AL
MC
|
Frederick (Waterford) |
88
Facility
88
MD AVG
43
Rank
#157 / 690
| Yes |
62
Facility
62
MD AVG
43
Rank
#286 / 985
| Studio / Suite / 2 Bed |
45
Facility
45
MD AVG
21
Rank
#4 / 210
| A- |
31%
Male Residents — State Benchmarked 31% of residents are male, compared to the Maryland average of 31%. This facility caters to a majority female resident pool (69% female), consistent with the broader assisted living trend where women significantly outnumber men. |
69%
Female Residents — State Benchmarked 69% of residents are female, compared to the Maryland average of 69%. Women comprise the large majority, consistent with national assisted living demographics where women live longer and enter care facilities at higher rates. |
97%
White Residents — State Benchmarked 97% of residents are reported as White, compared to the Maryland average of 81%. A higher White share than is typical for assisted living in Maryland in this dataset — compare with peer facilities for local context. |
2%
Other Ethnicity Residents — State Benchmarked 2% of residents fall into categories other than White or African American (combined), compared to the Maryland average of 6%. This column aggregates Hispanic, Asian, multiracial, and any other labeled groups that are not classified as White or African American. Reported subgroups in this total: Hispanic (2%). |
10%
Residents Age 65–74 — State Benchmarked 10% of residents are 65–74, compared to the Maryland average of 13%. Fewer younger seniors suggests the resident population skews older, likely requiring higher acuity care and more hands-on support. |
34%
Residents Age 75–84 — State Benchmarked 34% of residents are 75–84, compared to the Maryland average of 31%. This is the second most common age bracket in assisted living, representing residents with moderate care needs. |
48%
Residents Age 85–94 — State Benchmarked 48% of residents are 85–94, compared to the Maryland average of 44%. This is typically the most common age bracket in assisted living — this facility is in line with the statewide norm. |
6%
Residents Age 95+ — State Benchmarked 6% of residents are 95 or older, compared to the Maryland average of 16%. Most residents here have not yet reached the oldest-old bracket, suggesting a younger overall community. |
| HeartFields Assisted Living at Frederick |
AL
MC
|
Frederick (Dearbought) |
52
Facility
52
MD AVG
43
Rank
#216 / 690
| Yes |
52
Facility
52
MD AVG
43
Rank
#402 / 985
| Studio / Suite |
27
Facility
27
MD AVG
21
Rank
#62 / 210
| - |
26%
Male Residents — State Benchmarked 26% of residents are male, compared to the Maryland average of 31%. This facility caters to a majority female resident pool (74% female), consistent with the broader assisted living trend where women significantly outnumber men. |
74%
Female Residents — State Benchmarked 74% of residents are female, compared to the Maryland average of 69%. Women comprise the large majority, consistent with national assisted living demographics where women live longer and enter care facilities at higher rates. |
93%
White Residents — State Benchmarked 93% of residents are reported as White, compared to the Maryland average of 81%. A higher White share than is typical for assisted living in Maryland in this dataset — compare with peer facilities for local context. |
0%
Other Ethnicity Residents — State Benchmarked 0% of residents fall into categories other than White or African American (combined), compared to the Maryland average of 6%. This column aggregates Hispanic, Asian, multiracial, and any other labeled groups that are not classified as White or African American. |
10%
Residents Age 65–74 — State Benchmarked 10% of residents are 65–74, compared to the Maryland average of 13%. Fewer younger seniors suggests the resident population skews older, likely requiring higher acuity care and more hands-on support. |
26%
Residents Age 75–84 — State Benchmarked 26% of residents are 75–84, compared to the Maryland average of 31%. Below the state norm — the resident mix may skew either younger or older than this typical middle bracket. |
48%
Residents Age 85–94 — State Benchmarked 48% of residents are 85–94, compared to the Maryland average of 44%. This is typically the most common age bracket in assisted living — this facility is in line with the statewide norm. |
17%
Residents Age 95+ — State Benchmarked 17% of residents are 95 or older, compared to the Maryland average of 16%. In line with the statewide profile for the oldest resident bracket. |
| Village Crossing at Worman‘s Mill – SageLife Senior Living |
AL
MC
RC
|
Frederick (Wormans Mill) |
100
Facility
100
MD AVG
43
Rank
#114 / 690
| Yes |
56
Facility
56
MD AVG
43
Rank
#357 / 985
| Studio / 1 Bed / 2 Bed |
3
Facility
3
MD AVG
21
Rank
#203 / 210
| - | - | - | - | - | - | - | - | - |
| Silverado Frederick Memory Care Community |
AL
MC
RC
|
Pike Frederick |
72
Facility
72
MD AVG
43
Rank
#184 / 690
| Yes |
20
Facility
20
MD AVG
43
Rank
#740 / 985
| Private Rooms / Semi-Private Rooms |
3
Facility
3
MD AVG
21
Rank
#203 / 210
| - | - | - | - | - | - | - | - | - |
| Spring Arbor of Frederick |
AL
MC
|
Frederick (Ballenger Creek) |
115
Facility
115
MD AVG
43
Rank
#87 / 690
| Yes |
25
Facility
25
MD AVG
43
Rank
#684 / 985
| Studio / 1 Bed / 2 Bed |
7
Facility
7
MD AVG
21
Rank
#174 / 210
| - |
31%
Male Residents — State Benchmarked 31% of residents are male, compared to the Maryland average of 31%. This facility caters to a majority female resident pool (69% female), consistent with the broader assisted living trend where women significantly outnumber men. |
69%
Female Residents — State Benchmarked 69% of residents are female, compared to the Maryland average of 69%. Women comprise the large majority, consistent with national assisted living demographics where women live longer and enter care facilities at higher rates. |
96%
White Residents — State Benchmarked 96% of residents are reported as White, compared to the Maryland average of 81%. A higher White share than is typical for assisted living in Maryland in this dataset — compare with peer facilities for local context. |
4%
Other Ethnicity Residents — State Benchmarked 4% of residents fall into categories other than White or African American (combined), compared to the Maryland average of 6%. This column aggregates Hispanic, Asian, multiracial, and any other labeled groups that are not classified as White or African American. Reported subgroups in this total: Asian (4%). |
3%
Residents Age 65–74 — State Benchmarked 3% of residents are 65–74, compared to the Maryland average of 13%. Fewer younger seniors suggests the resident population skews older, likely requiring higher acuity care and more hands-on support. |
39%
Residents Age 75–84 — State Benchmarked 39% of residents are 75–84, compared to the Maryland average of 31%. A high concentration in this mid-range bracket, where residents typically need moderate support with daily activities. |
34%
Residents Age 85–94 — State Benchmarked 34% of residents are 85–94, compared to the Maryland average of 44%. The population here skews younger than the statewide norm, which may indicate a more active, lower-acuity community. |
25%
Residents Age 95+ — State Benchmarked 25% of residents are 95 or older, compared to the Maryland average of 16%. A high proportion of the oldest-old suggests strong end-of-life care experience and very-high-acuity capabilities. |
| Country Meadows of Frederick |
AL
HOS
IL
MC
NH
RC
SNF
|
Frederick (Tulip Hill) |
160
Facility
160
MD AVG
43
Rank
#27 / 690
| Yes |
12
Facility
12
MD AVG
43
Rank
#802 / 985
| Private Rooms |
24
Facility
24
MD AVG
21
Rank
#93 / 210
| - |
33%
Male Residents — State Benchmarked 33% of residents are male, compared to the Maryland average of 31%. This facility caters to a majority female resident pool (67% female), consistent with the broader assisted living trend where women significantly outnumber men. |
67%
Female Residents — State Benchmarked 67% of residents are female, compared to the Maryland average of 69%. Women comprise the large majority, consistent with national assisted living demographics where women live longer and enter care facilities at higher rates. |
97%
White Residents — State Benchmarked 97% of residents are reported as White, compared to the Maryland average of 81%. A higher White share than is typical for assisted living in Maryland in this dataset — compare with peer facilities for local context. |
3%
Other Ethnicity Residents — State Benchmarked 3% of residents fall into categories other than White or African American (combined), compared to the Maryland average of 6%. This column aggregates Hispanic, Asian, multiracial, and any other labeled groups that are not classified as White or African American. Reported subgroups in this total: Hispanic (2%), Asian (1%). |
6%
Residents Age 65–74 — State Benchmarked 6% of residents are 65–74, compared to the Maryland average of 13%. Fewer younger seniors suggests the resident population skews older, likely requiring higher acuity care and more hands-on support. |
19%
Residents Age 75–84 — State Benchmarked 19% of residents are 75–84, compared to the Maryland average of 31%. Below the state norm — the resident mix may skew either younger or older than this typical middle bracket. |
59%
Residents Age 85–94 — State Benchmarked 59% of residents are 85–94, compared to the Maryland average of 44%. A high concentration of very elderly residents signals a higher-acuity facility with experience caring for advanced age-related needs. |
15%
Residents Age 95+ — State Benchmarked 15% of residents are 95 or older, compared to the Maryland average of 16%. In line with the statewide profile for the oldest resident bracket. |
| Warm Heart Family Assistance Living |
AL
HC
RC
SNF
|
Frederick (Fredericktowne Village) | - | No |
45
Facility
45
MD AVG
43
Rank
#475 / 985
| - |
28
Facility
28
MD AVG
21
Rank
#53 / 210
| A+ | - | - | - | - | - | - | - | - |
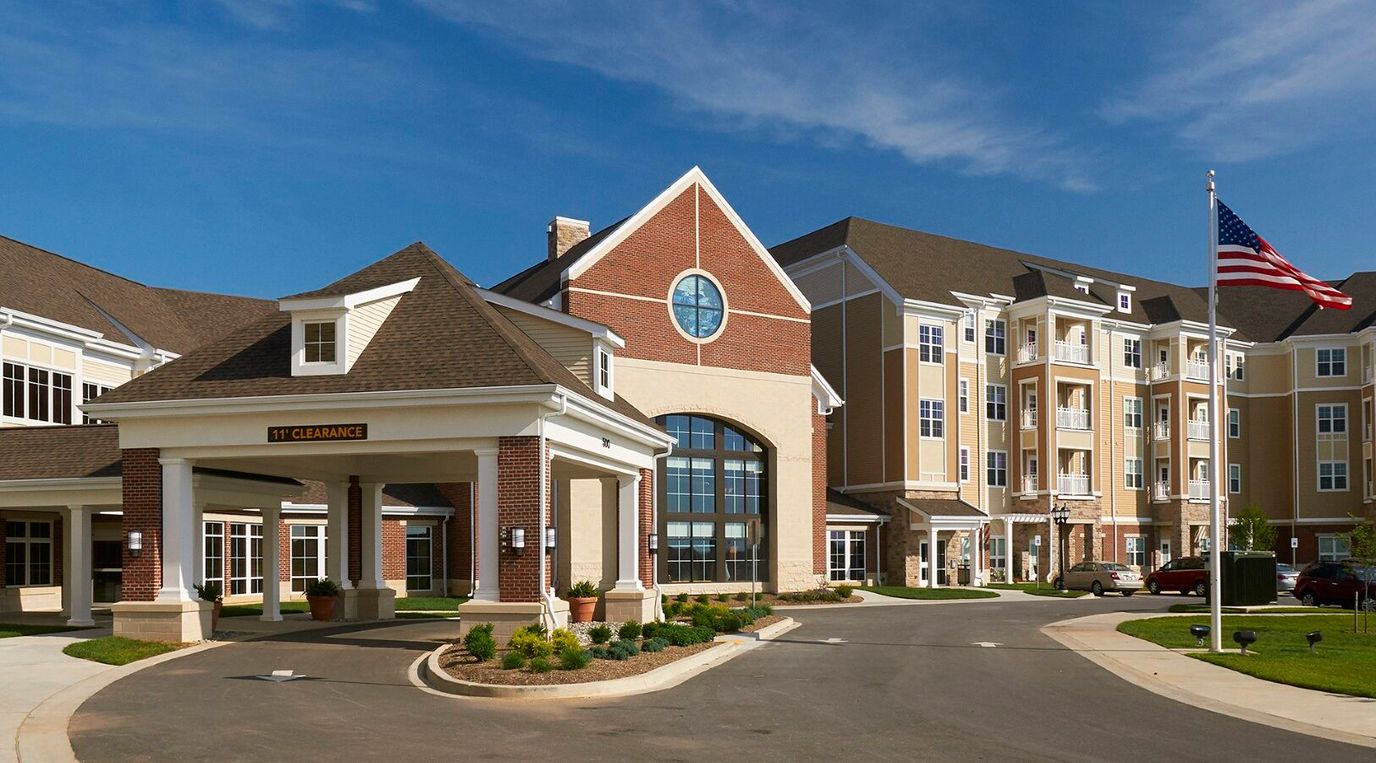
| The Lodge at Willow Ponds |
AL
IL
MC
NH
SNF
|
Frederick | - | Yes |
93
Facility
93
MD AVG
43
Rank
#13 / 985
| 1 Bed / 2 Bed | - | - | - | - | - | - | - | - | - | - |
| Edenton Retirement Community |
AL
HC
IL
MC
|
Frederick (Ballenger Creek) | - | Yes |
43
Facility
43
MD AVG
43
Rank
#495 / 985
| Private Rooms | - | - | - | - | - | - | - | - | - | - |
| Somerford House & Place Frederick |
AL
MC
|
Frederick (Whittier) |
52
Facility
52
MD AVG
43
Rank
#216 / 690
| Yes |
40
Facility
40
MD AVG
43
Rank
#523 / 985
| Studio / 1 Bed |
25
Facility
25
MD AVG
21
Rank
#83 / 210
| - |
21%
Male Residents — State Benchmarked 21% of residents are male, compared to the Maryland average of 31%. This facility caters to a majority female resident pool (79% female), consistent with the broader assisted living trend where women significantly outnumber men. |
79%
Female Residents — State Benchmarked 79% of residents are female, compared to the Maryland average of 69%. Women comprise the large majority, consistent with national assisted living demographics where women live longer and enter care facilities at higher rates. |
90%
White Residents — State Benchmarked 90% of residents are reported as White, compared to the Maryland average of 81%. A higher White share than is typical for assisted living in Maryland in this dataset — compare with peer facilities for local context. |
10%
Other Ethnicity Residents — State Benchmarked 10% of residents fall into categories other than White or African American (combined), compared to the Maryland average of 6%. This column aggregates Hispanic, Asian, multiracial, and any other labeled groups that are not classified as White or African American. Reported subgroups in this total: Mixed Race (4%), Other (4%), Hispanic (2%). |
13%
Residents Age 65–74 — State Benchmarked 13% of residents are 65–74, compared to the Maryland average of 13%. In line with the statewide profile for this youngest senior bracket in assisted living. |
44%
Residents Age 75–84 — State Benchmarked 44% of residents are 75–84, compared to the Maryland average of 31%. A high concentration in this mid-range bracket, where residents typically need moderate support with daily activities. |
23%
Residents Age 85–94 — State Benchmarked 23% of residents are 85–94, compared to the Maryland average of 44%. The population here skews younger than the statewide norm, which may indicate a more active, lower-acuity community. |
15%
Residents Age 95+ — State Benchmarked 15% of residents are 95 or older, compared to the Maryland average of 16%. In line with the statewide profile for the oldest resident bracket. |
| Bethany Living II |
AL
|
Frederick (Ballenger Creek) | - | Yes |
27
Facility
27
MD AVG
43
Rank
#668 / 985
| - | - | - | - | - | - | - | - | - | - | - |
| National Lutheran Communities & Services |
AL
IL
MC
NH
SNF
|
Frederick | - | No |
38
Facility
38
MD AVG
43
Rank
#542 / 985
| - | - | - | - | - | - | - | - | - | - | - |
Rows per page:

View all Nearby Homes
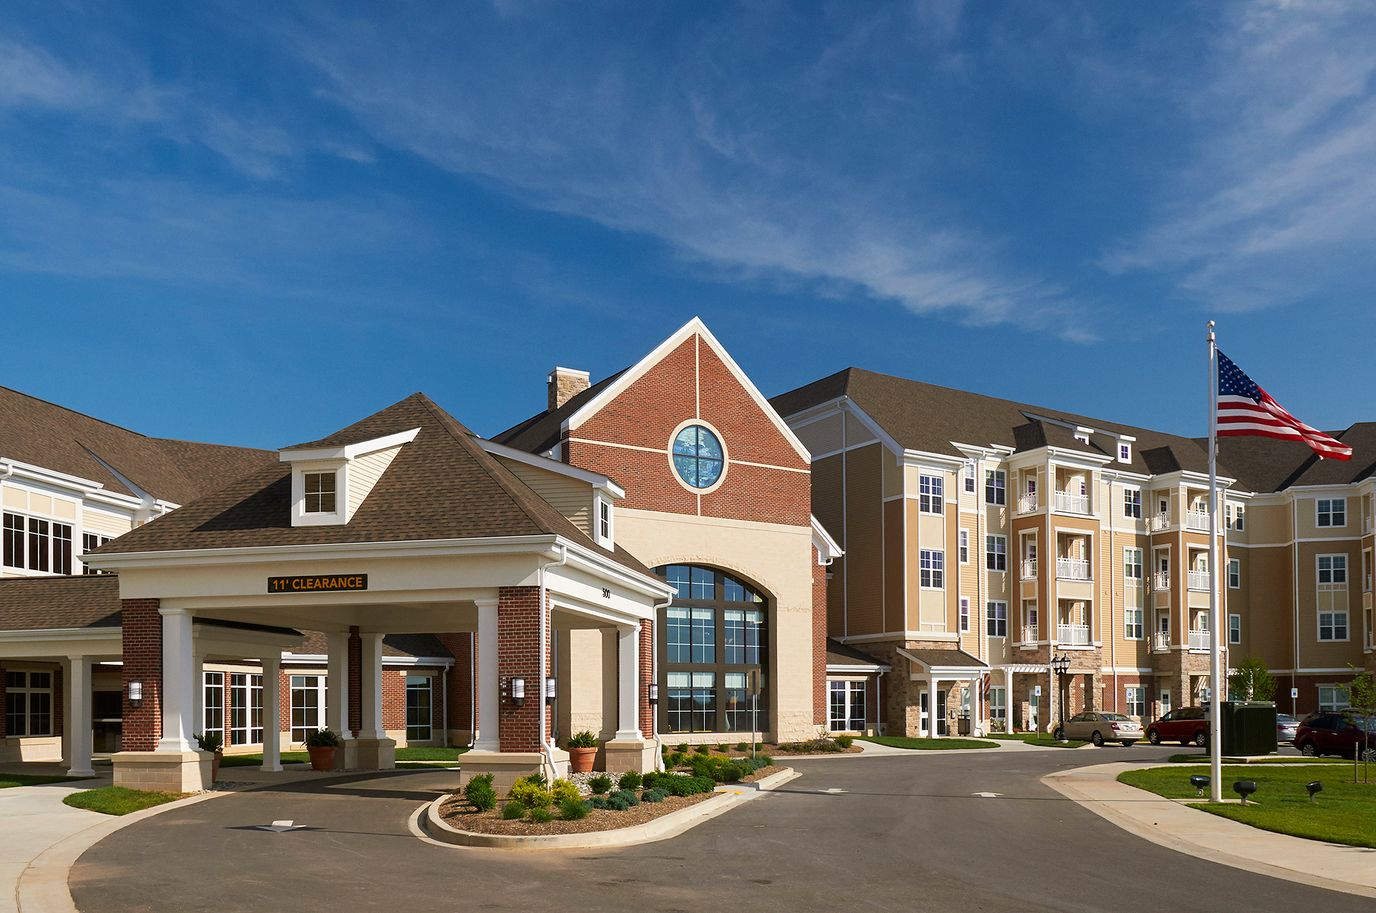
Ideally situated in the thriving neighborhood of Frederick, MD, The Lodge at Willow Ponds is an astounding community in Frederick, MD, offering independent living. With its dedication to enhancing older adults’ living experiences, the community provides cozy and thoughtfully furnished accommodations for their comfort. Residents also enjoy a hassle-free living with maintenance services and chores.
Residents can spend their days as they please with wellness opportunities and inviting gathering spaces. Multiple dining venues are also provided, so residents have the finest dining experience that caters to their dietary needs and preferences. The community is a great option for those seeking independence in retirement, especially with its warm and welcoming environment.
Edenton Retirement Community is one the most sought-after independent living, memory care, and assisted living communities in Frederick. They deliver world-class hospitality where seniors can age gracefully in a home-like environment. Management and staff do their best to offer residents a worry-free lifestyle. For over 30 years, Edenton’s goal is to ensure a living environment where everyone can thrive and succeed.
The retirement home offers modern amenities, friendly staff, and senior care service like no other. Amenities and services include housekeeping, physical therapy, social events, 24-hour staff available, restaurant-style dining, specialized programs, and enriching activities– all provided.
Tucked away beside a serene lake with stunning mountain views in Frederick, MD, Somerford House & Place Frederick is a peaceful senior living community that offers various living options, including Assisted Living, Memory Care, and Respite Care & Short-Term Stays. Residents can enjoy natural beauty right outside their door and engage in a vibrant community with friends. Popular activities include happy hour, card games, and arts and crafts, ensuring there’s always something fun and engaging to do.
Committed to providing its residents with fulfilling and enriching lifestyle, the community
offers excellent amenities such as Ageility Physical Therapy Solutions, a beauty salon, a gazebo, and a private dining room. Programs like gardening, live entertainment, and cultural excursions further enhance the residents’ quality of life, providing a supportive and enjoyable environment for everyone. Recognized as a 2023-2024 U.S. News & World Report Best Assisted Living facility, the community ensures quality care and services that warrants a comfortable living experience.
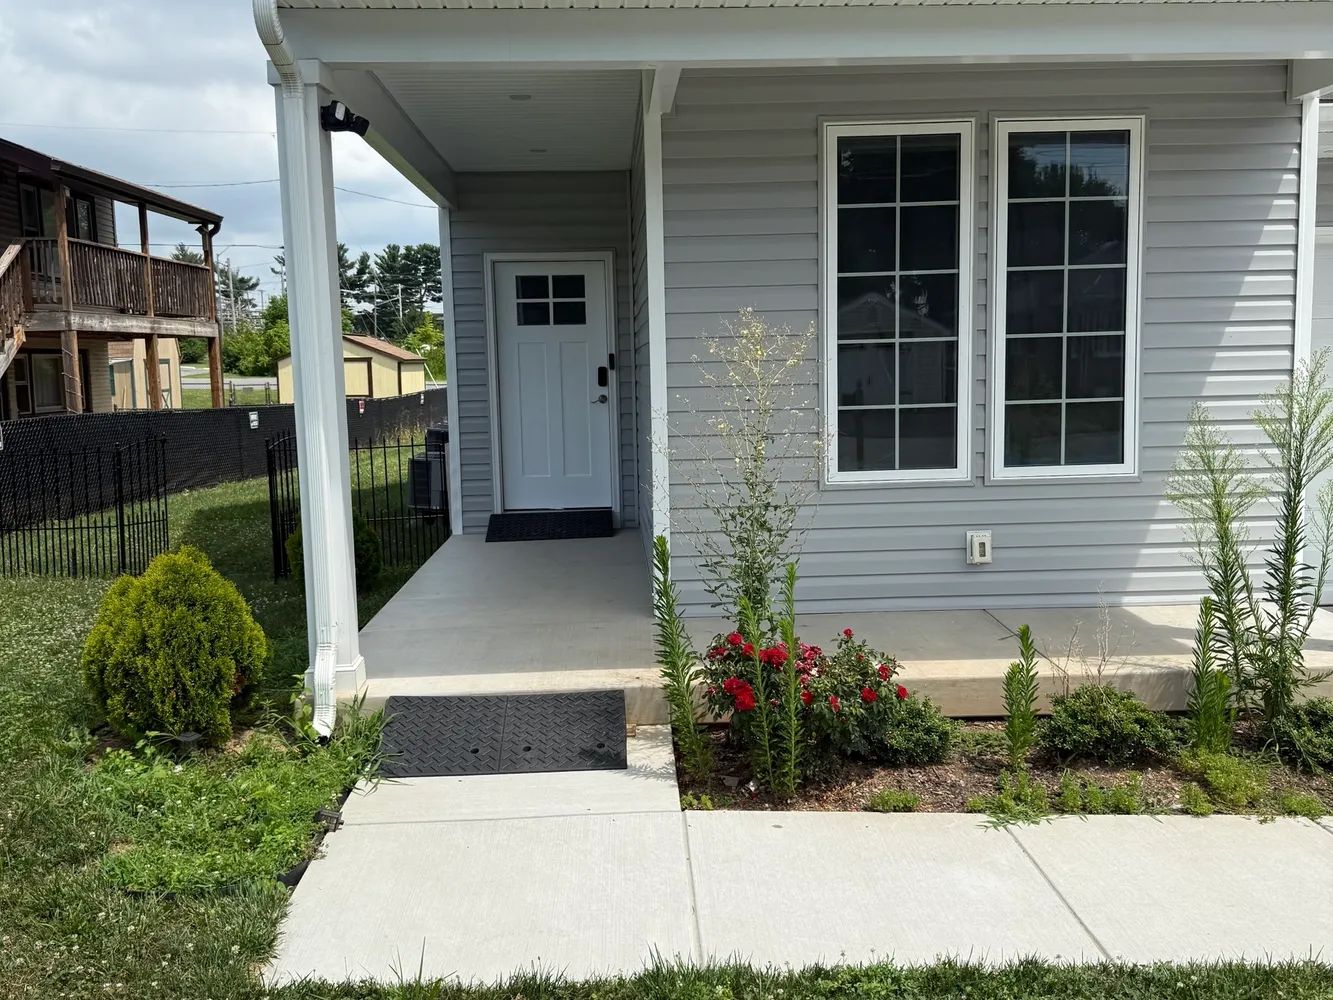
Bethany Living II offers specialized memory care at 5135 Charlington Ct in Frederick’s Ballenger Creek neighborhood. The residential building utilizes a single-story layout, letting residents move between their private apartments and the shared spaces without encountering stairs. The community sits roughly three miles from downtown Frederick and accepts pets.
The daily routine combines specialized personal care, housekeeping, and group meals in a central dining room. Social options include structured arts and crafts sessions, fitness programs, and access to an outdoor courtyard. The area has a walkability score of 27 out of 100, which means the location is car-dependent and visitors will need a vehicle for standard local travel.
Prospective representatives looking over local dementia care options can call Bethany Living II to check on room availability.
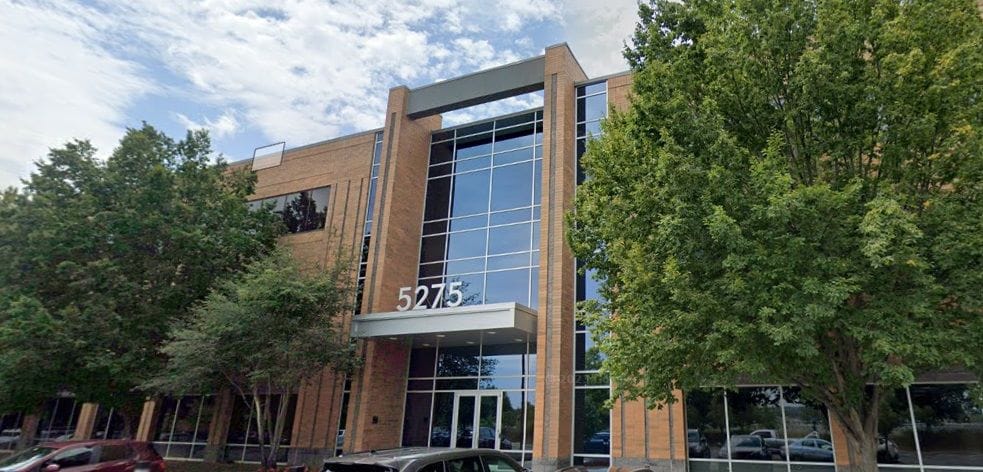
National Lutheran Communities & Services serves as the corporate parent organization based in Frederick, Maryland, managing a network of senior living campuses that provide independent living, assisted living, memory care, and skilled nursing. The organization incorporates personalized health care programs such as “myPotential at Home,” which delivers transitional medical therapies and dedicated in-home support to help older adults remain independent.
The Frederick neighborhood has a walkability score of 38 out of 100, meaning the area is car-dependent and requires a vehicle for most trips. This specific Westview Drive location serves strictly as the central administrative office rather than a residential clinical facility, meaning its direct nursing citations-per-inspection rate is zero.
On-site routines across their actual care campuses focus on 24-hour supervision, medication assistance, and balanced meal plans.
Interested individuals who want to explore senior living arrangements can reach out to the corporate office of National Lutheran Communities & Services to find nearby campus locations, request detailed tier pricing menus, or confirm regional facility availability.
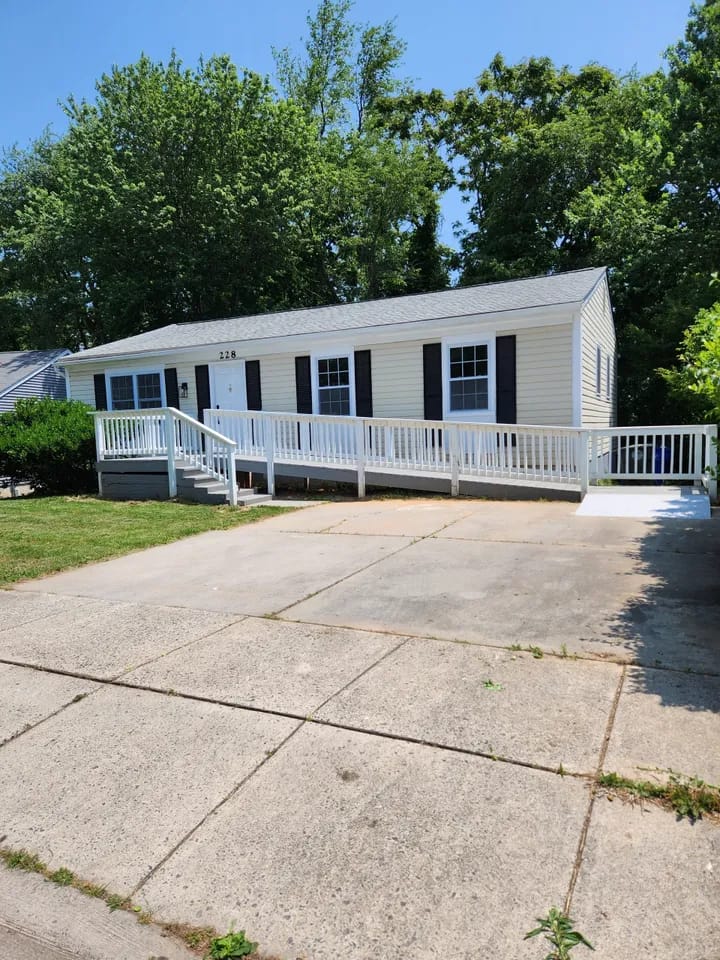
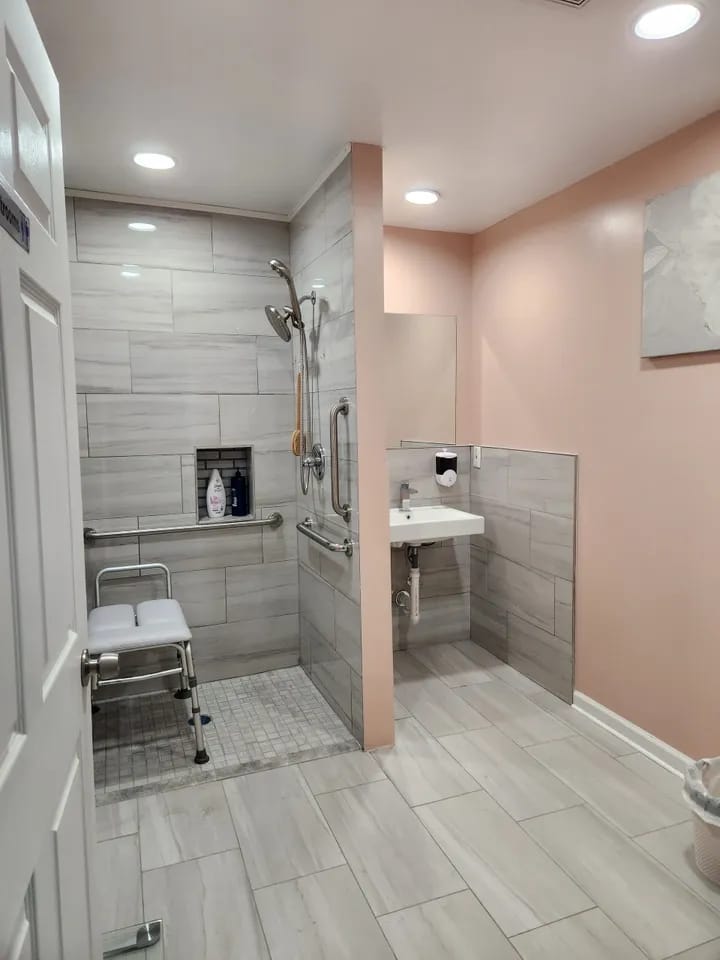
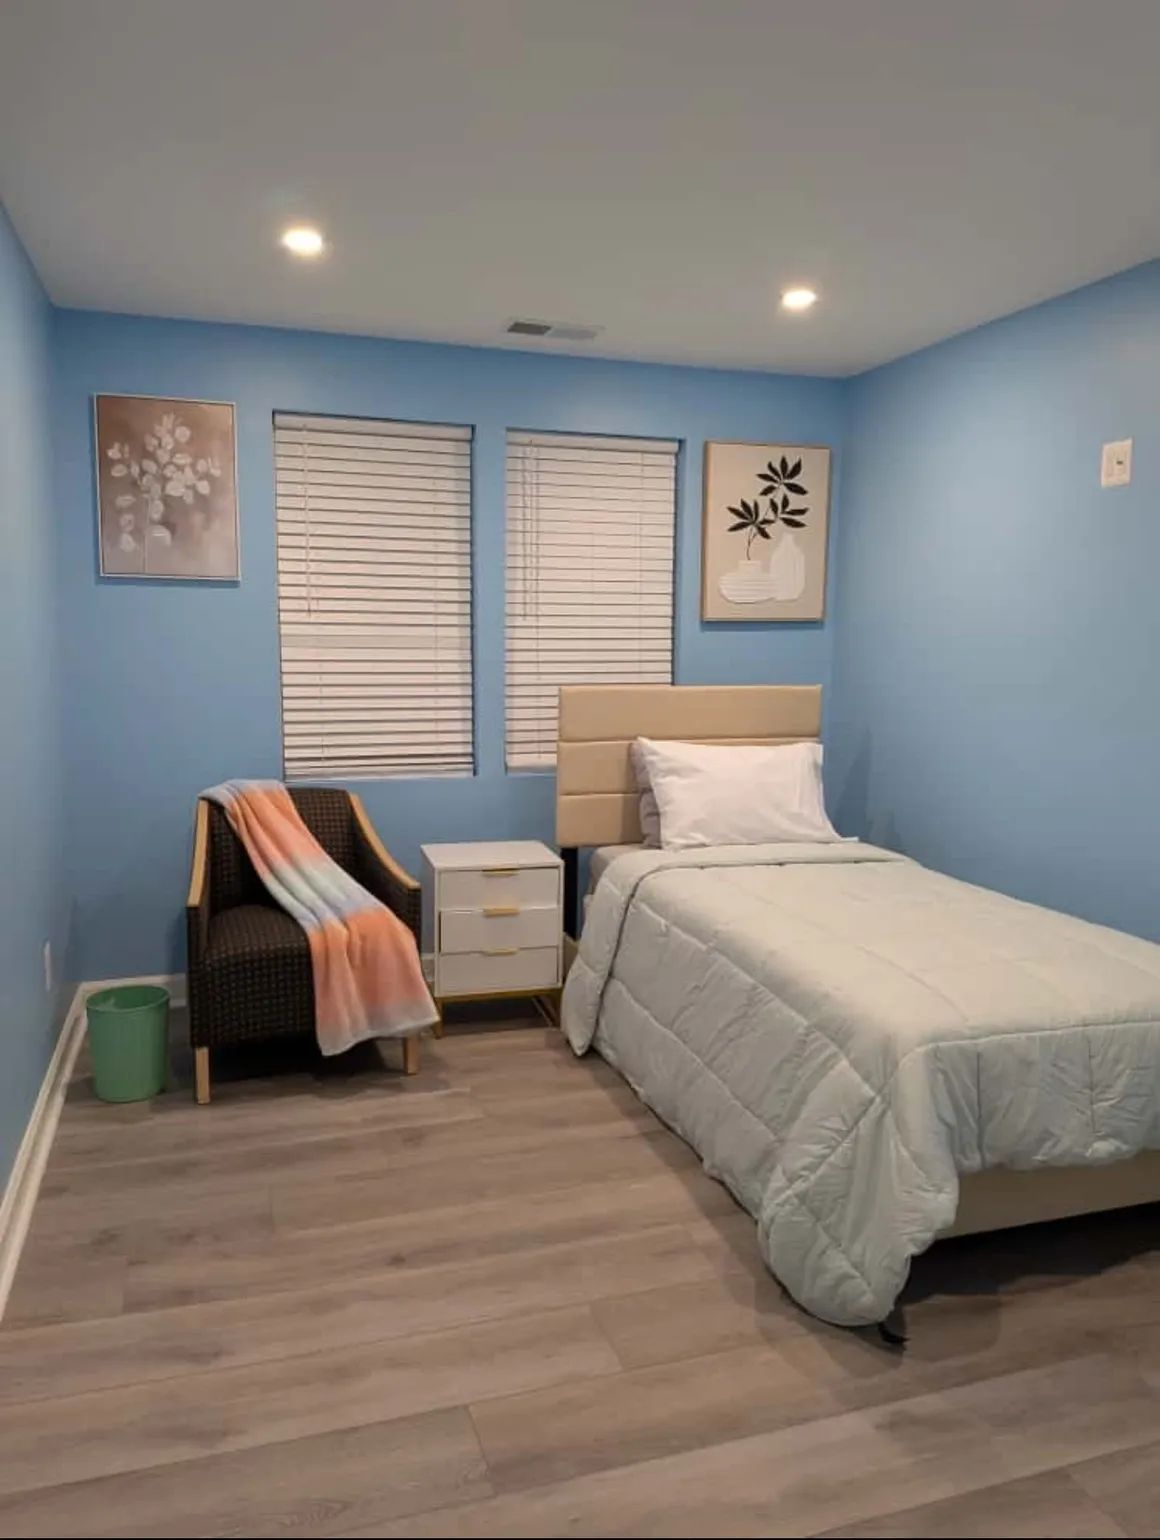
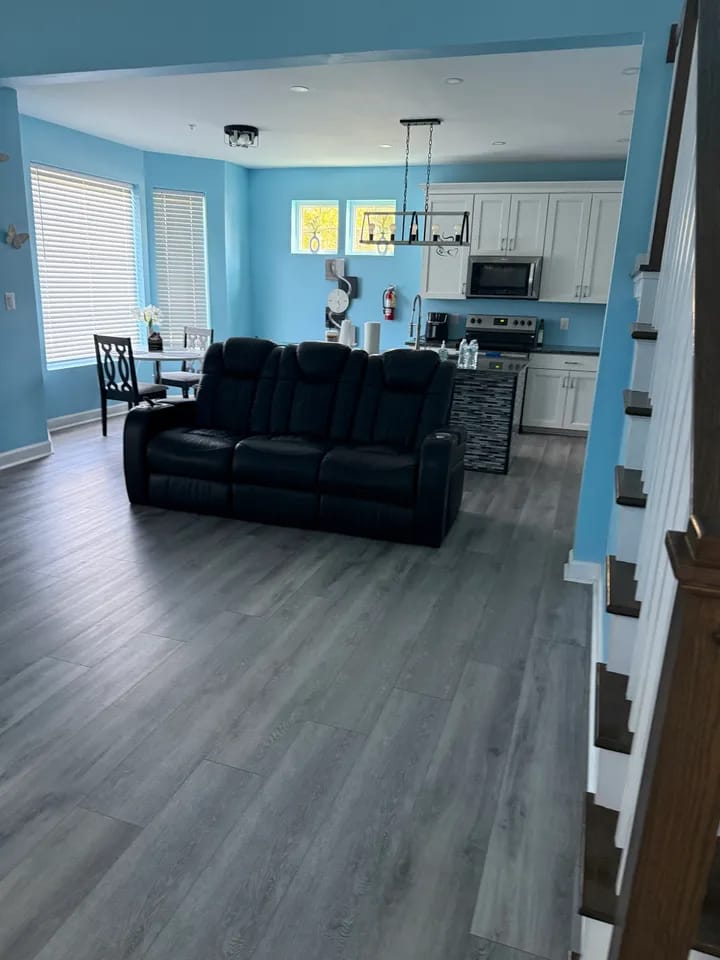
Overview of Stern Life Assisted Living

Stern Life Assisted Living is an assisted living community in Frederick, MD, offering levels one to three assisted living, dementia support, and respite care. With an intimate, home-like environment, the community ensures older adults receive exceptional care in a residential setting. 24/7 support, physical therapy, occupational therapy, speech therapy, medication management, and care coordination are among the comprehensive services provided to meet residents’ needs. The community also follows a person-centered approach to care, providing residents with individualized care plans for their holistic wellness.
Cognitive activities, emotional support, and light recreational activities help residents live actively and improve their mental, social, and emotional welfare. Residents also have a maintenance-free lifestyle, as housekeeping, laundry, and three home-cooked meals are provided. With two distinct homes across Frederick, the community ensures older adults find a place to spend their later years within their proximity. The community has two locations in Frederick, MD: 228 Thames Dr, Frederick, MD 21702, and 903 Walnut St, Frederick, MD 21703. Providing a wide range of care options, Stern Life Assisted Living is a great choice for senior living in Maryland.
Ranking Methodology
How we rank these assisted living communities
Every community above is evaluated across six weighted categories using public data including state inspection records, review platforms, BBB profiles, and operator-published materials.
Weighting overview
- 35%Resident Experience
- 25%Regulatory
- 15%Visual Media
- 10%Website
- 10%Stability
- 5%Environment
01
Resident & Family Experience 35%
The single largest share of every ranking. Aggregated review sentiment and volume from major platforms — the closest signal to real resident experience.
- Includes
- Review Sentiment
- Review Volume
02
Regulatory & Safety Record 25%
State inspection records, citations, and complaint visits. We weight per-inspection rates more heavily than raw counts.
- Includes
- State Inspections
- Citations/Inspection
- % Inspections w/ Citations
- Complaint Visits
- Accreditations
- BBB Rating
03
Visual Media & Transparency 15%
Communities that publish high-quality visuals give families a real preview. No photos or tours = a negative transparency signal.
- Includes
- Video Tours
- Virtual Walkthroughs
- Photo Quantity
- Photo Quality
04
Website & Operator Transparency 10%
Site quality and whether the operator publishes basic accountability information — staff names, contact details, ownership.
- Includes
- Website Content
- Mobile Usability
- Staff Info Available
- Owner Info Available
05
Community Stability 10%
Operational signals indicating whether a community is well-run and meeting demand.
- Includes
- Occupancy Rate
- Bed Options
06
Environment & Pricing 5%
Walkability and pricing transparency. Walk Score is weighted higher for Independent Living than for Memory Care, where most residents do not leave unaccompanied.
- Includes
- Walk Score
- Pricing Transparency
Who we are
Your Senior Care Partner, Every Step of the Way
We help families find affordable senior communities and unlock same day discounts, Medicaid, and Medicare options tailored to your needs.
Contact us Today
Frequently Asked Questions about Assisted Living in Frederick, MD
What is the average cost of assisted living in Frederick, MD?
The average monthly cost of assisted living in Frederick, MD is approximately $5,500. Actual rates vary by community, level of care, and floorplan.
What is the price range for assisted living in Frederick, MD?
Assisted living in Frederick, MD typically ranges from $5,000–$7,600 per month, depending on the community, room type, and care needs.
What is the typical staff-to-resident ratio at assisted living facilities in Frederick, MD?
Assisted living facilities in Frederick, MD typically operate with a staff-to-resident ratio in the range of 1:6 to 1:12.
What's the difference between assisted living and memory care in Maryland?
Assisted living in Maryland supports residents with daily activities (bathing, dressing, medication management) while preserving independence. Memory care is a specialized form of assisted living for residents living with Alzheimer's or dementia, and adds 24/7 secured environments, dementia-trained staff, and structured routines designed to reduce confusion and wandering.
What's the difference between assisted living and a nursing home in Maryland?
Assisted living in Maryland is a residential model focused on housing, hospitality, and help with daily activities. Nursing homes (skilled nursing facilities) provide 24/7 medical care from licensed nurses for residents with significant health needs, and are regulated more strictly under both state and federal CMS rules.
Does Maryland Medicaid cover assisted living?
Maryland Medicaid does not directly pay room-and-board for assisted living, but most states (including Maryland) offer Home and Community-Based Services (HCBS) waivers that can offset the cost of care services delivered inside a licensed community. Eligibility, waitlists, and covered services vary — check directly with the state Medicaid agency.
What is assisted living?
Assisted living combines private or semi-private apartments with help on activities of daily living (meals, bathing, dressing, medication management) and a social calendar — for residents who need some support but do not need 24/7 medical care.
Updated on
