Williamsburg Retirement Community
Nursing Home & Independent Living · Utah, UT
CMS overall rating Info The Overall CMS Rating is scored from 1 to 5 stars and combines results from health inspections, staffing levels, and quality measures. Health inspections carry the most weight. Staffing and quality scores can increase or decrease the final rating based on performance compared to state and national standards.

Williamsburg Retirement Community

Nursing Home & Independent Living · Utah, UT
CMS overall rating Info The Overall CMS Rating is scored from 1 to 5 stars and combines results from health inspections, staffing levels, and quality measures. Health inspections carry the most weight. Staffing and quality scores can increase or decrease the final rating based on performance compared to state and national standards.
Calculator: See prices in your area
Williamsburg Retirement Community accepts Medicare, Medicaid, and private pay.

Overview of Williamsburg Retirement Community

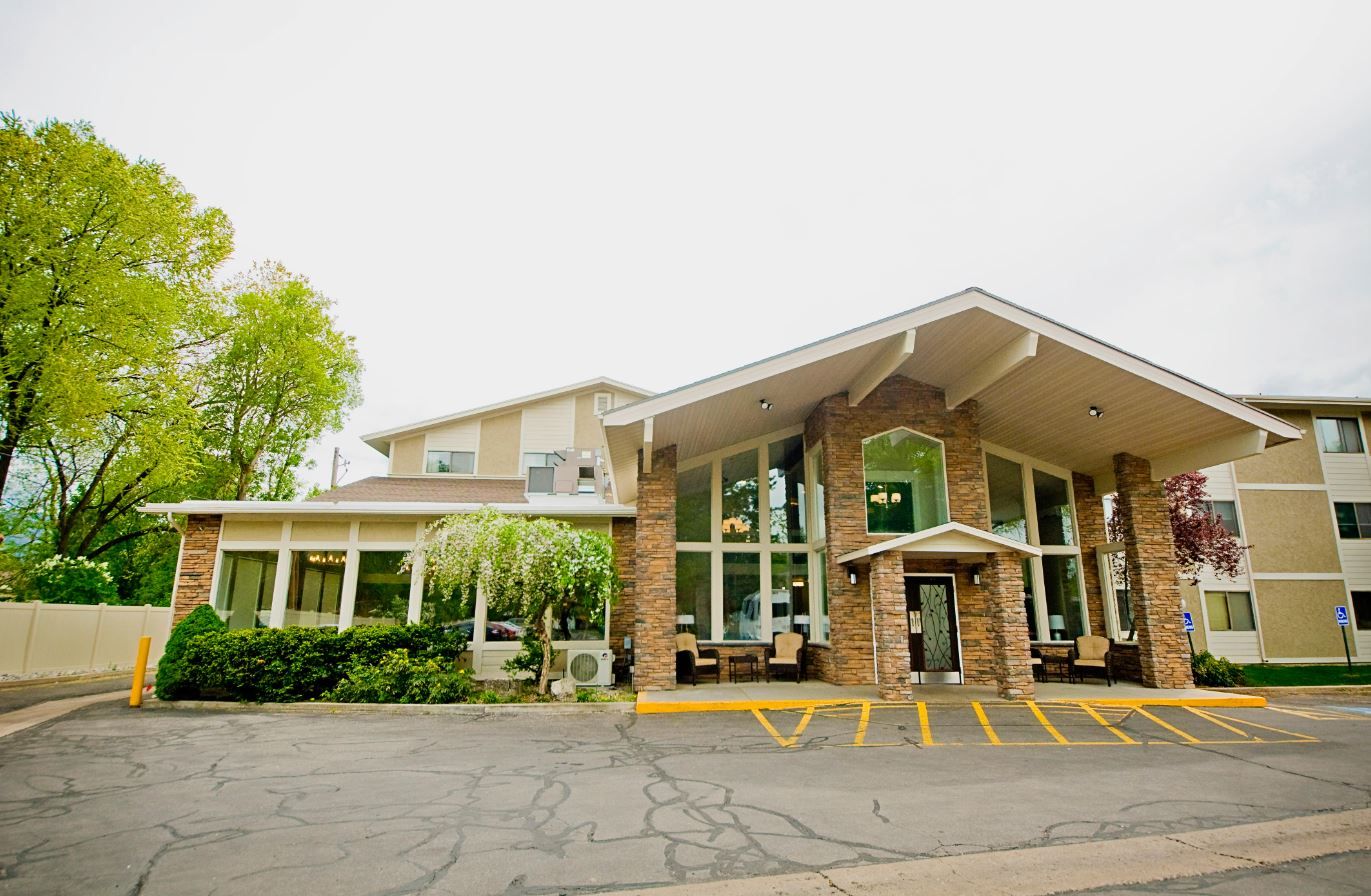
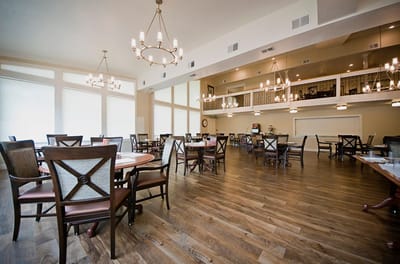
A respected senior living community set in the harmonious city of Logan, UT, Williamsburg Retirement Community provides independent living services. Keep your peace and experience unmatched comfort and security with a wide array of snug and sophisticated residences including studio, one-bedroom, and two-bedroom apartments. With its dedication to improving seniors’ quality of life, Williamsburg Retirement Community provides round-the-clock care and support from a compassionate and highly-trained team.

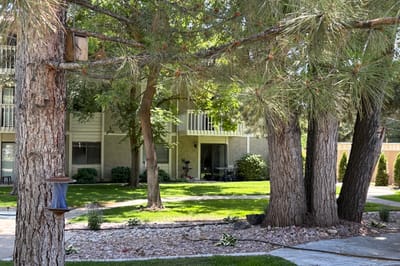
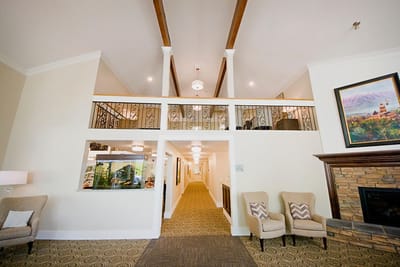
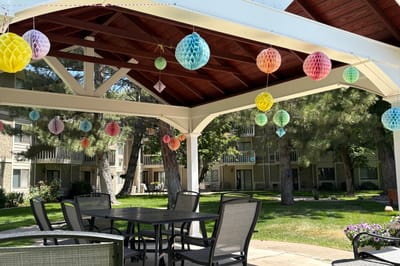
The community goes above and beyond in paving the way for seniors to flourish and achieve the best version of themselves with a bunch of exciting things to experience. Satisfy cravings and meet dietary requirements with healthy and tasty meals. Williamsburg Retirement Community is an inviting community surrounded by fabulous amenities and serene grounds.

(435) 753-5502

Quality ratings

Measured by Centers for Medicare & Medicaid Services (CMS)

Overall rating Info The Overall CMS Rating combines results from health inspections, staffing levels and quality measures. Health inspections carry the most weight. Staffing and quality scores can increase or decrease the final rating based on performance compared to state and national standards.
▼ 40.3% Below UT avg. ▼ 40.3% Below UT avg.Click the badge to see the full State ranking.Click here to see the full State ranking.
Health Inspection Info Based on the results of the facility's three most recent standard inspections and any complaint investigations. CMS reviews the number, scope, and severity of deficiencies, with more recent findings weighted more heavily.
▼ 64.1% Below UT avg. ▼ 64.1% Below UT avg.Click the badge to see the full State ranking.Click here to see the full State ranking.
Staffing Info Measures average nursing staff hours per resident per day, including Registered Nurses (RNs) and total nursing staff. Ratings are adjusted based on the level of care residents require and are compared to state and national benchmarks.
▲ 62.2% Above UT avg. ▲ 62.2% Above UT avg.Click the badge to see the full State ranking.Click here to see the full State ranking.
Quality Measures Info Based on clinical and physical health indicators reported to CMS, such as hospital readmissions, falls, pressure ulcers, and improvements in mobility. These measures reflect how well residents' health needs are being managed.
▲ 14.9% Above UT avg. ▲ 14.9% Above UT avg.Click the badge to see the full State ranking.Click here to see the full State ranking.

Staffing hours breakdown

Info Daily nursing hours per resident by staff type, reported to CMS. Higher is generally better — compare this facility to state and national averages to see where staffing stands.

Hours per resident per day — compared to Utah state averages

Total nursing care / resident Info This home is ranked 3rd out of 66 homes in Utah. Total adjusted nursing hours per resident per day, combining RN, LPN, and aide time. CMS adjusts this for case-mix so facilities can be fairly compared.
5h 45m per day
Rank #3 / 66Nurse hours — State benchmarkedThis home is ranked 3rd out of 66 homes in Utah. Shows adjusted nurse hours per resident per day benchmarked to the Utah average, with a ranking across 66 Utah SNFs. More hours mean more direct care. The national average is about 3.5 hrs; below 3.0 is a red flag.Click the rank badge to see the full State ranking.Click here to see the full State ranking.
This facility Utah avg (3h 43m per day)
vs Utah avg
+55%
Staff type Hours / Day / Resident vs state avg
Weekend Total Nursing Info Combined nursing hours (RN + LPN + Nurse Aide) per resident per day on weekends. Staffing often drops on weekends — this figure reveals whether the facility maintains adequate coverage outside of weekday hours. 4h 26m per day

Types of Care at Williamsburg Retirement Community

Independent Living

Capacity and availability

This home is often near full

Occupancy higher than 95% suggests steady demand, but availability may be limited.

Higher occupancy than the Utah average: 70.1%
Occupancy rate 96.9% Rank #5 / 81Occupancy rate — State benchmarkedThis home is ranked 5th out of 81 homes in Utah. Shows this facility's occupancy rate versus the Utah average, with its Statewide rank out of 81. Higher occupancy signals strong local demand and financial stability.Click the rank badge to see the full State ranking.Click here to see the full State ranking.
Avg. Length of Stay 147 days
Occupancy rate
96.9% Rank #5 / 81Occupancy rate — State benchmarkedThis home is ranked 5th out of 81 homes in Utah. Shows this facility's occupancy rate versus the Utah average, with its Statewide rank out of 81. Higher occupancy signals strong local demand and financial stability.Click the rank badge to see the full State ranking.Click here to see the full State ranking.
Avg. Length of Stay
147 days
Walk Score
Walk Score: 78 / 100 Rank #23 / 281Walk Score — State benchmarkedThis home is ranked 23rd out of 281 homes in Utah. Shows how walkable this facility's neighborhood is compared to the average Walk Score across Utah SNFs. Higher scores benefit residents, families, and staff.Click the rank badge to see the full State ranking.Click here to see the full State ranking.
Very walkable. Most errands can be accomplished on foot, and many essentials are within a short walk.

About this community

Amenities & Lifestyle

Specific ProgramsCommunity & Floor Plans, Pricing Tool

Contact Williamsburg Retirement Community

Staffing Data

Reporting period: October 1 – December 31, 2025 (Q4 2025). Source: CMS Payroll-Based Journal report.

Total staff 238
Employees 220
Contractors 18
Staff to resident ratio 2.09:1
0% compared with Utah average
Utah average ratio: 2.14:1 Utah average ratio: 2.14:1See full Utah ranking
Avg staff/day 83
Average shift 8 hours
0% compared with Utah average
Utah average: 7.9 hours Utah average shift: 7.9 hoursSee full Utah ranking
Total staff hours (quarter) 60,749

Nursing staff breakdown

Q4 2025 · Oct 1 – Dec 31 More info This data comes from the CMS Payroll-Based Journal report covering October 1 – December 31, 2025.
Registered Nurse

Manages medical care and health needs.

RN Staff 42
Average shift length Info Average shift length. Calculated as total hours divided by days worked and average staff per day. 9.6 hours

No contractors work on this role.

Licensed Practical Nurse

Assists with medical care and medications.

LPN Staff 14
Average shift length Info Average shift length. Calculated as total hours divided by days worked and average staff per day. 9.4 hours

No contractors work on this role.

Certified Nursing Assistant

Helps with daily care and mobility.

CNA Staff 128
Average shift length Info Average shift length. Calculated as total hours divided by days worked and average staff per day. 7.6 hours

No contractors work on this role.

Contractor staffing

Q4 2025 · Oct 1 – Dec 31 More info This data comes from the CMS Payroll-Based Journal report covering October 1 – December 31, 2025.

Total hours from contractors

5%

3,017 contractor hours this quarter

Speech Language Pathologist: 5 Respiratory Therapy Technician: 3 Physical Therapy Aide: 3 Qualified Social Worker: 2 Physical Therapy Assistant: 2 Occupational Therapy Assistant: 2 Occupational Therapy Aide: 1

Staff by category

Q4 2025 · Oct 1 – Dec 31 More info This data comes from the CMS Payroll-Based Journal report covering October 1 – December 31, 2025.
Certified Nursing Assistant 128 0 128 32,301 92 100% 7.6
Registered Nurse 42 0 42 10,811 92 100% 9.6
Clinical Nurse Specialist 21 0 21 4,702 92 100% 8.3
Licensed Practical Nurse 14 0 14 3,922 92 100% 9.4
Other Dietary Services Staff 4 0 4 1,785 81 88% 7.7
RN Director of Nursing 3 0 3 988 76 83% 8.5
Dietitian 2 0 2 946 68 74% 8
Dental Services Staff 3 0 3 835 65 71% 7.3
Speech Language Pathologist 0 5 5 735 69 75% 6.3
Qualified Social Worker 0 2 2 611 71 77% 8.1
Physical Therapy Aide 0 3 3 568 70 76% 7.4
Physical Therapy Assistant 0 2 2 514 66 72% 7.8
Nurse Practitioner 1 0 1 504 63 68% 8
Administrator 1 0 1 476 60 65% 7.9
Mental Health Service Worker 1 0 1 463 60 65% 7.7
Respiratory Therapy Technician 0 3 3 395 64 70% 5.7
Occupational Therapy Aide 0 1 1 152 25 27% 6.1
Occupational Therapy Assistant 0 2 2 43 37 40% 1.2
128 Certified Nursing Assistant
% of Days 100%
42 Registered Nurse
% of Days 100%
21 Clinical Nurse Specialist
% of Days 100%
14 Licensed Practical Nurse
% of Days 100%
4 Other Dietary Services Staff
% of Days 88%
3 RN Director of Nursing
% of Days 83%
2 Dietitian
% of Days 74%
3 Dental Services Staff
% of Days 71%
5 Speech Language Pathologist
% of Days 75%
2 Qualified Social Worker
% of Days 77%
3 Physical Therapy Aide
% of Days 76%
2 Physical Therapy Assistant
% of Days 72%
1 Nurse Practitioner
% of Days 68%
1 Administrator
% of Days 65%
1 Mental Health Service Worker
% of Days 65%
3 Respiratory Therapy Technician
% of Days 70%
1 Occupational Therapy Aide
% of Days 27%
2 Occupational Therapy Assistant
% of Days 40%

Penalties and fines

Federal penalties imposed by CMS for regulatory violations, including civil money penalties (fines) and denials of payment for new Medicare/Medicaid admissions.

Source: CMS Penalties Database

No penalties in the past 3 years

No civil money penalties or payment denials were reported in the last 3 years.

Quality of care over time

These measures show how residents usually do over time at this home, based on health outcomes and preventive care.

High-risk clinical events score Info A composite score based on pressure ulcers, falls with injury, weight loss, walking ability decline, and activities of daily living decline. 9.1
In line with Utah average

Utah average: 9.3

Functional decline score Info A composite score based on activities of daily living decline, walking ability decline, and incontinence. 22.0
10% worse than Utah average

Utah average: 20.1

Long-stay resident measures
Need for Help with Daily Activities Increased Info Percent of long-stay residents whose need for help with daily activities has increased 18.3%
17% worse than Utah average

Utah average: 15.7%

Walking Ability Worsened Info Percent of long-stay residents whose ability to move independently worsened 20.6%
In line with Utah average

Utah average: 21.3%

Low Risk Residents with Bowel/Bladder Incontinence Info Percent of low risk long-stay residents who lose control of their bowels or bladder 27.2%
18% worse than Utah average

Utah average: 23.1%

Falls with Major Injury Info Percent of long-stay residents experiencing one or more falls with major injury 1.7%
36% better than Utah average

Utah average: 2.6%

High Risk Residents with Pressure Ulcers Info Percent of long-stay high risk residents with pressure ulcers 2.0%
53% better than Utah average

Utah average: 4.2%

Urinary Tract Infection Info Percent of long-stay residents with a urinary tract infection 1.4%
30% better than Utah average

Utah average: 2.1%

Lost Too Much Weight Info Percent of long-stay residents who lose too much weight 2.8%
32% better than Utah average

Utah average: 4.1%

Depressive Symptoms Info Percent of long-stay residents who have depressive symptoms 12.6%
23% better than Utah average

Utah average: 16.5%

Antipsychotic Use Info Percent of long-stay residents who received an antipsychotic medication 10.9%
19% better than Utah average

Utah average: 13.5%

Pneumococcal Vaccine Info Percent of long-stay residents assessed and appropriately given the pneumococcal vaccine 100.0%
In line with Utah average

Utah average: 97.1%

Influenza Vaccine Info Percent of long-stay residents assessed and appropriately given the seasonal influenza vaccine 100.0%
In line with Utah average

Utah average: 98.0%

Short-stay resident measures
Pneumococcal Vaccine Info Percent of short-stay residents assessed and appropriately given the pneumococcal vaccine 99.5%
7% better than Utah average

Utah average: 92.9%

Antipsychotic medication increase Info Percent of short-stay residents who newly received an antipsychotic medication 1.0%
6% better than Utah average

Utah average: 1.1%

Influenza Vaccine Info Percent of short-stay residents assessed and appropriately given the seasonal influenza vaccine 98.2%
8% better than Utah average

Utah average: 91.0%

Breakdown by payment type

Medicare

19% of new residents, usually for short-term rehab.

Typical stay 26 days

Private pay

77% of new residents, often for short stays.

Typical stay 7 - 8 months

Medicaid

3% of new residents, often for long-term daily care.

Typical stay 1 - 2 years

Facility Characteristics

Source: CMS Long-Term Care Facility Characteristics (Data as of Jan 2026)

Total residents 114
Medicare
4
3.5% of residents
Medicaid
7
6.1% of residents
Private pay or other
103
90.4% of residents
Programs & Services
Residents Group

Residents meet regularly to discuss policies, care quality, and activities

Active Resident Council

Organized group of residents that meets regularly to discuss facility policies, quality of life, and activities.

Finances and operations

Governmental community
Operated by city authorities.
Home revenue
$20.6M
Surplus of revenue
$1.6M
Governmental community Operated by city authorities.
Home revenue
$20.6M Rank #7 / 63Revenue — State benchmarkedThis home is ranked 7th out of 63 homes in Utah. Shows this facility's annual revenue compared to the Utah SNF average. Higher revenue generally means more resources for staffing and capital — read alongside Payroll %.Click the rank badge to see the full State ranking.Click here to see the full State ranking.
Surplus of revenue
$1.6M
Payroll costs Info The portion of the home's budget spent on staff, including nurses, caregivers, and other employees who support care and operations. Rank #3 / 63Payroll — State benchmarkedThis home is ranked 3rd out of 63 homes in Utah. Shows total annual staff payroll benchmarked to the Utah average. Higher payroll investment relative to peers often signals better staffing and less reliance on cheaper contract labor.Click the rank badge to see the full State ranking.Click here to see the full State ranking.
$11.2M
54.3% of revenue Rank #16 / 63Payroll % — State benchmarkedThis home is ranked 16th out of 63 homes in Utah. Shows payroll as a percentage of revenue versus the Utah average. Well-run Utah SNFs typically land around 52–58% — the top third Statewide. Below 25% may signal understaffing or heavy agency use — read with Staffing ratings.Click the rank badge to see the full State ranking.Click here to see the full State ranking.
Other operating costs Info All remaining costs needed to run the home, such as food, utilities, building maintenance, supplies and administrative expenses.
$7.8M
Total costs $19.0M

What does this home offer?

Pets allowed icon
Pets allowed icon

Pets Allowed

Housing options icon

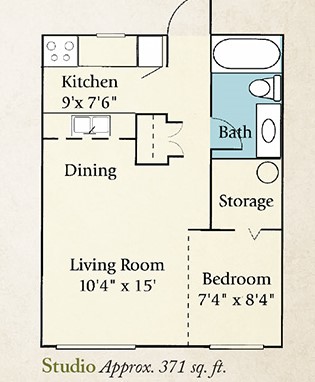
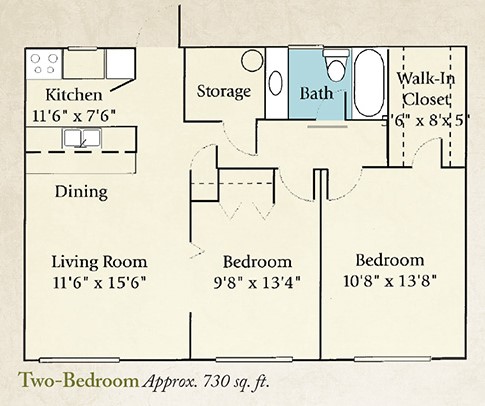
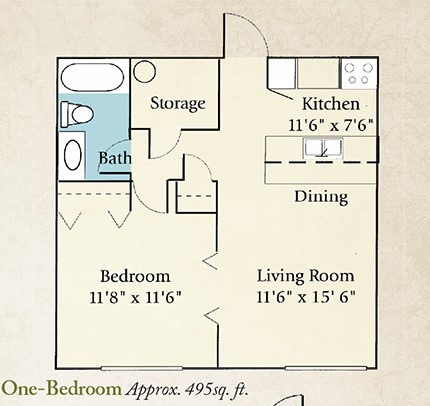
Housing Options: Studio / 1 Bed / 2 Bed

Building type icon
Building type icon

Building Type: 3-story

Transportation services icon

Transportation Services

Fitness and recreation icon

Fitness and Recreation

Who this home usually serves

TYPE OF STAY

Primarily short stays

Residents typically stay for brief periods, with frequent admissions and discharges throughout the year.

Managed by Chris Sorensen

Executive Director

Chris Sorensen serves as the Executive Director at Williamsburg Retirement Community, leading the team to deliver exceptional experiences for residents. His leadership is central to the community’s commitment to quality and care.

Living Spaces & Floor Plans for Williamsburg Retirement Community

Williamsburg Retirement Community P2
Williamsburg Retirement Community P3
Williamsburg Retirement Community P1

Places of interest near Williamsburg Retirement Community

Address 0.3 miles from city center Info Estimated distance in miles from Logan's city center to Williamsburg Retirement Community's address, calculated via Google Maps.

Calculate Travel Distance to Williamsburg Retirement Community

Add your location

Address

Financial Assistance for
Nursing Home in Utah

Williamsburg Retirement Community is located in Logan, Utah.
Here are the financial assistance programs available to residents in Utah.

Get Financial aid guidance

Aging Waiver

UT Medicaid Aging Waiver

Age 65+
General Utah resident, Medicaid-eligible, nursing home-level care need.
Income Limits (2025) ~$2,829/month 300% FBR, individual
Asset Limits $2,000 (individual), $3,000 (couple).
UT

Rural challenges; waitlists possible.

Benefits
Personal care (5-7 hours/day) Respite (240 hours/year) Adult day care ($65/day) Home modifications ($1,500 avg.)

Utah Alternatives Program

UT Alternatives

Age 60+
General Utah resident, at risk of nursing home.
Income Limits ~$2,000/month individual, varies
Asset Limits $5,000 individual
UT

Limited funding; rural focus.

Benefits
In-home care (3-5 hours/week) Respite (up to 10 days/year) Transportation (~5 trips/month)

Older Americans Act (OAA) Services

Utah OAA Services

Age 60+
General UT resident; no income/asset limits.
Income Limits (2025) None; donations encouraged.
Asset Limits Not assessed.
UT

12 AAAs; includes Meals on Wheels; rural emphasis.

Benefits
Meals (~$5-$7/meal) Transportation Homemaker services (~4 hours/week) Respite (5 days/year) Legal aid

Medicare Savings Program (MSP)

Utah Medicare Savings Program

Age 65+ or disabled
General UT resident, Medicare Part A/B.
Income Limits (2025) ~$2,510/month (QMB), ~$3,380/month (SLMB), ~$3,598/month (QI)—individual.
Asset Limits $9,430 (individual), $14,130 (couple).
UT

Includes Extra Help for Part D; no waitlist.

Benefits
Covers Part B premiums ($174.70/month) Deductibles ($240/year) Copays (~20%)

Home Energy Assistance Target (HEAT) Program

Utah HEAT Program

Age 60+ prioritized
General UT resident, low-income household.
Income Limits (2025) ~$3,970/month 185% FPL
Asset Limits Not assessed.
UT

Covers gas, electric, propane; emergency aid available.

Benefits
Heating/cooling aid ($300-$1,000/season) Crisis aid ($500 max)

Utah Caregiver Support Program

Utah Family Caregiver Support Program (FCSP)

Age
General Caregivers of 60+ needing care or 55+ caregivers of others; UT resident; 2+ ADLs.
Income Limits (2025) No strict cap; prioritizes low-income ~$24,980/year
Asset Limits Not assessed.
UT

Includes grandparent caregivers; serves ~1,500 annually.

Benefits
Respite (4-6 hours/week or 5 days/year) Adult day care ($60/day) Training Supplies (~$500/year)

VA Aid and Attendance (A&A) and Housebound Benefits

Utah VA Aid and Attendance/Housebound

Age 65+ or disabled veteran/spouse
General UT resident, wartime service, ADL help (A&A) or homebound.
Income Limits (2025) Net income < ~$1,984/month (veteran with dependent, A&A); pension offsets income.
Asset Limits ~$155,356 net worth
UT

Supports rural veterans; high demand near VA centers.

Benefits
Cash (~$1,433-$2,642/month veteran, ~$951-$1,318 spouse) for care costs

Property Tax Abatement and Deferral Programs

Utah Circuit Breaker and Deferral Programs

Age 66+ (abatement) or 75+ (deferral)
General UT resident 10+ months/year, homeowner.
Income Limits (2025) ~$40,000/year (household, abatement); no limit for deferral.
Asset Limits Not assessed; home value < ~$500,000 typical.
UT

Abatement up to $1,200; deferral accrues interest (2.5%-5%).

Benefits
Tax relief (~$500-$1,200/year) or deferral (postpones payment)

Senior Farmers’ Market Nutrition Program (SFMNP)

Utah SFMNP

Age 60+
General UT resident, low-income.
Income Limits (2025) ~$2,322/month 185% FPL
Asset Limits Not assessed.
UT

Vouchers (~$50/season); serves ~5,000 via 12 AAAs.

Benefits
Vouchers (~$50/season) for produce at farmers’ markets

Frequently Asked Questions about Williamsburg Retirement Community

Is Williamsburg Retirement Community in a walkable area?

Williamsburg Retirement Community has a walk score of 78. Very walkable. Most errands can be accomplished on foot, and many essentials are within a short walk.

Who is the administrator of Williamsburg Retirement Community?

field_administrator is the administrator of Williamsburg Retirement Community.

What is the phone number of Williamsburg Retirement Community?

(435) 753-5502 will put you in contact with the team at Williamsburg Retirement Community.

Is Williamsburg Retirement Community Medicare or Medicaid certified?

Yes — Williamsburg Retirement Community is a CMS-certified provider of Medicare and Medicaid.

Guides for Better Senior Living

Care Cost Calculator: See Prices in Your Area

Nursing Home Data Explorer

Don’t Wait Too Long: 7 Red Flag Signs Your Parent Needs Assisted Living Now

The True Cost of Assisted Living in 2025 – And How Families Are Paying For It

Understanding Senior Living Costs: Pricing Models, Discounts & Financial Assistance

Explore Open Rooms
1 Contact details
2 What type of senior care service are you looking for?
3 What budget do you have in mind for senior care?
4 How soon do you need to find care?
5 Additional details

Thank you for your interest!

Our team will be in touch shortly to help with next steps.