Adviniacare Salem
Nursing Home, Assisted Living, Hospice Care & Memory Care · Salem, MA
CMS overall rating Info CMS (the Centers for Medicare & Medicaid Services) is the federal agency that rates nursing home quality. Its Overall Rating runs from 1 to 5 stars, combining health inspections, staffing, and quality measures, with inspections weighted most heavily.

Adviniacare Salem

Nursing Home, Assisted Living, Hospice Care & Memory Care · Salem, MA
CMS overall rating Info CMS (the Centers for Medicare & Medicaid Services) is the federal agency that rates nursing home quality. Its Overall Rating runs from 1 to 5 stars, combining health inspections, staffing, and quality measures, with inspections weighted most heavily.
Calculator: See prices in your area
Adviniacare Salem accepts Medicare, Medicaid, and private pay.

Overview of Adviniacare Salem

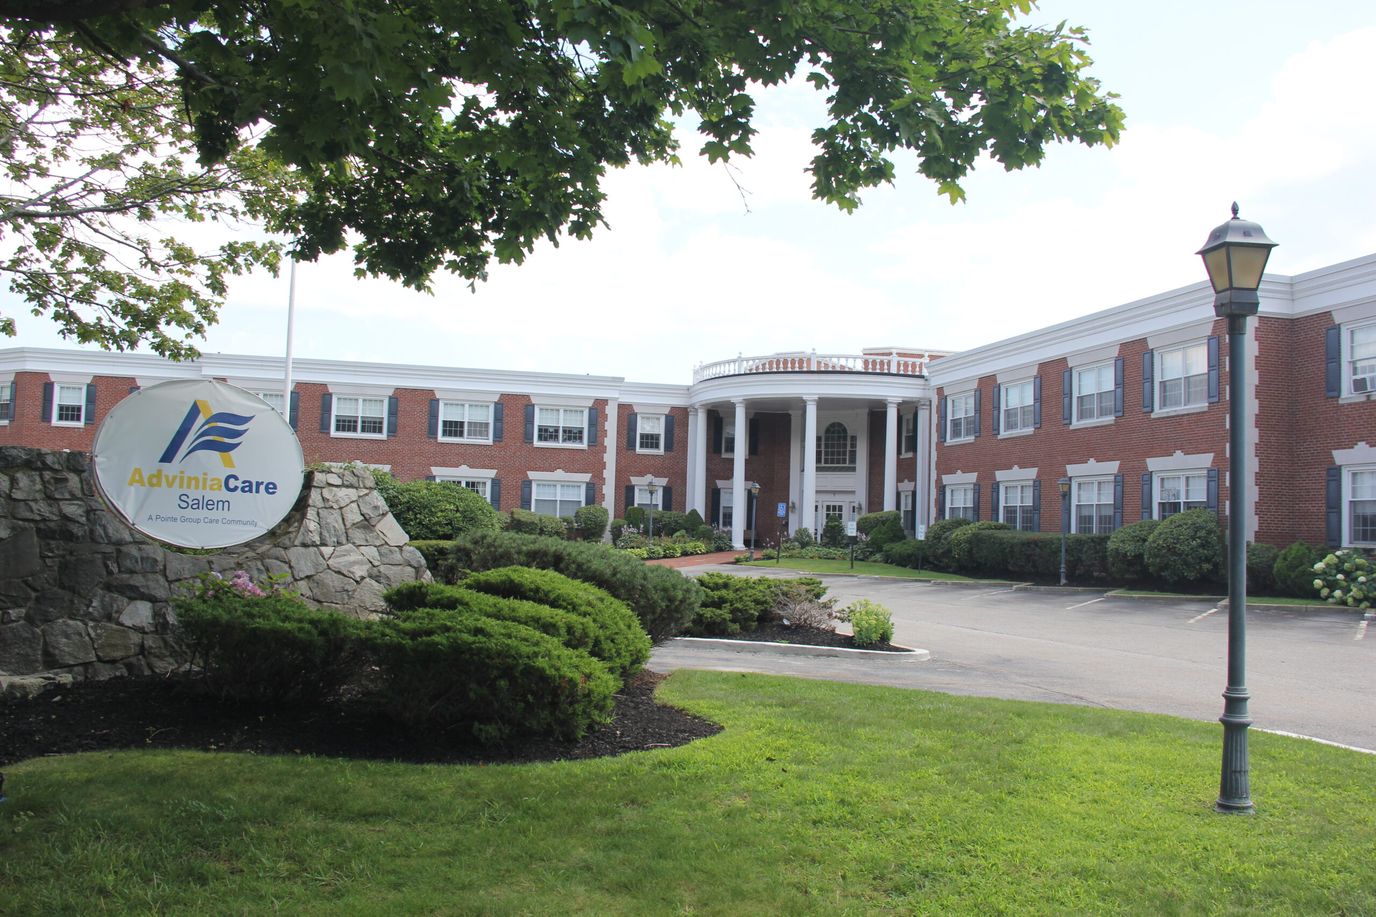
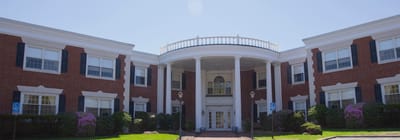
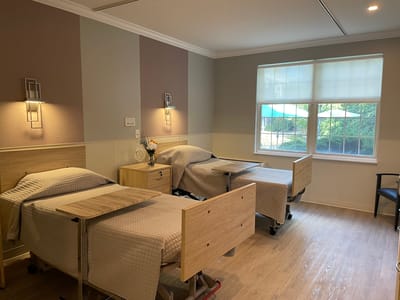
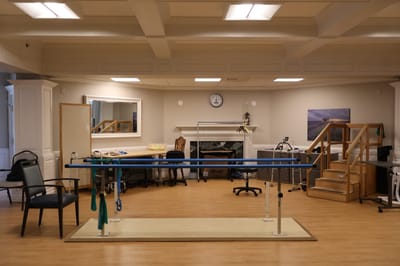
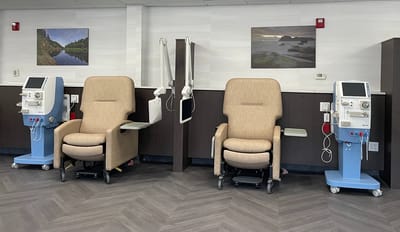
Adviniacare Salem is a nursing home in Salem, MA, that offers long-term care, rehabilitation, respite care, and skilled nursing. The community’s nurturing and welcoming environment ensures older adults can live comfortably. With round-the-clock nursing care, nutritious meals, and a wide range of care options, residents receive exceptional care to recover and return to their routines. Prioritizing residents’ holistic wellness, individualized care plans are also developed.

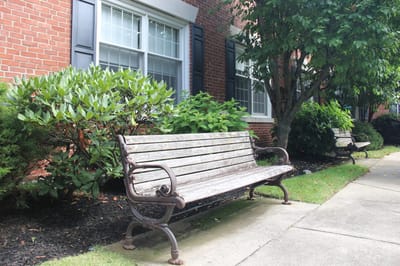
Card games, lectures, and trips encourage residents to explore interests and make friends. Accessible common areas, a library, and a cinema are among the well-maintained amenities dedicated to residents’ relaxation and wellness. Restaurants, shops, recreation sites, and public transportation are also available in the area, providing residents with quick access to necessities and leisure. Committed to helping older adults thrive in retirement, this nursing home is a great choice for senior living in Massachusetts.

Quality ratings

Measured by Centers for Medicare & Medicaid Services (CMS)

Overall rating Info The Overall CMS Rating combines results from health inspections, staffing levels and quality measures. Health inspections carry the most weight. Staffing and quality scores can increase or decrease the final rating based on performance compared to state and national standards.
▼ 31.0% Below MA avg. ▼ 31.0% Below MA avg.MA average: 2.9Click the badge to see the full State ranking.Click here to see the full State ranking.
Health Inspection Info Based on the results of the facility's three most recent standard inspections and any complaint investigations. CMS reviews the number, scope, and severity of deficiencies, with more recent findings weighted more heavily.
▼ 29.7% Below MA avg. ▼ 29.7% Below MA avg.MA average: 2.8Click the badge to see the full State ranking.Click here to see the full State ranking.
Staffing Info Measures average nursing staff hours per resident per day, including Registered Nurses (RNs) and total nursing staff. Ratings are adjusted based on the level of care residents require and are compared to state and national benchmarks.
▼ 33.3% Below MA avg. ▼ 33.3% Below MA avg.MA average: 3.0Click the badge to see the full State ranking.Click here to see the full State ranking.
Quality Measures Info Based on clinical and physical health indicators reported to CMS, such as hospital readmissions, falls, pressure ulcers, and improvements in mobility. These measures reflect how well residents' health needs are being managed.
▼ 37.1% Below MA avg. ▼ 37.1% Below MA avg.MA average: 3.2Click the badge to see the full State ranking.Click here to see the full State ranking.

Staffing hours breakdown

Info Daily nursing hours per resident by staff type, reported to CMS. Higher is generally better — compare this facility to state and national averages to see where staffing stands.

Hours per resident per day — compared to Massachusetts state averages

Staff typeHours / Day / Residentvs state avg
Registered Nurse (RN) Info RNs hold the highest nursing license and can assess residents, interpret test results, and direct care plans. More RN hours per day often signals stronger clinical oversight and faster response to health changes. 18m per day ▼ 54% State avg: 39m per day · National avg: 41m per day
LPN / LVN Info Licensed Practical Nurses (LPNs) or Licensed Vocational Nurses (LVNs) deliver routine hands-on care — medication administration, wound dressing, and monitoring vital signs. They work under RN supervision and make up a large share of daily bedside care. 1h 12m per day ▲ 24% State avg: 57m per day · National avg: 52m per day
Nurse Aide Info Certified Nurse Aides (CNAs) provide the most direct day-to-day assistance: bathing, dressing, feeding, and mobility. Nurse aide hours are typically the largest staffing category and directly affect residents' quality of life. 1h 56m per day ▼ 15% State avg: 2h 16m per day · National avg: 2h 20m per day
Weekend Total Nursing Info Combined nursing hours (RN + LPN + Nurse Aide) per resident per day on weekends. Staffing often drops on weekends — this figure reveals whether the facility maintains adequate coverage outside of weekday hours. 3h 12m per day ▼ 8% State avg: 3h 29m per day · National avg: 3h 27m per day
Physical Therapist Info Hours per resident per day provided by licensed Physical Therapists (PTs) or PT Assistants. PT services help residents recover mobility after injury or illness and are especially important for post-acute (short-stay) rehabilitation. 3m per day ▼ 35% State avg: 5m per day · National avg: 4m per day
Weekend RN Info Registered nurse hours specifically on weekends. Facilities sometimes reduce RN presence on Saturdays and Sundays — a low weekend RN figure compared to weekday hours can indicate reduced clinical oversight when most administrative staff are absent. 19m per day ▼ 31% State avg: 27m per day · National avg: 29m per day

Capacity and availability

This home usually has availability

Lower occupancy than the Massachusetts average: 82%
Occupancy rate
68.4% Rank #77 / 96Occupancy rate — State benchmarkedThis home is ranked 77th out of 96 homes in Massachusetts. Shows this facility's occupancy rate versus the Massachusetts average, with its Statewide rank out of 96. Higher occupancy signals strong local demand and financial stability.Rankings are based only on facilities in Massachusetts that report data for that category. Facilities without available data are excluded from the ranking.Click the rank badge to see the full State ranking.Click here to see the full State ranking.
Avg. Length of Stay
144 days
Bed community size
114-bed community Rank #72 / 280Bed count — State benchmarkedThis home is ranked 72nd out of 280 homes in Massachusetts. Shows this facility's certified or reported bed count compared to other Massachusetts facilities. Larger communities may offer more amenities, programs, and on-site services for residents and families.Rankings are based only on facilities in Massachusetts that report data for that category. Facilities without available data are excluded from the ranking.Click the rank badge to see the full State ranking.Click here to see the full State ranking.
A larger shared setting that may offer more common spaces and organized community services.
Walk Score
Walk Score: 71 / 100 Rank #165 / 499Walk Score — State benchmarkedThis home is ranked 165th out of 499 homes in Massachusetts. Shows how walkable this facility's neighborhood is compared to the average Walk Score across Massachusetts facilities. Higher scores benefit residents, families, and staff.Rankings are based only on facilities in Massachusetts that report data for that category. Facilities without available data are excluded from the ranking.Click the rank badge to see the full State ranking.Click here to see the full State ranking.
Very walkable. Most errands can be accomplished on foot, and many essentials are within a short walk.

Contact Adviniacare Salem

Staffing Data

Reporting period: October 1 – December 31, 2025 (Q4 2025). Source: CMS Payroll-Based Journal report.

Total staff 96
Employees 90
Contractors 6
Staff to resident ratio 1.00 : 1
40% fewer staff per resident than Massachusetts average
Massachusetts average ratio: 1.66 : 1 Massachusetts average ratio: 1.66 : 1See full Massachusetts ranking
Avg staff/day 45
Average shift 8.7 hours
10% better than Massachusetts average
Massachusetts average: 7.9 hours Massachusetts average shift: 7.9 hoursSee full Massachusetts ranking
Total staff hours (quarter) 36,108

Nursing staff breakdown

Q4 2025 · Oct 1 – Dec 31 More info This data comes from the CMS Payroll-Based Journal report covering October 1 – December 31, 2025.
Registered Nurse

Manages medical care and health needs.

RN Staff Info All 7 RN Staff are full-time employees. No contractors work on this role. 7
Average shift length Info Average shift length. Calculated as total hours divided by days worked and average staff per day. 10.6 hours
Licensed Practical Nurse

Assists with medical care and medications.

LPN Staff Info 26 total: 25 full-time employees and 1 contractor. 26
Average shift length Info Average shift length. Calculated as total hours divided by days worked and average staff per day. 9.6 hours
Certified Nursing Assistant

Helps with daily care and mobility.

CNA Staff Info All 36 CNA Staff are full-time employees. No contractors work on this role. 36
Average shift length Info Average shift length. Calculated as total hours divided by days worked and average staff per day. 9.1 hours

Contractor staffing

Q4 2025 · Oct 1 – Dec 31 More info This data comes from the CMS Payroll-Based Journal report covering October 1 – December 31, 2025.

Total hours from contractors

1.9%

670 contractor hours this quarter

Licensed Practical Nurse: 1 Occupational Therapy Aide: 1 Clinical Nurse Specialist: 1 Nurse Practitioner: 1 Medical Director: 1 Occupational Therapy Assistant: 1

Staff by category

Q4 2025 · Oct 1 – Dec 31 More info This data comes from the CMS Payroll-Based Journal report covering October 1 – December 31, 2025.
Certified Nursing Assistant3603617,90192100%9.1
Licensed Practical Nurse2512610,23092100%9.6
Registered Nurse7071,6618390%10.6
Other Dietary Services Staff6061,4498693%6.5
RN Director of Nursing3038176267%8
Speech Language Pathologist2028136672%6.8
Nurse Practitioner1126246267%8
Clinical Nurse Specialist4154906470%6
Administrator1014886166%8
Qualified Social Worker1014826470%7.5
Respiratory Therapy Technician1014625762%8.1
Physical Therapy Aide1014566166%7.5
Physical Therapy Assistant2021886166%2.4
Occupational Therapy Aide0114055%8
Occupational Therapy Assistant011511%5
Medical Director011311%3
36 Certified Nursing Assistant
% of Days 100%
26 Licensed Practical Nurse
% of Days 100%
7 Registered Nurse
% of Days 90%
6 Other Dietary Services Staff
% of Days 93%
3 RN Director of Nursing
% of Days 67%
2 Speech Language Pathologist
% of Days 72%
2 Nurse Practitioner
% of Days 67%
5 Clinical Nurse Specialist
% of Days 70%
1 Administrator
% of Days 66%
1 Qualified Social Worker
% of Days 70%
1 Respiratory Therapy Technician
% of Days 62%
1 Physical Therapy Aide
% of Days 66%
2 Physical Therapy Assistant
% of Days 66%
1 Occupational Therapy Aide
% of Days 5%
1 Occupational Therapy Assistant
% of Days 1%
1 Medical Director
% of Days 1%

Penalties and fines

Federal penalties imposed by CMS for regulatory violations, including civil money penalties (fines) and denials of payment for new Medicare/Medicaid admissions.

Source: CMS Penalties Database

No penalties in the past 3 years

No civil money penalties or payment denials were reported in the last 3 years.

Quality of care over time

These measures show how residents usually do over time at this home, based on health outcomes and preventive care.

High-risk clinical events score Info A composite score based on pressure ulcers, falls with injury, weight loss, walking ability decline, and activities of daily living decline. 15.0
47% worse than Massachusetts average

Massachusetts average: 10.2

Functional decline score Info A composite score based on activities of daily living decline, walking ability decline, and incontinence. 28.5
42% worse than Massachusetts average

Massachusetts average: 20.0

Long-stay resident measures
Need for Help with Daily Activities Increased Info Percent of long-stay residents whose need for help with daily activities has increased 28.3%
52% worse than Massachusetts average

Massachusetts average: 18.7%

Walking Ability Worsened Info Percent of long-stay residents whose ability to move independently worsened 28.5%
47% worse than Massachusetts average

Massachusetts average: 19.3%

Low Risk Residents with Bowel/Bladder Incontinence Info Percent of low risk long-stay residents who lose control of their bowels or bladder 28.6%
29% worse than Massachusetts average

Massachusetts average: 22.1%

Falls with Major Injury Info Percent of long-stay residents experiencing one or more falls with major injury 3.3%
7% better than Massachusetts average

Massachusetts average: 3.6%

High Risk Residents with Pressure Ulcers Info Percent of long-stay high risk residents with pressure ulcers 5.8%
24% worse than Massachusetts average

Massachusetts average: 4.7%

Urinary Tract Infection Info Percent of long-stay residents with a urinary tract infection 1.4%
31% better than Massachusetts average

Massachusetts average: 2.1%

Lost Too Much Weight Info Percent of long-stay residents who lose too much weight 9.1%
75% worse than Massachusetts average

Massachusetts average: 5.2%

Depressive Symptoms Info Percent of long-stay residents who have depressive symptoms 4.1%
62% better than Massachusetts average

Massachusetts average: 10.7%

Antipsychotic Use Info Percent of long-stay residents who received an antipsychotic medication 23.3%
15% worse than Massachusetts average

Massachusetts average: 20.3%

Pneumococcal Vaccine Info Percent of long-stay residents assessed and appropriately given the pneumococcal vaccine 96.4%
5% better than Massachusetts average

Massachusetts average: 91.9%

Influenza Vaccine Info Percent of long-stay residents assessed and appropriately given the seasonal influenza vaccine 93.9%
In line with Massachusetts average

Massachusetts average: 94.8%

Short-stay resident measures
Pneumococcal Vaccine Info Percent of short-stay residents assessed and appropriately given the pneumococcal vaccine 50.5%
34% worse than Massachusetts average

Massachusetts average: 76.7%

Antipsychotic medication increase Info Percent of short-stay residents who newly received an antipsychotic medication 2.9%
121% worse than Massachusetts average

Massachusetts average: 1.3%

Influenza Vaccine Info Percent of short-stay residents assessed and appropriately given the seasonal influenza vaccine 59.4%
24% worse than Massachusetts average

Massachusetts average: 77.7%

Breakdown by payment type

Medicare

31% of new residents, usually for short-term rehab.

Typical stay 24 days

Private pay

48% of new residents, often for short stays.

Typical stay 5 - 6 months

Medicaid

20% of new residents, often for long-term daily care.

Typical stay 9 - 10 months

Facility Characteristics

Source: CMS Long-Term Care Facility Characteristics (Data as of Jan 2026)

Total residents 96
Medicare
7
7.3% of residents
Medicaid
44
45.8% of residents
Private pay or other
45
46.9% of residents
Programs & Services
Residents Group

Residents meet regularly to discuss policies, care quality, and activities

Active Resident Council

Organized group of residents that meets regularly to discuss facility policies, quality of life, and activities.

Finances and operations

Based on CMS SNF Cost Report for fiscal year ending in 12/2023.

For-profit
Operated by a single business entity.
Net patient revenue Info Net patient revenue — what the home actually collects for resident care, after contractual allowances, bad debt and discounts are subtracted from its gross charges (CMS cost report, Worksheet G-3). It covers resident care only; money the home earns from other sources is shown separately as "Other income."
$8.9M
Net patient income Info Net patient income: net patient revenue minus the home's total operating expenses. A positive figure means it earns more from resident care than it spends to deliver it; a negative figure means the opposite. It excludes non-operating "other income."
-$1.2M
For-profit Operated by a single business entity.
Net patient revenue Info Net patient revenue — what the home actually collects for resident care, after contractual allowances, bad debt and discounts are subtracted from its gross charges (CMS cost report, Worksheet G-3). It covers resident care only; money the home earns from other sources is shown separately as "Other income."
$8.9M Rank #92 / 96Revenue — State benchmarkedThis home is ranked 92nd out of 96 homes in Massachusetts. Shows this facility's annual revenue compared to the Massachusetts average. Higher revenue generally means more resources for staffing and capital — read alongside Payroll %.Rankings are based only on facilities in Massachusetts that report data for that category. Facilities without available data are excluded from the ranking.Click the rank badge to see the full State ranking.Click here to see the full State ranking.
Net patient income Info Net patient income: net patient revenue minus the home's total operating expenses. A positive figure means it earns more from resident care than it spends to deliver it; a negative figure means the opposite. It excludes non-operating "other income."
-$1.2M
Other income Info Money the home earns outside of resident care — such as investments, grants, rentals and other non-operating sources (CMS cost report, Worksheet G-3). It is tracked separately from net patient revenue: it is not part of that figure, and it is not included in net patient income.
-$6.1K
Payroll costs Info Staff salaries plus wage-related costs — benefits such as payroll taxes, health insurance and retirement — from the home's own accounting records (CMS cost report, Worksheet A). Contract or agency labor is counted separately, under other operating costs. Rank #84 / 96Payroll — State benchmarkedThis home is ranked 84th out of 96 homes in Massachusetts. Shows total annual staff payroll benchmarked to the Massachusetts average. Higher payroll investment relative to peers often signals better staffing and less reliance on cheaper contract labor.Rankings are based only on facilities in Massachusetts that report data for that category. Facilities without available data are excluded from the ranking.Click the rank badge to see the full State ranking.Click here to see the full State ranking.
$4.3M 48.4% of net patient revenue Info Payroll as a share of revenue: staff salaries and wage-related benefits divided by net patient revenue. A higher figure means more of each revenue dollar goes to staff pay. Rank #12 / 96Payroll % — State benchmarkedThis home is ranked 12th out of 96 homes in Massachusetts. Shows payroll as a percentage of revenue versus the Massachusetts average. Well-run Massachusetts facilities typically land around 54–65% — the top third Statewide. Below 25% may signal understaffing or heavy agency use — read with Staffing ratings.Rankings are based only on facilities in Massachusetts that report data for that category. Facilities without available data are excluded from the ranking.Click the rank badge to see the full State ranking.Click here to see the full State ranking.
Other operating costs Info Everything it costs to run the home apart from payroll — food, utilities, supplies, maintenance, contract labor and administration. Calculated as total operating expense minus payroll (staff salaries and wage-related benefits).
$5.7M
Total costs Info The home's total operating expense for the year — all the costs of running it, salaries included (CMS cost report, Worksheet G-3).
$10.1M

What does this home offer?

Building type icon
Building type icon

Building Type: 2-story

On-site medical care and health services icon

On-site Medical Care and Health Services

Rehabilitative support icon

Rehabilitative Support

Beauty services icon

Beauty Services

Social and recreational activities icon

Social and Recreational Activities

Who this home usually serves

TYPE OF STAY

Mix of rehab and long-term care

This home supports both short-term rehab and long-term care, with residents staying for a wide range of durations.

New residents most often arrive under private pay (48% of admissions), and a typical private pay stay runs around 5 - 6 months.

Admissions
192 total

Coverage residents most often arrive under.

Medicare 31%
Private pay 48%
Medicaid 20%
Discharges
198 total

Coverage residents most often leave under.

Medicare 23%
Private pay 41%
Medicaid 35%

Places of interest near Adviniacare Salem

Address 2.7 miles from city center Info Estimated distance in miles from Salem's city center to Adviniacare Salem's address, calculated via Google Maps.

Calculate Travel Distance to Adviniacare Salem

Add your location

Address

Compare Nursing Homes around Salem

The information below is reported by the Massachusetts Executive Office of Elder Affairs and Department of Public Health.

3 facilities compared · CMS & MA Dept. of Health data

Bear Hill Rehabilitation and Nursing Center
NH
HC
NC
PC
RC
Stoneham
169
Facility 169
MA AVG 94
Rank #14 / 280
21.3%
Facility 21.3%
MA AVG 82%
Rank #94 / 96
-74%
3.64
Facility 3.64
MA AVG 3.93
Rank #68 / 93
+9%-7%
$16.1k
Facility $16.1k
MA AVG $76.6k
Rank #69 / 94
34
Facility 34
MA AVG 32.7
Rank #62 / 93
11.3
Facility 11.3
MA AVG 7.2
Rank #86 / 93
236A+
40
Facility 40
MA AVG 53
Rank #313 / 499
Colev Gestetner
$21.9M
Facility $21.9M
MA AVG $17.4M
Rank #29 / 96
$11.3M
Facility $11.3M
MA AVG $6.5M
Rank #37 / 96
51.6%
Facility 51.6%
MA AVG 43.6%
Rank #71 / 96
225272
Pilgrim Rehabilitation and Skilled Nursing Center
NH
HC
RC
Peabody
152
Facility 152
MA AVG 94
Rank #28 / 280
95.6%
Facility 95.6%
MA AVG 82%
Rank #10 / 96
+17%
3.67
Facility 3.67
MA AVG 3.93
Rank #58 / 93
+7%-7%
$0
Facility $0
MA AVG $76.6k
Rank #1 / 94
16
Facility 16
MA AVG 32.7
Rank #24 / 93
5.3
Facility 5.3
MA AVG 7.2
Rank #34 / 93
1123-
22
Facility 22
MA AVG 53
Rank #403 / 499
Fairview Extended Care Services Inc
$16.4M
Facility $16.4M
MA AVG $17.4M
Rank #24 / 96
$7.2M
Facility $7.2M
MA AVG $6.5M
Rank #29 / 96
43.8%
Facility 43.8%
MA AVG 43.6%
Rank #76 / 96
225048
Adviniacare Salem
NH
AL
HC
MC
Salem
114
Facility 114
MA AVG 94
Rank #72 / 280
68.4%
Facility 68.4%
MA AVG 82%
Rank #77 / 96
-17%- -43%-
$0
Facility $0
MA AVG $76.6k
Rank #1 / 94
42
Facility 42
MA AVG 32.7
Rank #72 / 93
14.0
Facility 14.0
MA AVG 7.2
Rank #89 / 93
-101-
71
Facility 71
MA AVG 53
Rank #165 / 499
Oc Eliot Center
$8.9M
Facility $8.9M
MA AVG $17.4M
Rank #92 / 96
$4.3M
Facility $4.3M
MA AVG $6.5M
Rank #84 / 96
48.4%
Facility 48.4%
MA AVG 43.6%
Rank #12 / 96
225516

Financial Assistance for
Nursing Home in Massachusetts

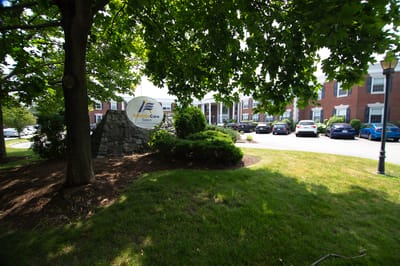
Adviniacare Salem is located in Salem, Massachusetts.
Here are the financial assistance programs available to residents in Massachusetts.

Get Financial aid guidance

Home Care Program

MassHealth Home Care

Age 60+
General Massachusetts resident, at risk of nursing home placement.
Income Limits (2025) ~$1,500/month individual, varies by region
Asset Limits $2,000 individual, excludes home, car
MA

Coordinated through Aging Services Access Points (ASAPs); high demand in urban areas.

Benefits
In-home care (3-5 hours/day) Homemaker services Respite care (up to 14 days/year) Adult day care (~$75/day)

Frail Elder Waiver

Massachusetts Medicaid FE Waiver

Age 65+
General Massachusetts resident, Medicaid-eligible, nursing home-level care need.
Income Limits (2025) ~$2,829/month 300% FBR, individual
Asset Limits $2,000 (individual), $3,000 (couple).
MA

Requires clinical eligibility determination.

Benefits
Personal care (5-7 hours/day) Respite care (240 hours/year) Adult day care (~$75/day) Home health services

Senior Care Options (SCO)

Massachusetts Senior Care Options

Age 65+
General Massachusetts resident, eligible for MassHealth (Medicare optional), nursing home-level care need.
Income Limits (2025) ~$2,829/month (300% FBR, individual); QIT allowed.
Asset Limits $2,000 (individual), $3,000 (couple) (excludes home up to $713,000, car).
MA

Not available in Dukes/Nantucket Counties; multiple SCO providers (e.g., CCA, Tufts).

Benefits
Personal care (5-7 hours/day) Medical care Respite (240 hours/year) Adult

Medicare Savings Program (MSP)

Massachusetts Medicare Savings Program (MassHealth Buy-In)

Age 65+ or disabled
General Massachusetts resident, Medicare Part A/B.
Income Limits (2025) ~$2,510/month (QMB), ~$3,380/month (SLMB), ~$3,598/month (QI)—individual.
Asset Limits $9,430 (individual), $14,130 (couple).
MA

Three tiers; no waitlist; includes Extra Help for Part D.

Benefits
Covers Part B premiums ($174.70/month) Deductibles ($240/year) Copays (~20%)

National Family Caregiver Support Program (NFCSP) Respite

Massachusetts NFCSP Respite Care

Age
General Caregivers of 60+ needing care or 55+ caregivers of others; Massachusetts resident; functional needs (2+ ADLs).
Income Limits (2025) Prioritizes ~$24,980/year (individual); no strict cap.
Asset Limits Not assessed; need-based.
MA

27 ASAPs; prioritizes low-income, rural caregivers.

Benefits
Respite (4-6 hours/week or 5 days/year) Adult day care ($60/day) Caregiver training Supplies (~$500/year)

Prescription Advantage

Massachusetts Prescription Advantage

Age 65+ or disabled
General Massachusetts resident, enrolled in Medicare Part D (or ineligible for Medicare).
Income Limits (2025) No strict limit; copays vary by income ~$24,980-$75,000/year individual
Asset Limits Not assessed.
MA

Supplements Medicare Part D; no enrollment fee for low-income.

Benefits
Covers prescription copays ($5-$40/drug) Fills coverage gaps Catastrophic cost protection ($4,000+ covered)

VA Aid and Attendance (A&A) and Housebound Benefits

Massachusetts VA Aid and Attendance/Housebound

Age 65+ or disabled veteran/spouse
General Massachusetts resident, wartime service, need for ADL help (A&A) or homebound.
Income Limits (2025) Net income < ~$1,984/month (veteran with dependent, A&A); pension offsets income.
Asset Limits ~$155,356 net worth limit
MA

High veteran demand statewide.

Benefits
Cash (~$1,433-$2,642/month veteran, ~$951-$1,318 spouse) for care costs (e.g., in-home, assisted living)

Frequently Asked Questions about Adviniacare Salem

Is Adviniacare Salem in a walkable area?

Adviniacare Salem has a walk score of 71. Very walkable. Most errands can be accomplished on foot, and many essentials are within a short walk.

What is the occupancy rate at Adviniacare Salem?

Adviniacare Salem's occupancy is 68.4%.

Does Adviniacare Salem operate as a for-profit or non-profit?

Adviniacare Salem is registered as a for-profit.

Are there photos of Adviniacare Salem?

Yes — there are 7 photos of Adviniacare Salem in the photo gallery on this page.

What is the address of Adviniacare Salem?

Adviniacare Salem is located at 7 Loring Hills Ave, Salem, MA 01970.

What is the phone number of Adviniacare Salem?

(978) 741-5700 will put you in contact with the team at Adviniacare Salem.

Is Adviniacare Salem Medicare or Medicaid certified?

Yes — Adviniacare Salem is a CMS-certified provider of Medicare and Medicaid.

Guides for Better Senior Living

Care Cost Calculator: See Prices in Your Area

Nursing Home Data Explorer

Don’t Wait Too Long: 7 Red Flag Signs Your Parent Needs Assisted Living Now

The True Cost of Assisted Living in 2025 – And How Families Are Paying For It

Understanding Senior Living Costs: Pricing Models, Discounts & Financial Assistance