


Total staff
132
Employees
130
Contractors
2
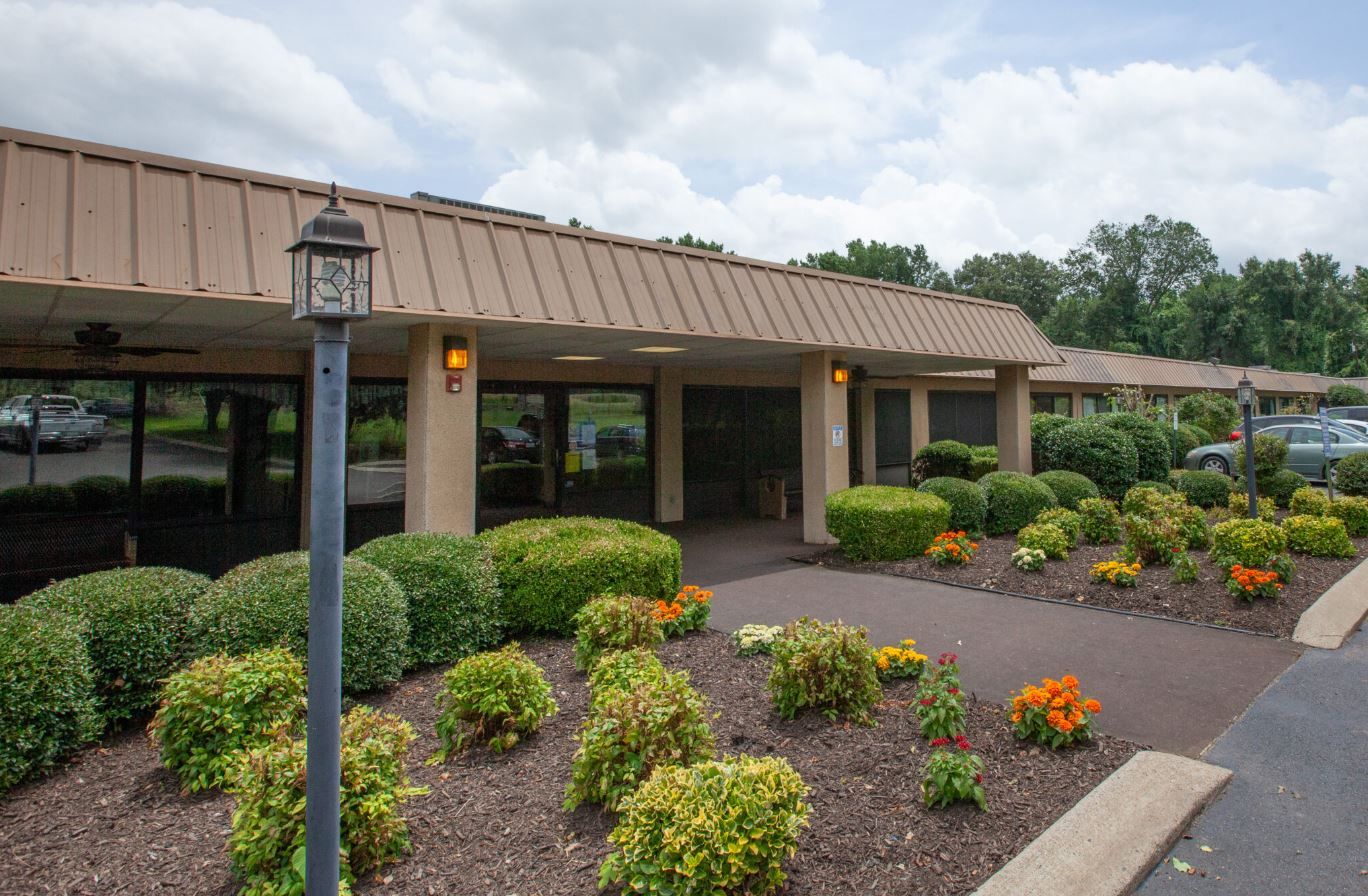
Ahc Dyersburg is an assisted living community in Dyersburg, Tennessee, that offers personal care and nursing services with 130 beds in a suite-style housing. Owned by Stephanie Burkett, the community accepts Medicare, Medicaid, and private pay, offering families multiple ways to navigate care costs. Currently, it operates at about 76% occupancy, with an average stay of 155 days, reflecting a combination of short-term rehabilitation and longer-term care for older adults.
Through Collaborative Care Plans, the community brings together physicians, nurses, therapists, dietary specialists, and social workers to support each resident. Speech, physical, and occupational therapy are also available, along with outpatient rehabilitation for older adults recovering after hospital stays. Nursing care averages about 3 hours and 13 minutes per resident daily, including more than half an hour from registered nurses.
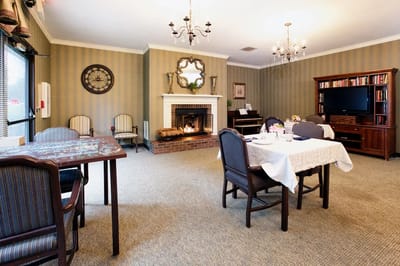
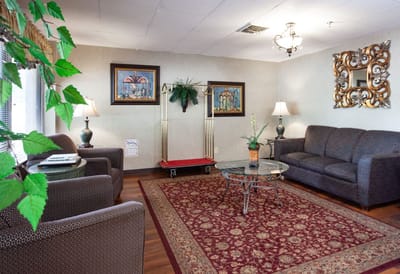
Transportation services, fitness activities, and recreation programming are offered to support daily engagement. Moreover, pets are welcome to promote familiar routines and companionship. A resident council also meets regularly to provide input on care, activities, and community operations, giving residents a voice in daily life.
Located in a rural area of Dyersburg, the neighborhood has a Walk Score of 34, indicating that some nearby services are accessible on foot, while most errands require transportation.
| Staff type | Hours / Day / Resident | vs state avg |
|---|---|---|
|
Registered Nurse (RN)
| 34m per day | ▼ 5% State avg: 35m per day · National avg: 41m per day |
|
LPN / LVN
| 56m per day | ▼ 14% State avg: 1h 5m per day · National avg: 52m per day |
|
Nurse Aide
| 2h 4m per day | ▼ 4% State avg: 2h 8m per day · National avg: 2h 20m per day |
|
Weekend Total Nursing
| 3h 13m per day | ▼ 4% State avg: 3h 21m per day · National avg: 3h 27m per day |
|
Physical Therapist
| 3m per day | ▼ 44% State avg: 5m per day · National avg: 4m per day |
|
Weekend RN
| 22m per day | ▼ 5% State avg: 23m per day · National avg: 29m per day |
Reporting period: October 1 – December 31, 2025 (Q4 2025). Source: CMS Payroll-Based Journal report.
Manages medical care and health needs.
Assists with medical care and medications.
Helps with daily care and mobility.
Total hours from contractors
752 contractor hours this quarter
| Certified Nursing Assistant | 62 | 0 | 62 | 18,460 | 92 | 100% | 8 |
| Licensed Practical Nurse | 25 | 0 | 25 | 7,009 | 92 | 100% | 9.1 |
| Registered Nurse | 15 | 0 | 15 | 3,911 | 92 | 100% | 8.7 |
| Speech Language Pathologist | 6 | 0 | 6 | 1,455 | 84 | 91% | 7.5 |
| RN Director of Nursing | 3 | 0 | 3 | 1,330 | 88 | 96% | 8.1 |
| Physical Therapy Assistant | 2 | 0 | 2 | 796 | 65 | 71% | 7.8 |
| Occupational Therapy Aide | 0 | 1 | 1 | 685 | 80 | 87% | 8.6 |
| Clinical Nurse Specialist | 5 | 0 | 5 | 638 | 62 | 67% | 7.6 |
| Administrator | 1 | 0 | 1 | 512 | 64 | 70% | 8 |
| Nurse Practitioner | 1 | 0 | 1 | 464 | 58 | 63% | 8 |
| Qualified Social Worker | 2 | 0 | 2 | 453 | 60 | 65% | 7.6 |
| Dietitian | 1 | 0 | 1 | 411 | 55 | 60% | 7.5 |
| Respiratory Therapy Technician | 3 | 0 | 3 | 383 | 66 | 72% | 4.9 |
| Mental Health Service Worker | 1 | 0 | 1 | 376 | 59 | 64% | 6.4 |
| Physical Therapy Aide | 3 | 0 | 3 | 349 | 50 | 54% | 5.5 |
| Medical Director | 0 | 1 | 1 | 67 | 28 | 30% | 2.4 |
Federal penalties imposed by CMS for regulatory violations, including civil money penalties (fines) and denials of payment for new Medicare/Medicaid admissions.
Source: CMS Penalties Database
No penalties in the past 3 years
No civil money penalties or payment denials were reported in the last 3 years.
These measures show how residents usually do over time at this home, based on health outcomes and preventive care.
Tennessee average: 10.5
Tennessee average: 19.5
Tennessee average: 16.0%
Tennessee average: 21.7%
Tennessee average: 20.7%
Tennessee average: 3.7%
Tennessee average: 5.4%
Tennessee average: 2.1%
Tennessee average: 6.3%
Tennessee average: 11.0%
Tennessee average: 16.5%
Tennessee average: 89.9%
Tennessee average: 94.5%
Tennessee average: 79.7%
Tennessee average: 1.7%
Tennessee average: 79.8%
Quality measures are calculated from Minimum Data Set (MDS) assessments. For most measures, lower percentages indicate better care quality.
46% of new residents, usually for short-term rehab.
51% of new residents, often for short stays.
3% of new residents, often for long-term daily care.
Source: CMS Long-Term Care Facility Characteristics (Data as of Jan 2026)
Residents meet regularly to discuss policies, care quality, and activities
Organized group of residents that meets regularly to discuss facility policies, quality of life, and activities.
Data sourced from CMS Long-Term Care Facility Characteristics quarterly report. Payer mix reflects the current resident census by primary payment source.
Historical financial and operational data for AHC Dyersburg from 2011–2023, based on CMS SNF Cost Reports.
Key figures below are for fiscal year ending in 12/2023.
Based on CMS SNF Cost Report for fiscal year ending in 12/2023.
Pets Allowed
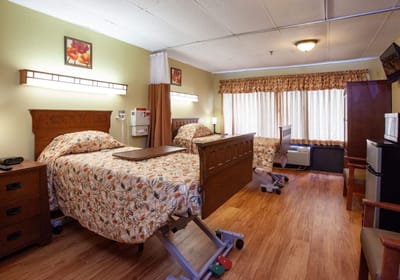
Housing Options: Suite
Transportation Services
Fitness and Recreation
This home supports both short-term rehab and long-term care, with residents staying for a wide range of durations.
Most new residents arrive under private pay (51% of admissions), and a typical private pay stay runs around 2 - 3 months.
Coverage residents most often arrive under.
Coverage residents most often leave under.
![]() 1.3 miles from city center
1.3 miles from city center
![]() Estimated distance in miles from Dyersburg's city center to AHC Dyersburg's address, calculated via Google Maps.
Estimated distance in miles from Dyersburg's city center to AHC Dyersburg's address, calculated via Google Maps.
Add your location
The information below is reported by the Tennessee Department of Health, Division of Health Care Facilities.
| Dyersburg Health and Rehabilitation Center | NH HOS MC PC RC SNF | Dyersburg | 123
Facility
123
TN AVG
88
Rank
#77 / 425 | - | - | 5.06
Facility
5.06
TN AVG
3.63
Rank
#9 / 190 | +80% | +39% | $0
Facility
$0
TN AVG
$90.9k
Rank
#1 / 196 | 3
Facility
3
TN AVG
15.4
Rank
#11 / 194 | 3.0
Facility
3.0
TN AVG
4.4
Rank
#48 / 194 | - | 64 | - |
36
Facility
36
TN AVG
34
Rank
#259 / 551 | The Bay At Dyersburg Health And Rehabili | - | - | - | 445071 | ||||
| Oakwood Community Living Center | NH HOS RC SNF | Dyersburg | 50
Facility
50
TN AVG
88
Rank
#340 / 425 |
86.0%
Facility
86.0%
TN AVG
71.5
Rank
#66 / 272 | +20% | 3.76
Facility
3.76
TN AVG
3.63
Rank
#45 / 190 | +55% | +4% | $0
Facility
$0
TN AVG
$90.9k
Rank
#1 / 196 | 12
Facility
12
TN AVG
15.4
Rank
#76 / 194 | 4.0
Facility
4.0
TN AVG
4.4
Rank
#82 / 194 | - | 43 | - |
40
Facility
40
TN AVG
34
Rank
#230 / 551 | Lori Chambers | $3.6MFiscal year ending 12/2023
Facility
$3.6MFiscal year ending 12/2023
TN AVG
$11.5M
Rank
#191 / 194 | $2.0MFiscal year ending 12/2023
Facility
$2.0MFiscal year ending 12/2023
TN AVG
$4.6M
Rank
#191 / 194 | 56.2%Fiscal year ending 12/2023
Facility
56.2%Fiscal year ending 12/2023
TN AVG
41%
Rank
#95 / 194 | 445335 | ||||
| AHC Dyersburg | NH SNF | Dyersburg | 130
Facility
130
TN AVG
88
Rank
#56 / 425 |
75.0%
Facility
75.0%
TN AVG
71.5
Rank
#139 / 272 | +5% | 3.21
Facility
3.21
TN AVG
3.63
Rank
#133 / 190 | +30% | -11% | $0
Facility
$0
TN AVG
$90.9k
Rank
#1 / 196 | 21
Facility
21
TN AVG
15.4
Rank
#143 / 194 | 7.0
Facility
7.0
TN AVG
4.4
Rank
#171 / 194 | - | 98 | - |
34
Facility
34
TN AVG
34
Rank
#279 / 551 | Stephanie Burkett | $11.8MFiscal year ending 12/2023
Facility
$11.8MFiscal year ending 12/2023
TN AVG
$11.5M
Rank
#52 / 194 | $5.0MFiscal year ending 12/2023
Facility
$5.0MFiscal year ending 12/2023
TN AVG
$4.6M
Rank
#112 / 194 | 42.6%Fiscal year ending 12/2023
Facility
42.6%Fiscal year ending 12/2023
TN AVG
41%
Rank
#188 / 194 | 445446 |
AHC Dyersburg is located in Dyersburg, Tennessee.
Here are the financial assistance programs available to residents in Tennessee.
AHC Dyersburg has a walk score of 34. Somewhat walkable. A few nearby services may be reachable on foot, but most trips require transportation.
AHC Dyersburg's occupancy is 75.8%.
Yes, AHC Dyersburg allows residents to bring their pets.
AHC Dyersburg is registered as a for-profit.
Yes — there are 4 photos of AHC Dyersburg in the photo gallery on this page.
AHC Dyersburg is located at 1900 Parr Ave, Dyersburg, TN 38024.
(731) 286-1221 will put you in contact with the team at AHC Dyersburg.
Care Cost Calculator: See Prices in Your Area
Nursing Home Data Explorer
Don’t Wait Too Long: 7 Red Flag Signs Your Parent Needs Assisted Living Now
The True Cost of Assisted Living in 2025 – And How Families Are Paying For It
Understanding Senior Living Costs: Pricing Models, Discounts & Financial Assistance


