

Occupancy rate
35%

We arrange tours, appointments, and even moving support so you don’t have to
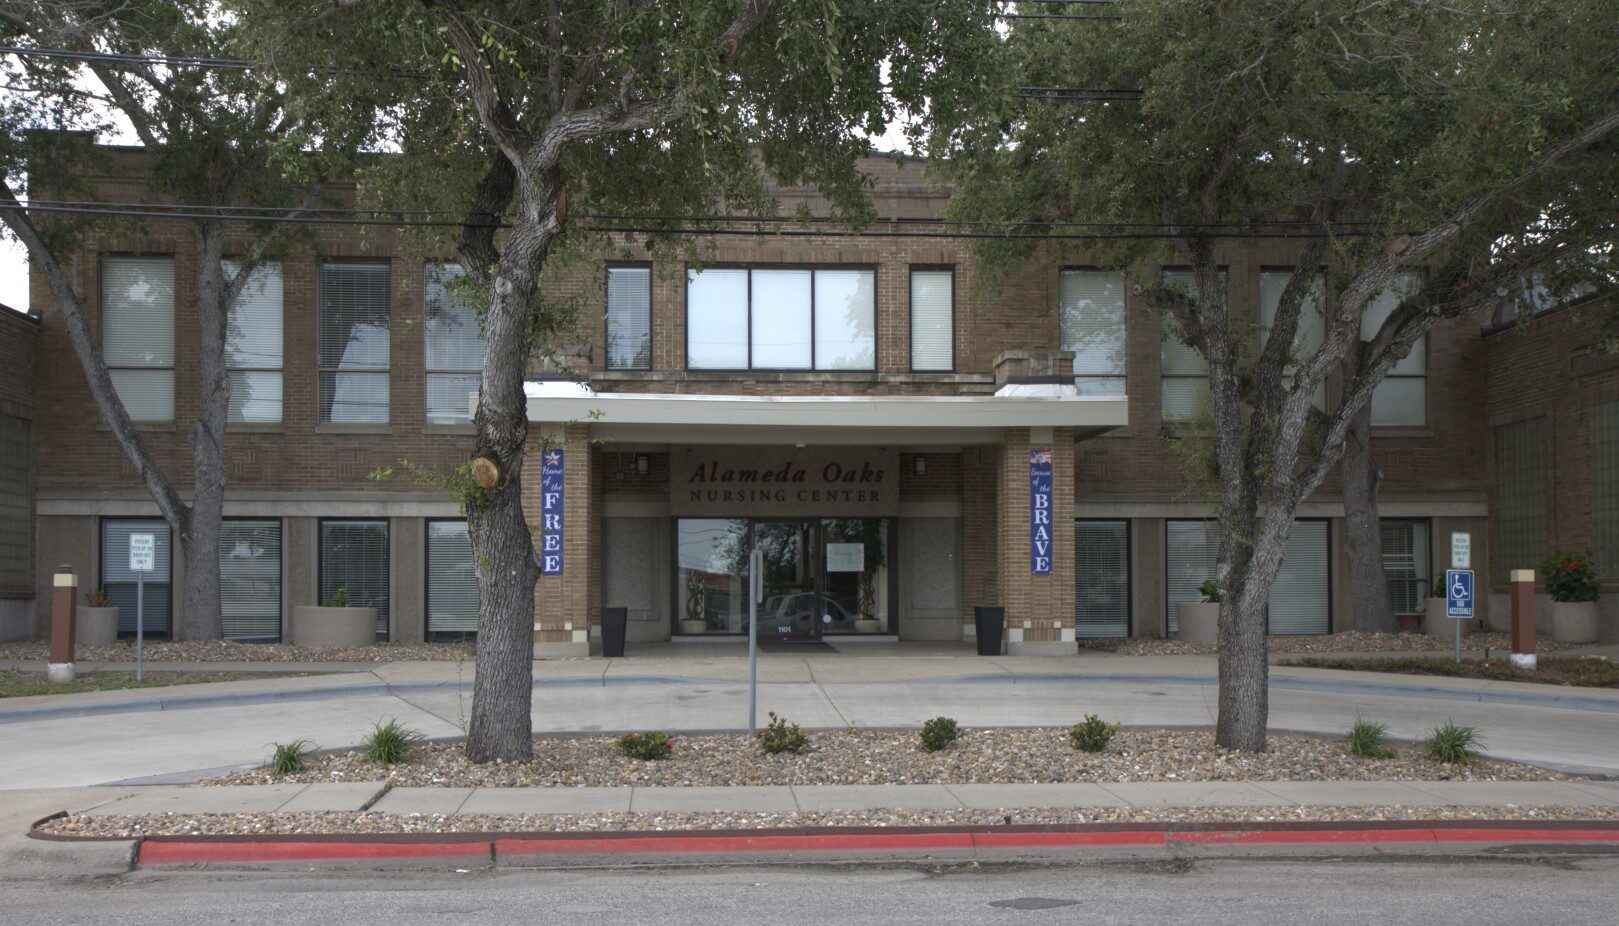
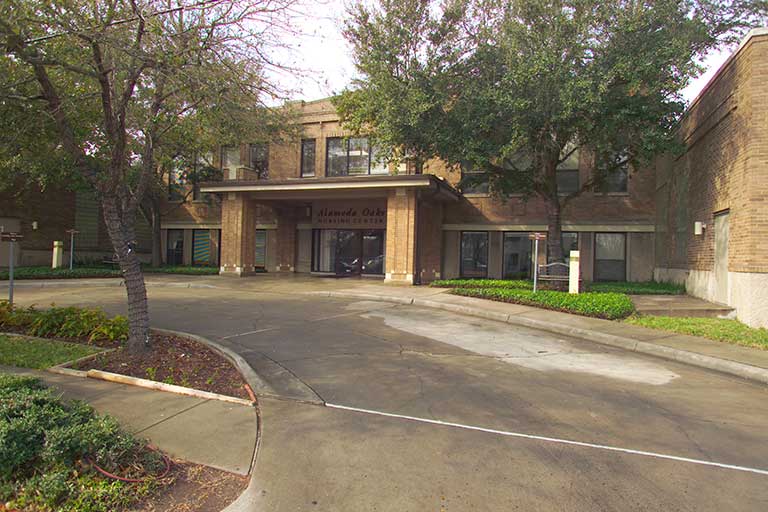
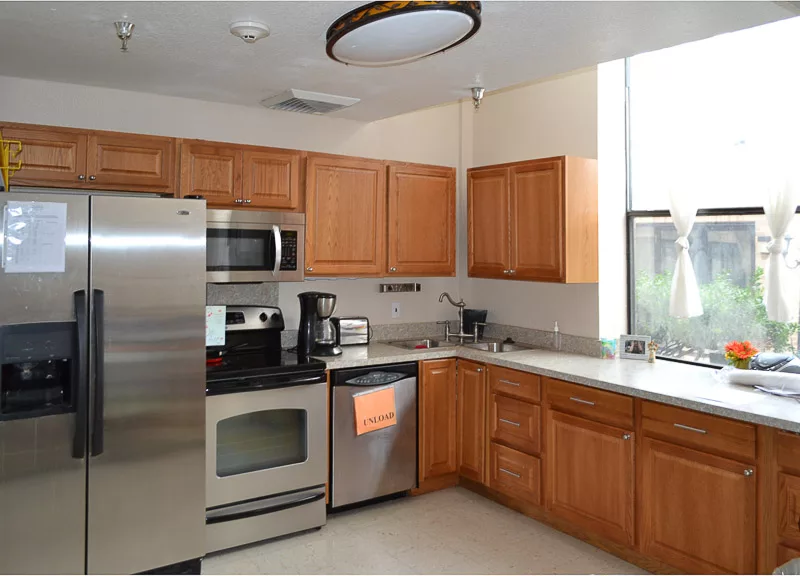
Located in Corpus Christi, TX, is Alameda Oaks Nursing Center, a facility that offers excellent skilled nursing and rehabilitation services to its residents. This skilled nursing facility provides its residents quality skilled nursing care 24/7, as well as medication management and administration assistance, wound care, and assistance with daily living activities.
Additionally as part of both their nursing and rehabilitation services, they provide fall prevention programs, and social services. During the residents’ stay at Alameda Oaks, they also receive meal provisions through their dining program, aimed to provide residents with proper nutrition, as well as therapy services like physical, occupational, and speech as needed.
 Official CMS rating based on health inspections, staffing and quality measures.
Official CMS rating based on deficiencies found during state health inspections.
Official CMS rating based on nurse staffing hours per resident per day.
Official CMS rating based on clinical outcomes for residents.
Average daily nursing hours per resident (adjusted for acuity). Higher values indicate more nursing time per resident.
Hours of care per resident per day, broken down by staff type. Data from CMS Medicare.
Registered nurse hours per resident per day.
Official CMS rating based on health inspections, staffing and quality measures.
Official CMS rating based on deficiencies found during state health inspections.
Official CMS rating based on nurse staffing hours per resident per day.
Official CMS rating based on clinical outcomes for residents.
Average daily nursing hours per resident (adjusted for acuity). Higher values indicate more nursing time per resident.
Hours of care per resident per day, broken down by staff type. Data from CMS Medicare.
Registered nurse hours per resident per day.
Offers a balance of services and community atmosphere.
Lower occupancy suggests more openings may be available.
Most residents stay for extended periods and receive ongoing daily care.
27% of new residents, usually for short-term rehab.
35% of new residents, often for short stays.
37% of new residents, often for long-term daily care.
The portion of the home's budget spent on staff, including nurses, caregivers, and other employees who support care and operations.
All remaining costs needed to run the home, such as food, utilities, building maintenance, supplies and administrative expenses.
Alameda Oaks Nursing Center is administrated by MS. ARACELI V MORENO.
Key information about the people who lead and staff this community.
Texas average 7.4
Last Health inspection on Aug 2025
Health citations are formal notices following inspections when they fail to comply with safety and care standards.
14 of 26 citations resulted from standard inspections; 5 of 26 resulted from complaint investigations; and 7 of 26 came from combined inspections (standard and complaint).
Texas average: 2
Texas average: 0.4
Data sourced from CMS Health Deficiencies reports. Citation severity codes range from A (least serious) to L (most serious). Immediate Jeopardy (J-L) citations indicate situations where the facility's noncompliance has placed residents at risk of death or serious harm.
Home Care
Hospice Care
Nursing Homes 24/7 care needed
Nursing Homes 24/7 care needed
Nursing Homes 24/7 care needed
Nursing Homes 24/7 care needed
Nursing Homes 24/7 care needed
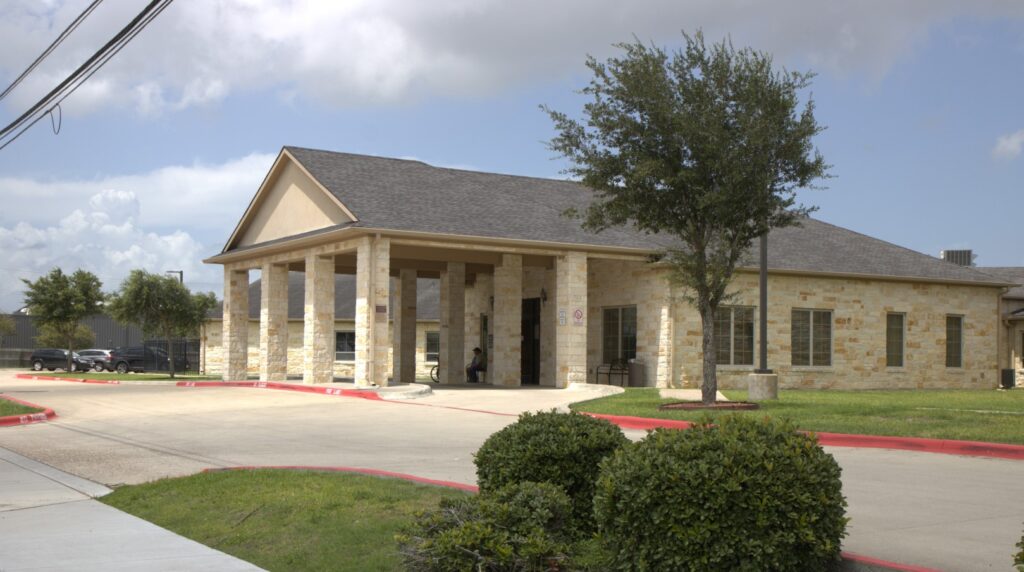 Windsor Calallen
 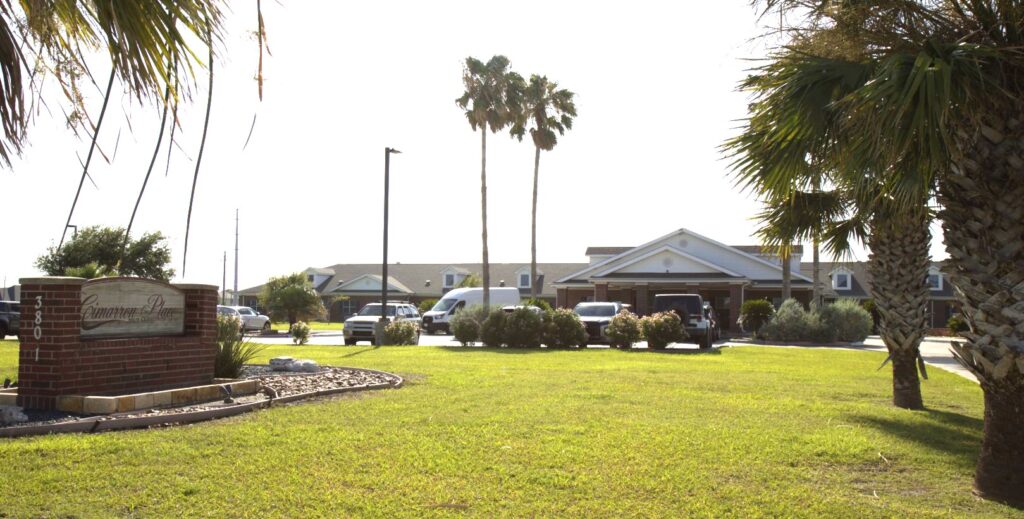 Cimarron Place Health and Rehabilitation Center
 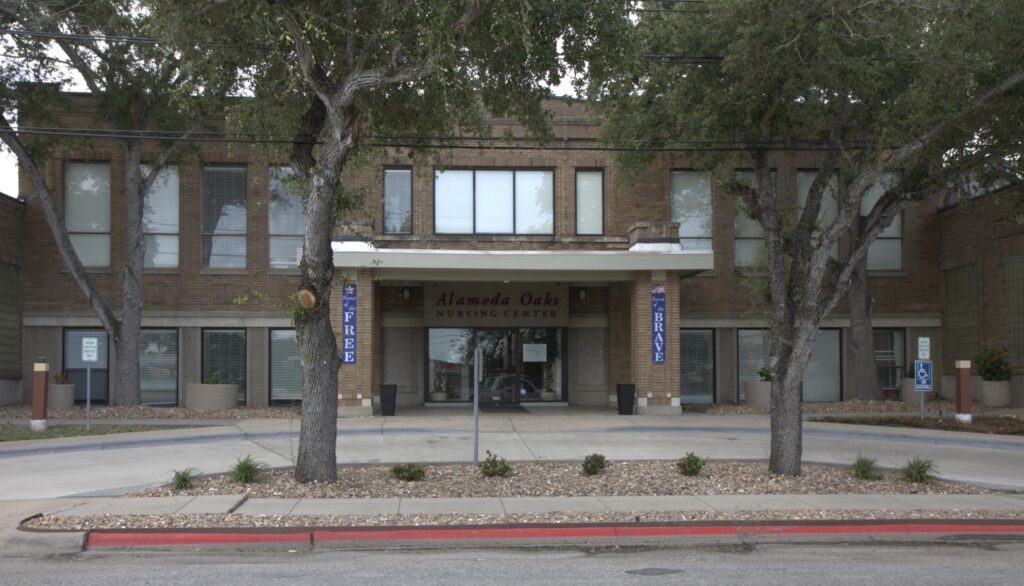 Alameda Oaks Nursing Center
  River Ridge Nursing and Rehabilitation
  San Rafael Nursing and Rehabilitation
![]() 2.9 miles from city center — 0.37 miles to nearest hospital (CC Medical Tower)
2.9 miles from city center — 0.37 miles to nearest hospital (CC Medical Tower)
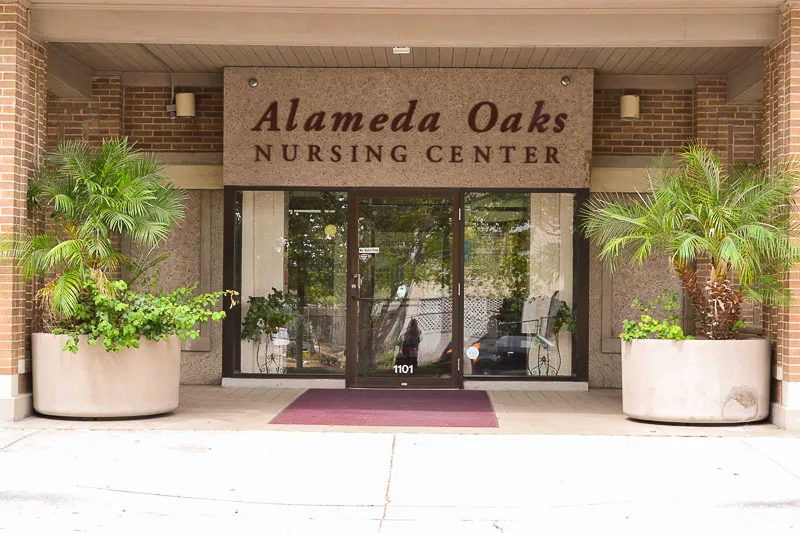
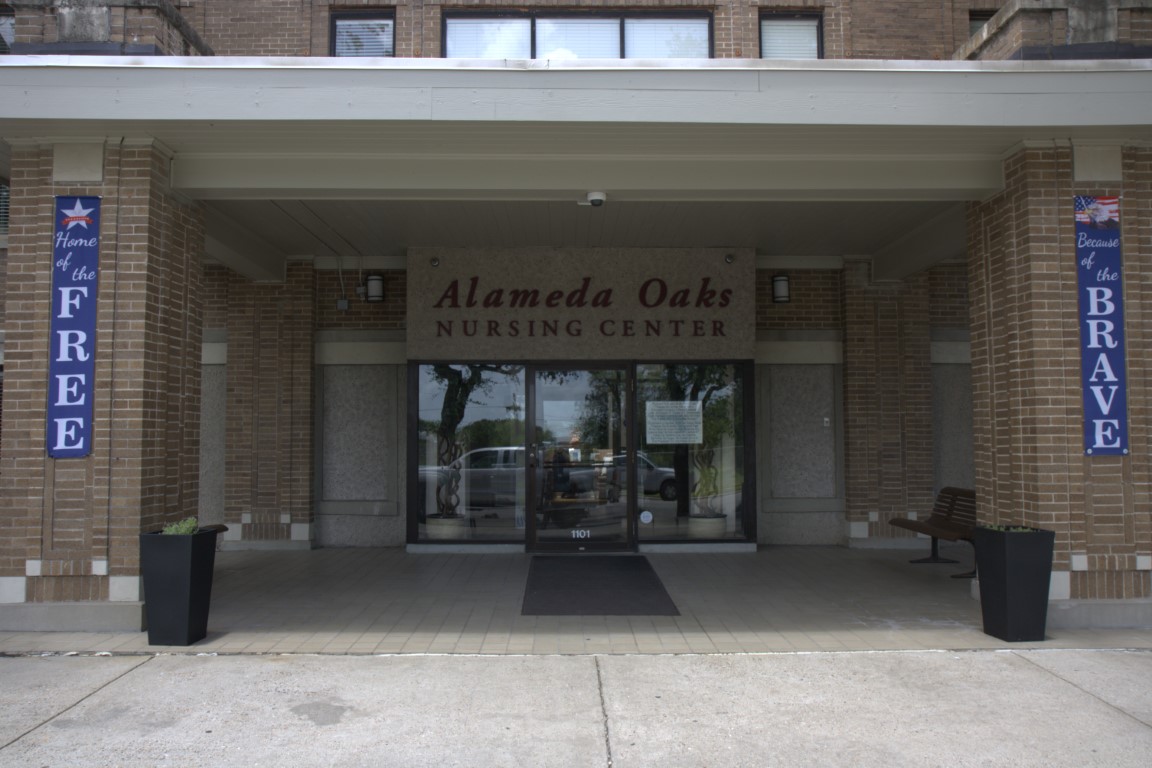
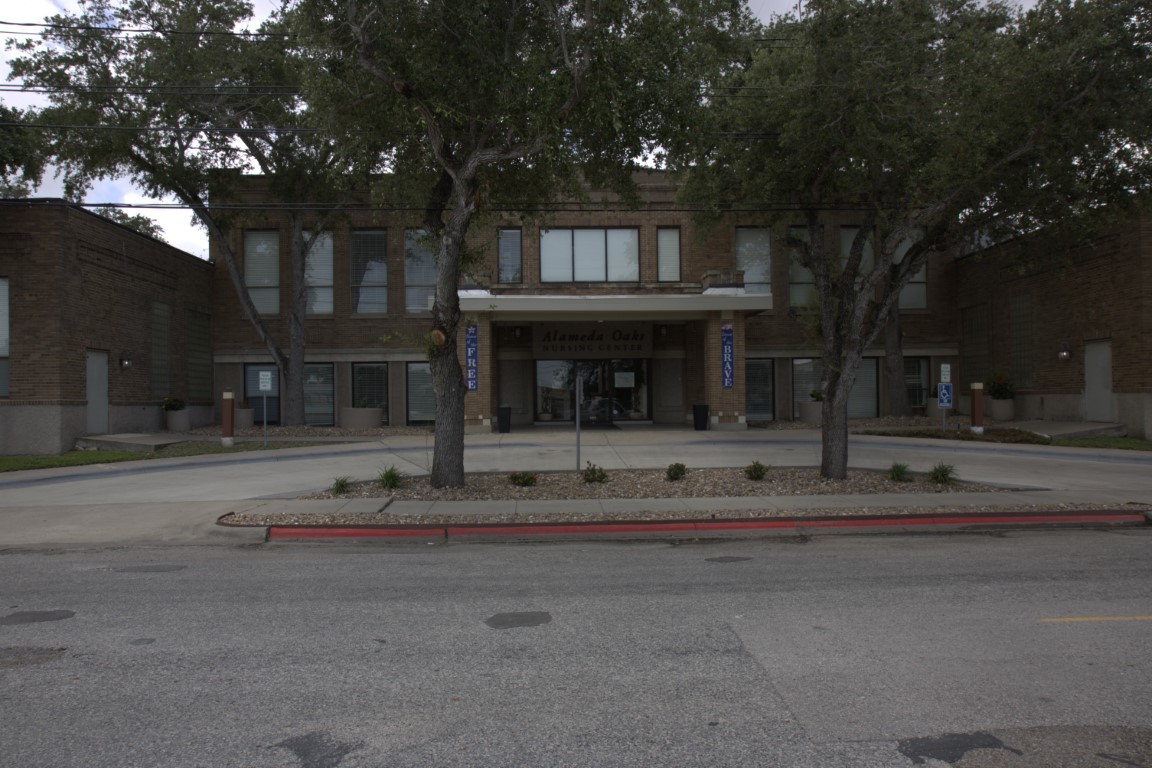
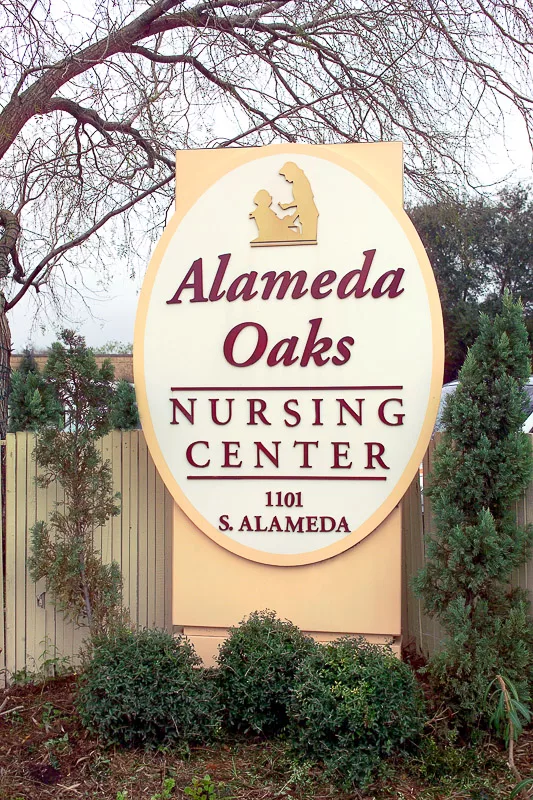
![]() 1101 S Alameda St, Corpus Christi, TX 78404
1101 S Alameda St, Corpus Christi, TX 78404
Add your location
Source: CMS Payroll-Based Journal (Q2 2025)
| Role ⓘ | Count ⓘ | Avg Shift (hrs) ⓘ | Uses Contractors? ⓘ |
|---|---|---|---|
| Registered Nurse | 4 | 7.4 | No |
| Licensed Practical Nurse | 21 | 8.3 | Yes |
| Certified Nursing Assistant | 52 | 7.9 | Yes |
| Role ⓘ | Employees ⓘ | Contractors ⓘ | Total Staff ⓘ | Total Hours ⓘ | Days Worked ⓘ | % of Days ⓘ | Avg Shift (hrs) ⓘ |
|---|---|---|---|---|---|---|---|
| Certified Nursing Assistant | 27 | 25 | 52 | 10,697 | 91 | 100% | 7.9 |
| Licensed Practical Nurse | 16 | 5 | 21 | 4,842 | 91 | 100% | 8.3 |
| Registered Nurse | 4 | 0 | 4 | 1,980 | 91 | 100% | 7.4 |
| RN Director of Nursing | 4 | 0 | 4 | 1,330 | 82 | 90% | 8.6 |
| Nurse Aide in Training | 11 | 0 | 11 | 1,320 | 63 | 69% | 7.2 |
| Other Dietary Services Staff | 2 | 0 | 2 | 758 | 90 | 99% | 7 |
| Physical Therapy Aide | 4 | 0 | 4 | 741 | 66 | 73% | 6.1 |
| Medication Aide/Technician | 3 | 0 | 3 | 714 | 64 | 70% | 10.9 |
| Administrator | 1 | 0 | 1 | 520 | 65 | 71% | 8 |
| Dietitian | 1 | 0 | 1 | 501 | 66 | 73% | 7.6 |
| Speech Language Pathologist | 4 | 0 | 4 | 448 | 66 | 73% | 5.4 |
| Respiratory Therapy Technician | 1 | 0 | 1 | 200 | 45 | 49% | 4.4 |
| Physical Therapy Assistant | 2 | 0 | 2 | 151 | 48 | 53% | 3.1 |
| Qualified Social Worker | 3 | 0 | 3 | 150 | 54 | 59% | 2.8 |
| Mental Health Service Worker | 1 | 0 | 1 | 144 | 18 | 20% | 8 |
| Nurse Practitioner | 0 | 1 | 1 | 112 | 14 | 15% | 8 |
| Occupational Therapy Assistant | 0 | 2 | 2 | 37 | 3 | 3% | 9.2 |
| Other Physician | 0 | 1 | 1 | 29 | 3 | 3% | 9.5 |
| Occupational Therapy Aide | 0 | 1 | 1 | 13 | 4 | 4% | 3.3 |
Source: CMS Long-Term Care Facility Characteristics (Data as of Jan 2026)
Residents meet regularly to discuss policies, care quality, and activities
Organized group of residents that meets regularly to discuss facility policies, quality of life, and activities.
Data sourced from CMS Long-Term Care Facility Characteristics quarterly report. Payer mix reflects the current resident census by primary payment source.
These measures show how residents usually do over time at this home, based on health outcomes and preventive care.
Texas average: 8.6
Texas average: 16.0
Texas average: 16.2%
Texas average: 16.2%
Texas average: 15.7%
Texas average: 3.2%
Texas average: 4.4%
Texas average: 0.8%
Texas average: 3.5%
Texas average: 2.9%
Texas average: 7.9%
Texas average: 97.3%
Texas average: 97.9%
Texas average: 2.13
Texas average: 2.07
Texas average: 90.4%
Texas average: 1.4%
Texas average: 88.0%
Texas average: 25.9%
Texas average: 12.0%
Texas average: 0.8%
Texas average: 53.7%
Texas average: 50.6%
Quality measures are calculated from Minimum Data Set (MDS) assessments. For most measures, lower percentages indicate better care quality.
Federal penalties imposed by CMS for regulatory violations, including civil money penalties (fines) and denials of payment for new Medicare/Medicaid admissions.
Source: CMS Penalties Database (Data as of Jan 2026)
Texas average: $80K
Texas average: 2.5
Texas average: 0.2
Penalties are imposed by CMS for violations of federal nursing home regulations.
Last updated: Jan 2026
Historical financial and operational data for Alameda Oaks Nursing Center based on CMS SNF Cost Reports.
Loading trend charts...
Care Cost Calculator: See Prices in Your Area
Nursing Home Data Explorer
Don’t Wait Too Long: 7 Red Flag Signs Your Parent Needs Assisted Living Now
The True Cost of Assisted Living in 2025 – And How Families Are Paying For It
Understanding Senior Living Costs: Pricing Models, Discounts & Financial Assistance

Touring a community? Use this expert-backed checklist to stay organized, ask the right questions, and find the perfect fit.
We'll send you a PDF version of the touring checklist.


