Alden Court Nursing Care
Nursing Home, Hospice Care, Nursing Care & Palliative Care · Fairhaven, MA
CMS overall rating Info CMS (the Centers for Medicare & Medicaid Services) is the federal agency that rates nursing home quality. Its Overall Rating runs from 1 to 5 stars, combining health inspections, staffing, and quality measures, with inspections weighted most heavily.

Alden Court Nursing Care

Nursing Home, Hospice Care, Nursing Care & Palliative Care · Fairhaven, MA
CMS overall rating Info CMS (the Centers for Medicare & Medicaid Services) is the federal agency that rates nursing home quality. Its Overall Rating runs from 1 to 5 stars, combining health inspections, staffing, and quality measures, with inspections weighted most heavily.
Calculator: See prices in your area
Alden Court Nursing Care accepts Medicare, Medicaid, and private pay.

Overview of Alden Court Nursing Care

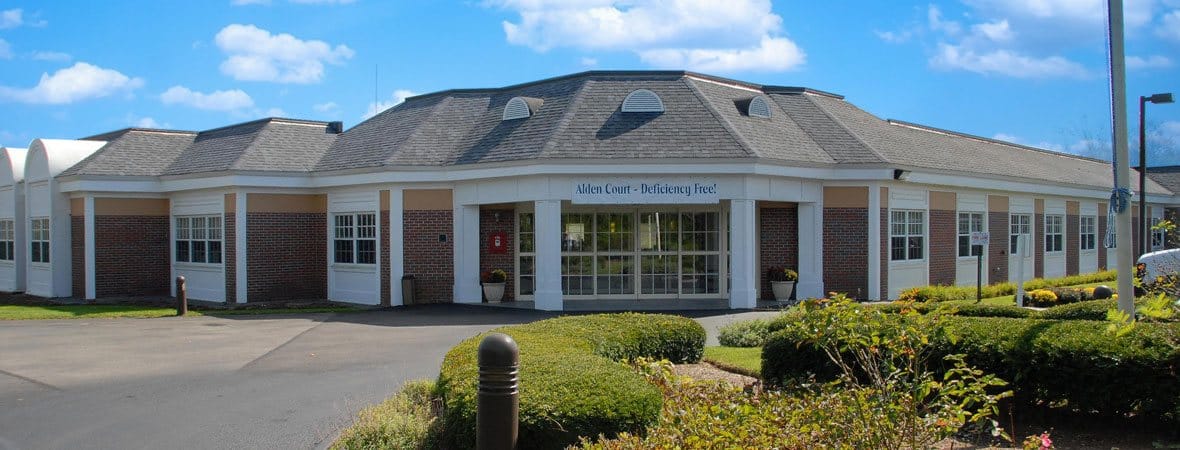
Alden Court Nursing Care & Rehabilitation Center is a nursing home in Fairhaven, MA, offering long-term care and rehabilitation. The community also ensures older adults are treated well in a compassionate and home-like setting. With 24-hour care, concierge services, and therapeutic activities, residents can maintain their independence with ease. Dedicated to residents’ holistic wellness, the community provides the best possible care tailored to their needs and habits.

Art programs, special events, and various games encourage residents to live actively and gain meaningful experiences. A media room, a library, and a practice kitchen are among the top-notch amenities that aim to help residents return to their routines with ease and rest comfortably. Nestled in the tree-lined neighborhood of Fairhaven, residents are guaranteed a stress-free retirement. This nursing home is a good option for senior living in Massachusetts, especially with its commitment to older adults’ welfare.

Quality ratings

Measured by Centers for Medicare & Medicaid Services (CMS)

Overall rating Info The Overall CMS Rating combines results from health inspections, staffing levels and quality measures. Health inspections carry the most weight. Staffing and quality scores can increase or decrease the final rating based on performance compared to state and national standards.
▲ 38.0% Above MA avg. ▲ 38.0% Above MA avg.MA average: 2.9Click the badge to see the full State ranking.Click here to see the full State ranking.
Health Inspection Info Based on the results of the facility's three most recent standard inspections and any complaint investigations. CMS reviews the number, scope, and severity of deficiencies, with more recent findings weighted more heavily.
▲ 40.5% Above MA avg. ▲ 40.5% Above MA avg.MA average: 2.8Click the badge to see the full State ranking.Click here to see the full State ranking.
Staffing Info Measures average nursing staff hours per resident per day, including Registered Nurses (RNs) and total nursing staff. Ratings are adjusted based on the level of care residents require and are compared to state and national benchmarks.
At MA avg. At MA avg.MA average: 3.0Click the badge to see the full State ranking.Click here to see the full State ranking.
Quality Measures Info Based on clinical and physical health indicators reported to CMS, such as hospital readmissions, falls, pressure ulcers, and improvements in mobility. These measures reflect how well residents' health needs are being managed.
▼ 5.6% Below MA avg. ▼ 5.6% Below MA avg.MA average: 3.2Click the badge to see the full State ranking.Click here to see the full State ranking.

Staffing hours breakdown

Info Daily nursing hours per resident by staff type, reported to CMS. Higher is generally better — compare this facility to state and national averages to see where staffing stands.

Hours per resident per day — compared to Massachusetts state averages

Total nursing care / resident Info This home is ranked 38th out of 93 homes in Massachusetts for nurse hours. Total adjusted nursing hours per resident per day, combining RN, LPN, and aide time. CMS adjusts this for case-mix so facilities can be fairly compared.
3h 57m per day
Rank #38 / 93Nurse hours — State benchmarkedThis home is ranked 38th out of 93 homes in Massachusetts. Shows adjusted nurse hours per resident per day benchmarked to the Massachusetts average, with a ranking across 93 Massachusetts facilities. More hours mean more direct care. The national average is about 3.5 hrs; below 3.0 is a red flag.Rankings are based only on facilities in Massachusetts that report data for that category. Facilities without available data are excluded from the ranking.Click the rank badge to see the full State ranking.Click here to see the full State ranking.
This facility Massachusetts avg (3h 56m per day)
vs Massachusetts avg
+1%

3 of 6 metrics below state avg

Standout metric Nurse Aide is +21% above state avg
Staff typeHours / Day / Residentvs state avg
Registered Nurse (RN) Info RNs hold the highest nursing license and can assess residents, interpret test results, and direct care plans. More RN hours per day often signals stronger clinical oversight and faster response to health changes. 32m per day ▼ 17% State avg: 39m per day · National avg: 41m per day
LPN / LVN Info Licensed Practical Nurses (LPNs) or Licensed Vocational Nurses (LVNs) deliver routine hands-on care — medication administration, wound dressing, and monitoring vital signs. They work under RN supervision and make up a large share of daily bedside care. 1h 5m per day ▲ 13% State avg: 57m per day · National avg: 52m per day
Nurse Aide Info Certified Nurse Aides (CNAs) provide the most direct day-to-day assistance: bathing, dressing, feeding, and mobility. Nurse aide hours are typically the largest staffing category and directly affect residents' quality of life. 2h 44m per day ▲ 21% State avg: 2h 16m per day · National avg: 2h 20m per day
Weekend Total Nursing Info Combined nursing hours (RN + LPN + Nurse Aide) per resident per day on weekends. Staffing often drops on weekends — this figure reveals whether the facility maintains adequate coverage outside of weekday hours. 3h 51m per day ▲ 11% State avg: 3h 29m per day · National avg: 3h 27m per day
Physical Therapist Info Hours per resident per day provided by licensed Physical Therapists (PTs) or PT Assistants. PT services help residents recover mobility after injury or illness and are especially important for post-acute (short-stay) rehabilitation. 3m per day ▼ 25% State avg: 5m per day · National avg: 4m per day
Weekend RN Info Registered nurse hours specifically on weekends. Facilities sometimes reduce RN presence on Saturdays and Sundays — a low weekend RN figure compared to weekday hours can indicate reduced clinical oversight when most administrative staff are absent. 17m per day ▼ 37% State avg: 27m per day · National avg: 29m per day

Capacity and availability

This home usually has limited availability

Higher occupancy than the Massachusetts average: 82%
Occupancy rate
92.5% Rank #21 / 96Occupancy rate — State benchmarkedThis home is ranked 21st out of 96 homes in Massachusetts. Shows this facility's occupancy rate versus the Massachusetts average, with its Statewide rank out of 96. Higher occupancy signals strong local demand and financial stability.Rankings are based only on facilities in Massachusetts that report data for that category. Facilities without available data are excluded from the ranking.Click the rank badge to see the full State ranking.Click here to see the full State ranking.
Avg. Length of Stay
127 days
Bed community size
142-bed community Rank #34 / 280Bed count — State benchmarkedThis home is ranked 34th out of 280 homes in Massachusetts. Shows this facility's certified or reported bed count compared to other Massachusetts facilities. Larger communities may offer more amenities, programs, and on-site services for residents and families.Rankings are based only on facilities in Massachusetts that report data for that category. Facilities without available data are excluded from the ranking.Click the rank badge to see the full State ranking.Click here to see the full State ranking.
A larger shared setting that may offer more common spaces and organized community services.
Walk Score
Walk Score: 28 / 100 Rank #366 / 499Walk Score — State benchmarkedThis home is ranked 366th out of 499 homes in Massachusetts. Shows how walkable this facility's neighborhood is compared to the average Walk Score across Massachusetts facilities. Higher scores benefit residents, families, and staff.Rankings are based only on facilities in Massachusetts that report data for that category. Facilities without available data are excluded from the ranking.Click the rank badge to see the full State ranking.Click here to see the full State ranking.
Somewhat walkable. A few nearby services may be reachable on foot, but most trips require transportation.

Therapy & Rehabilitation

2 services
Rehabilitation Services
Short-Term Rehab

Amenities & Lifestyle

Specific ProgramsShort-Term Rehabilitation services

Contact Alden Court Nursing Care

Staffing Data

Reporting period: October 1 – December 31, 2025 (Q4 2025). Source: CMS Payroll-Based Journal report.

Total staff 270
Employees 175
Contractors 95
Staff to resident ratio 2.01 : 1
22% more staff per resident than Massachusetts average
Massachusetts average ratio: 1.66 : 1 Massachusetts average ratio: 1.66 : 1See full Massachusetts ranking
Avg staff/day 90
Average shift 7.6 hours
0% compared with Massachusetts average
Massachusetts average: 7.9 hours Massachusetts average shift: 7.9 hoursSee full Massachusetts ranking
Total staff hours (quarter) 62,854

Nursing staff breakdown

Q4 2025 · Oct 1 – Dec 31 More info This data comes from the CMS Payroll-Based Journal report covering October 1 – December 31, 2025.
Registered Nurse

Manages medical care and health needs.

RN Staff Info 10 total: 9 full-time employees and 1 contractor. 10
Average shift length Info Average shift length. Calculated as total hours divided by days worked and average staff per day. 8.6 hours
Licensed Practical Nurse

Assists with medical care and medications.

LPN Staff Info All 29 LPN Staff are full-time employees. No contractors work on this role. 29
Average shift length Info Average shift length. Calculated as total hours divided by days worked and average staff per day. 8.1 hours
Certified Nursing Assistant

Helps with daily care and mobility.

CNA Staff Info 164 total: 102 full-time employees and 62 contractors. 164
Average shift length Info Average shift length. Calculated as total hours divided by days worked and average staff per day. 7.8 hours

Contractor staffing

Q4 2025 · Oct 1 – Dec 31 More info This data comes from the CMS Payroll-Based Journal report covering October 1 – December 31, 2025.

Total hours from contractors

11.3%

7,085 contractor hours this quarter

Certified Nursing Assistant: 62 Physical Therapy Aide: 8 Physical Therapy Assistant: 6 Speech Language Pathologist: 6 Respiratory Therapy Technician: 5 Qualified Social Worker: 4 Registered Nurse: 1 Medical Director: 1 Other Physician: 1 Occupational Therapy Assistant: 1

Staff by category

Q4 2025 · Oct 1 – Dec 31 More info This data comes from the CMS Payroll-Based Journal report covering October 1 – December 31, 2025.
Certified Nursing Assistant1026216432,70892100%7.8
Licensed Practical Nurse2902911,57092100%8.1
Clinical Nurse Specialist100103,4857683%8.5
Registered Nurse91102,6849199%8.6
Other Dietary Services Staff100101,8598592%5.3
RN Director of Nursing5051,7477076%8.3
Speech Language Pathologist0661,5978491%6.5
Physical Therapy Aide0881,5308188%6.7
Mental Health Service Worker3031,1456267%7.3
Physical Therapy Assistant0661,1127683%6.7
Nurse Aide in Training4049206975%7.4
Respiratory Therapy Technician0557008491%6.2
Administrator1014565762%8
Nurse Practitioner1014565762%8
Dietitian1013684650%8
Qualified Social Worker0443486368%4.8
Medical Director011804043%2
Other Physician011551617%3.4
Occupational Therapy Assistant0113344%8.3
164 Certified Nursing Assistant
% of Days 100%
29 Licensed Practical Nurse
% of Days 100%
10 Clinical Nurse Specialist
% of Days 83%
10 Registered Nurse
% of Days 99%
10 Other Dietary Services Staff
% of Days 92%
5 RN Director of Nursing
% of Days 76%
6 Speech Language Pathologist
% of Days 91%
8 Physical Therapy Aide
% of Days 88%
3 Mental Health Service Worker
% of Days 67%
6 Physical Therapy Assistant
% of Days 83%
4 Nurse Aide in Training
% of Days 75%
5 Respiratory Therapy Technician
% of Days 91%
1 Administrator
% of Days 62%
1 Nurse Practitioner
% of Days 62%
1 Dietitian
% of Days 50%
4 Qualified Social Worker
% of Days 68%
1 Medical Director
% of Days 43%
1 Other Physician
% of Days 17%
1 Occupational Therapy Assistant
% of Days 4%

Penalties and fines

Federal penalties imposed by CMS for regulatory violations, including civil money penalties (fines) and denials of payment for new Medicare/Medicaid admissions.

Source: CMS Penalties Database (Data as of Jan 2026)

Total fines amount $12K Rank #1 / 94Federal fines — State benchmarkedThis home is ranked 1st out of 94 homes in Massachusetts. Shows this facility's cumulative CMS federal fine dollars versus the Massachusetts average among facilities with fines, and where it ranks among 94 facilities in the pool. Lower total dollars mean a better rank.Rankings are based only on facilities in Massachusetts that report data for that category. Facilities without available data are excluded from the ranking.Click the rank badge to see the full State ranking.Click here to see the full State ranking.
83% lower than Massachusetts average

Massachusetts average: $72K

Number of fines 1
42% fewer fines than Massachusetts average

Massachusetts average: 1.7

Payment Denials Info Serious action where Medicare and/or Medicaid temporarily stops payments for new residents until issues are fixed. 0
100% fewer payment denials than Massachusetts average

Massachusetts average: 0.1

Fines amount comparison
This facility $12K
Massachusetts average $72K

No penalties in the past 3 years

No civil money penalties or payment denials were reported in the last 3 years.

Quality of care over time

These measures show how residents usually do over time at this home, based on health outcomes and preventive care.

High-risk clinical events score Info A composite score based on pressure ulcers, falls with injury, weight loss, walking ability decline, and activities of daily living decline. 13.3
30% worse than Massachusetts average

Massachusetts average: 10.2

Functional decline score Info A composite score based on activities of daily living decline, walking ability decline, and incontinence. 28.3
42% worse than Massachusetts average

Massachusetts average: 20.0

Long-stay resident measures
Need for Help with Daily Activities Increased Info Percent of long-stay residents whose need for help with daily activities has increased 25.0%
34% worse than Massachusetts average

Massachusetts average: 18.7%

Walking Ability Worsened Info Percent of long-stay residents whose ability to move independently worsened 25.2%
30% worse than Massachusetts average

Massachusetts average: 19.3%

Low Risk Residents with Bowel/Bladder Incontinence Info Percent of low risk long-stay residents who lose control of their bowels or bladder 34.8%
58% worse than Massachusetts average

Massachusetts average: 22.1%

Falls with Major Injury Info Percent of long-stay residents experiencing one or more falls with major injury 6.1%
69% worse than Massachusetts average

Massachusetts average: 3.6%

High Risk Residents with Pressure Ulcers Info Percent of long-stay high risk residents with pressure ulcers 3.6%
22% better than Massachusetts average

Massachusetts average: 4.7%

Urinary Tract Infection Info Percent of long-stay residents with a urinary tract infection 4.8%
130% worse than Massachusetts average

Massachusetts average: 2.1%

Lost Too Much Weight Info Percent of long-stay residents who lose too much weight 6.4%
23% worse than Massachusetts average

Massachusetts average: 5.2%

Depressive Symptoms Info Percent of long-stay residents who have depressive symptoms 1.7%
84% better than Massachusetts average

Massachusetts average: 10.7%

Antipsychotic Use Info Percent of long-stay residents who received an antipsychotic medication 16.1%
21% better than Massachusetts average

Massachusetts average: 20.3%

Pneumococcal Vaccine Info Percent of long-stay residents assessed and appropriately given the pneumococcal vaccine 79.1%
14% worse than Massachusetts average

Massachusetts average: 91.9%

Influenza Vaccine Info Percent of long-stay residents assessed and appropriately given the seasonal influenza vaccine 98.2%
In line with Massachusetts average

Massachusetts average: 94.8%

Short-stay resident measures
Pneumococcal Vaccine Info Percent of short-stay residents assessed and appropriately given the pneumococcal vaccine 79.6%
In line with Massachusetts average

Massachusetts average: 76.7%

Antipsychotic medication increase Info Percent of short-stay residents who newly received an antipsychotic medication 1.8%
35% worse than Massachusetts average

Massachusetts average: 1.3%

Influenza Vaccine Info Percent of short-stay residents assessed and appropriately given the seasonal influenza vaccine 60.3%
22% worse than Massachusetts average

Massachusetts average: 77.7%

Breakdown by payment type

Medicare

98% of new residents, usually for short-term rehab.

Typical stay 1 months

Private pay

2% of new residents, often for short stays.

Typical stay 2 years

Medicaid

1% of new residents, often for long-term daily care.

Typical stay 21 years

Facility Characteristics

Source: CMS Long-Term Care Facility Characteristics (Data as of Jan 2026)

Total residents 134
Medicare
38
28.4% of residents
Medicaid
79
59% of residents
Private pay or other
17
12.7% of residents
Programs & Services
Residents Group

Residents meet regularly to discuss policies, care quality, and activities

Active Resident Council

Organized group of residents that meets regularly to discuss facility policies, quality of life, and activities.

Finances and operations

Based on CMS SNF Cost Report for fiscal year ending in 12/2023.

Nonprofit
Nonprofit Corporation
Net patient revenue Info Net patient revenue — what the home actually collects for resident care, after contractual allowances, bad debt and discounts are subtracted from its gross charges (CMS cost report, Worksheet G-3). It covers resident care only; money the home earns from other sources is shown separately as "Other income."
$20.0M
Net patient income Info Net patient income: net patient revenue minus the home's total operating expenses. A positive figure means it earns more from resident care than it spends to deliver it; a negative figure means the opposite. It excludes non-operating "other income."
$351.5K
Nonprofit Nonprofit Corporation
Net patient revenue Info Net patient revenue — what the home actually collects for resident care, after contractual allowances, bad debt and discounts are subtracted from its gross charges (CMS cost report, Worksheet G-3). It covers resident care only; money the home earns from other sources is shown separately as "Other income."
$20.0M Rank #34 / 96Revenue — State benchmarkedThis home is ranked 34th out of 96 homes in Massachusetts. Shows this facility's annual revenue compared to the Massachusetts average. Higher revenue generally means more resources for staffing and capital — read alongside Payroll %.Rankings are based only on facilities in Massachusetts that report data for that category. Facilities without available data are excluded from the ranking.Click the rank badge to see the full State ranking.Click here to see the full State ranking.
Net patient income Info Net patient income: net patient revenue minus the home's total operating expenses. A positive figure means it earns more from resident care than it spends to deliver it; a negative figure means the opposite. It excludes non-operating "other income."
$351.5K
Other income Info Money the home earns outside of resident care — such as investments, grants, rentals and other non-operating sources (CMS cost report, Worksheet G-3). It is tracked separately from net patient revenue: it is not part of that figure, and it is not included in net patient income.
$291.9K
Payroll costs Info Staff salaries plus wage-related costs — benefits such as payroll taxes, health insurance and retirement — from the home's own accounting records (CMS cost report, Worksheet A). Contract or agency labor is counted separately, under other operating costs. Rank #34 / 96Payroll — State benchmarkedThis home is ranked 34th out of 96 homes in Massachusetts. Shows total annual staff payroll benchmarked to the Massachusetts average. Higher payroll investment relative to peers often signals better staffing and less reliance on cheaper contract labor.Rankings are based only on facilities in Massachusetts that report data for that category. Facilities without available data are excluded from the ranking.Click the rank badge to see the full State ranking.Click here to see the full State ranking.
$9.8M 48.8% of net patient revenue Info Payroll as a share of revenue: staff salaries and wage-related benefits divided by net patient revenue. A higher figure means more of each revenue dollar goes to staff pay. Rank #51 / 96Payroll % — State benchmarkedThis home is ranked 51st out of 96 homes in Massachusetts. Shows payroll as a percentage of revenue versus the Massachusetts average. Well-run Massachusetts facilities typically land around 54–65% — the top third Statewide. Below 25% may signal understaffing or heavy agency use — read with Staffing ratings.Rankings are based only on facilities in Massachusetts that report data for that category. Facilities without available data are excluded from the ranking.Click the rank badge to see the full State ranking.Click here to see the full State ranking.
Other operating costs Info Everything it costs to run the home apart from payroll — food, utilities, supplies, maintenance, contract labor and administration. Calculated as total operating expense minus payroll (staff salaries and wage-related benefits).
$9.9M
Total costs Info The home's total operating expense for the year — all the costs of running it, salaries included (CMS cost report, Worksheet G-3).
$19.7M

What does this home offer?

Building type icon
Building type icon

Building Type: Single-story

On-site medical care and health services icon

On-site Medical Care and Health Services

Rehabilitative support icon

Rehabilitative Support

Beauty services icon

Beauty Services

Social and recreational activities icon

Social and Recreational Activities

Who this home usually serves

TYPE OF STAY

Mostly short-term rehab stays

Most residents typically stay for a few weeks or months before returning home or moving on.

Most new residents arrive under Medicare (98% of admissions), and a typical Medicare stay runs around 1 months.

Admissions
394 total

Coverage residents most often arrive under.

Medicare 98%
Private pay 2%
Medicaid 1%
Discharges
378 total

Coverage residents most often leave under.

Medicare 90%
Private pay 7%
Medicaid 3%

Places of interest near Alden Court Nursing Care

Address 2.2 miles from city center Info Estimated distance in miles from Fairhaven's city center to Alden Court Nursing Care's address, calculated via Google Maps.

Calculate Travel Distance to Alden Court Nursing Care

Add your location

Address

Compare Nursing Homes around Fairhaven

The information below is reported by the Massachusetts Executive Office of Elder Affairs and Department of Public Health.

3 facilities compared · CMS & MA Dept. of Health data

Our Lady’s Haven Skilled Nursing & Rehabilitative Care
NH
HC
MC
NC
PC
RC
Fairhaven
117
Facility 117
MA AVG 94
Rank #68 / 280
64.8%
Facility 64.8%
MA AVG 82%
Rank #79 / 96
-21%
4.07
Facility 4.07
MA AVG 3.93
Rank #31 / 93
+7%+3%
$0
Facility $0
MA AVG $76.6k
Rank #1 / 94
35
Facility 35
MA AVG 32.7
Rank #64 / 93
8.8
Facility 8.8
MA AVG 7.2
Rank #71 / 93
-76-
67
Facility 67
MA AVG 53
Rank #185 / 499
Diana Henry
$9.1M
Facility $9.1M
MA AVG $17.4M
Rank #71 / 96
$5.5M
Facility $5.5M
MA AVG $6.5M
Rank #75 / 96
60.6%
Facility 60.6%
MA AVG 43.6%
Rank #39 / 96
225485
Alden Court Nursing Care
NH
HC
NC
PC
Fairhaven
142
Facility 142
MA AVG 94
Rank #34 / 280
92.5%
Facility 92.5%
MA AVG 82%
Rank #21 / 96
+13%
3.95
Facility 3.95
MA AVG 3.93
Rank #38 / 93
-71%+1%
$0
Facility $0
MA AVG $76.6k
Rank #1 / 94
12
Facility 12
MA AVG 32.7
Rank #13 / 93
3.0
Facility 3.0
MA AVG 7.2
Rank #7 / 93
1133-
28
Facility 28
MA AVG 53
Rank #366 / 499
Peter Gordon
$20.0M
Facility $20.0M
MA AVG $17.4M
Rank #34 / 96
$9.8M
Facility $9.8M
MA AVG $6.5M
Rank #34 / 96
48.8%
Facility 48.8%
MA AVG 43.6%
Rank #51 / 96
225387
Royal of Fairhaven Nursing Center
NH
HC
MC
Fairhaven
107
Facility 107
MA AVG 94
Rank #86 / 280
82.1%
Facility 82.1%
MA AVG 82%
Rank #55 / 96
0%
3.43
Facility 3.43
MA AVG 3.93
Rank #80 / 93
+4%-13%
$8.6k
Facility $8.6k
MA AVG $76.6k
Rank #56 / 94
17
Facility 17
MA AVG 32.7
Rank #27 / 93
4.3
Facility 4.3
MA AVG 7.2
Rank #23 / 93
272-
54
Facility 54
MA AVG 53
Rank #238 / 499
Kristie Celorier
$9.4M
Facility $9.4M
MA AVG $17.4M
Rank #86 / 96
$4.5M
Facility $4.5M
MA AVG $6.5M
Rank #89 / 96
47.9%
Facility 47.9%
MA AVG 43.6%
Rank #52 / 96
225117

Financial Assistance for
Nursing Home in Massachusetts

Alden Court Nursing Care is located in Fairhaven, Massachusetts.
Here are the financial assistance programs available to residents in Massachusetts.

Get Financial aid guidance

Home Care Program

MassHealth Home Care

Age 60+
General Massachusetts resident, at risk of nursing home placement.
Income Limits (2025) ~$1,500/month individual, varies by region
Asset Limits $2,000 individual, excludes home, car
MA

Coordinated through Aging Services Access Points (ASAPs); high demand in urban areas.

Benefits
In-home care (3-5 hours/day) Homemaker services Respite care (up to 14 days/year) Adult day care (~$75/day)

Frail Elder Waiver

Massachusetts Medicaid FE Waiver

Age 65+
General Massachusetts resident, Medicaid-eligible, nursing home-level care need.
Income Limits (2025) ~$2,829/month 300% FBR, individual
Asset Limits $2,000 (individual), $3,000 (couple).
MA

Requires clinical eligibility determination.

Benefits
Personal care (5-7 hours/day) Respite care (240 hours/year) Adult day care (~$75/day) Home health services

Senior Care Options (SCO)

Massachusetts Senior Care Options

Age 65+
General Massachusetts resident, eligible for MassHealth (Medicare optional), nursing home-level care need.
Income Limits (2025) ~$2,829/month (300% FBR, individual); QIT allowed.
Asset Limits $2,000 (individual), $3,000 (couple) (excludes home up to $713,000, car).
MA

Not available in Dukes/Nantucket Counties; multiple SCO providers (e.g., CCA, Tufts).

Benefits
Personal care (5-7 hours/day) Medical care Respite (240 hours/year) Adult

Medicare Savings Program (MSP)

Massachusetts Medicare Savings Program (MassHealth Buy-In)

Age 65+ or disabled
General Massachusetts resident, Medicare Part A/B.
Income Limits (2025) ~$2,510/month (QMB), ~$3,380/month (SLMB), ~$3,598/month (QI)—individual.
Asset Limits $9,430 (individual), $14,130 (couple).
MA

Three tiers; no waitlist; includes Extra Help for Part D.

Benefits
Covers Part B premiums ($174.70/month) Deductibles ($240/year) Copays (~20%)

National Family Caregiver Support Program (NFCSP) Respite

Massachusetts NFCSP Respite Care

Age
General Caregivers of 60+ needing care or 55+ caregivers of others; Massachusetts resident; functional needs (2+ ADLs).
Income Limits (2025) Prioritizes ~$24,980/year (individual); no strict cap.
Asset Limits Not assessed; need-based.
MA

27 ASAPs; prioritizes low-income, rural caregivers.

Benefits
Respite (4-6 hours/week or 5 days/year) Adult day care ($60/day) Caregiver training Supplies (~$500/year)

Prescription Advantage

Massachusetts Prescription Advantage

Age 65+ or disabled
General Massachusetts resident, enrolled in Medicare Part D (or ineligible for Medicare).
Income Limits (2025) No strict limit; copays vary by income ~$24,980-$75,000/year individual
Asset Limits Not assessed.
MA

Supplements Medicare Part D; no enrollment fee for low-income.

Benefits
Covers prescription copays ($5-$40/drug) Fills coverage gaps Catastrophic cost protection ($4,000+ covered)

VA Aid and Attendance (A&A) and Housebound Benefits

Massachusetts VA Aid and Attendance/Housebound

Age 65+ or disabled veteran/spouse
General Massachusetts resident, wartime service, need for ADL help (A&A) or homebound.
Income Limits (2025) Net income < ~$1,984/month (veteran with dependent, A&A); pension offsets income.
Asset Limits ~$155,356 net worth limit
MA

High veteran demand statewide.

Benefits
Cash (~$1,433-$2,642/month veteran, ~$951-$1,318 spouse) for care costs (e.g., in-home, assisted living)

Frequently Asked Questions about Alden Court Nursing Care

Is Alden Court Nursing Care in a walkable area?

Alden Court Nursing Care has a walk score of 28. Somewhat walkable. A few nearby services may be reachable on foot, but most trips require transportation.

What is the occupancy rate at Alden Court Nursing Care?

Alden Court Nursing Care's occupancy is 92.5%.

What is the best email address for Alden Court Nursing Care?

The team at Alden Court Nursing Care can be reached at info@aldencourtnursing.com.

Does Alden Court Nursing Care operate as a for-profit or non-profit?

Alden Court Nursing Care is registered as a non-profit.

Are there photos of Alden Court Nursing Care?

Yes — there are 7 photos of Alden Court Nursing Care in the photo gallery on this page.

What is the address of Alden Court Nursing Care?

Alden Court Nursing Care is located at 389 Alden Rd, Fairhaven, MA 02719.

What is the phone number of Alden Court Nursing Care?

(508) 991-8600 will put you in contact with the team at Alden Court Nursing Care.

Guides for Better Senior Living

Care Cost Calculator: See Prices in Your Area

Nursing Home Data Explorer

Don’t Wait Too Long: 7 Red Flag Signs Your Parent Needs Assisted Living Now

The True Cost of Assisted Living in 2025 – And How Families Are Paying For It

Understanding Senior Living Costs: Pricing Models, Discounts & Financial Assistance