Our Lady’s Haven Skilled Nursing & Rehabilitative Care
Nursing Home, Hospice Care, Memory Care, Nursing Care, Palliative Care & Respite Care · Fairhaven, MA
CMS overall rating Info CMS (the Centers for Medicare & Medicaid Services) is the federal agency that rates nursing home quality. Its Overall Rating runs from 1 to 5 stars, combining health inspections, staffing, and quality measures, with inspections weighted most heavily.

Our Lady’s Haven Skilled Nursing & Rehabilitative Care

Nursing Home, Hospice Care, Memory Care, Nursing Care, Palliative Care & Respite Care · Fairhaven, MA
CMS overall rating Info CMS (the Centers for Medicare & Medicaid Services) is the federal agency that rates nursing home quality. Its Overall Rating runs from 1 to 5 stars, combining health inspections, staffing, and quality measures, with inspections weighted most heavily.
Calculator: See prices in your area
Our Lady’s Haven Skilled Nursing & Rehabilitative Care accepts Medicare, Medicaid, and private pay.

Overview of Our Lady’s Haven Skilled Nursing & Rehabilitative Care

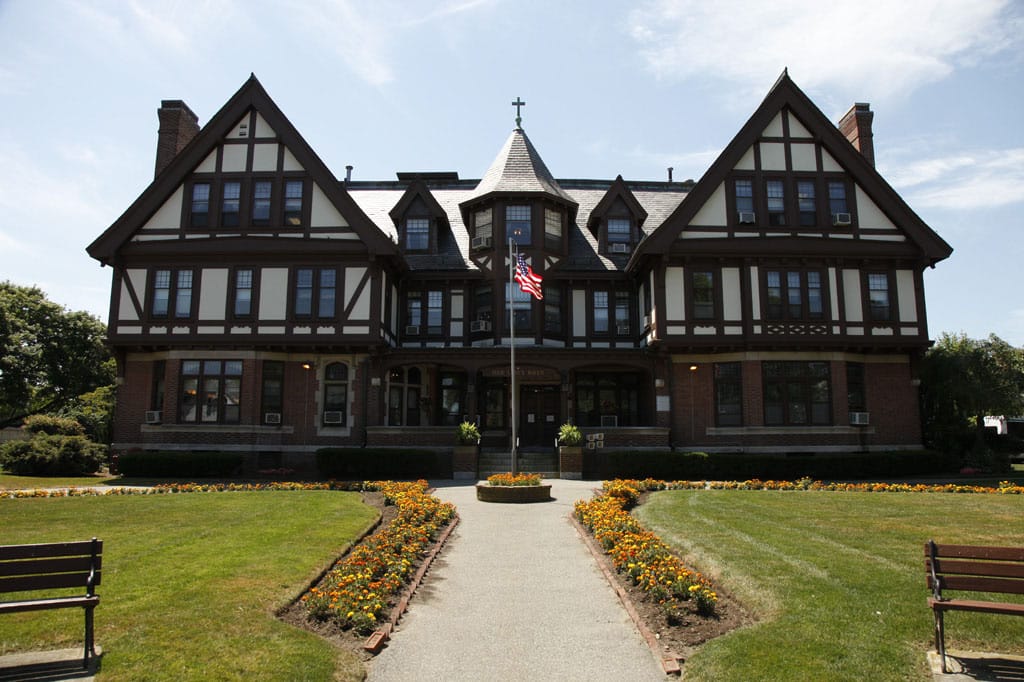
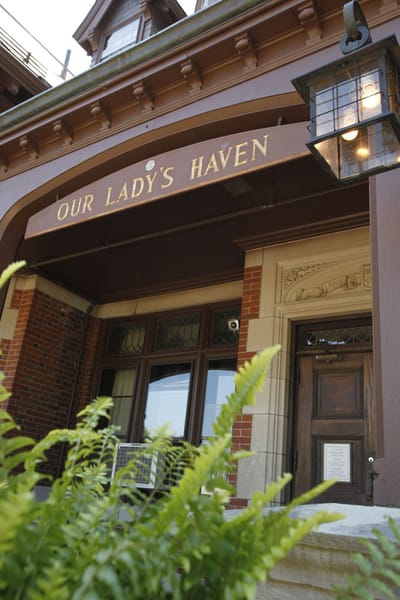
Our Lady’s Haven Skilled Nursing & Rehabilitation in Fairhaven, MA, is a nursing home that offers palliative care, rehabilitation, and skilled nursing. Promoting a nurturing and welcoming environment, the community ensures older adults’ comfort and safety. Residents can also focus on their recovery with exceptional services, including round-the-clock nursing care, well-balanced meals, and pain management. Through personalized care plans, the community goes above and beyond to improve residents’ quality of life.

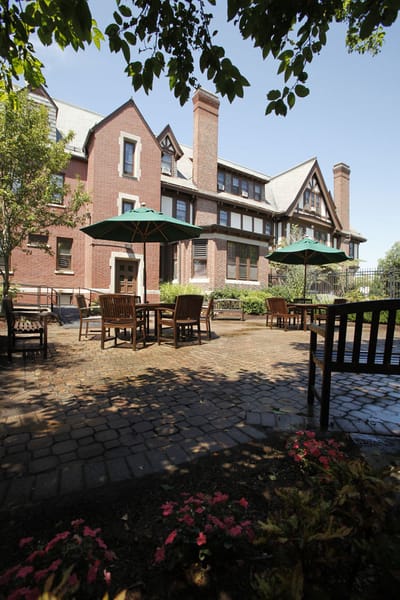
Celebrations, light exercises, and various games provide residents with more opportunities to try new hobbies and have fun. Residents can also freely interact with their surroundings and rest in the lively dining room and spacious common areas. The Acushnet River, restaurants, and shops are also located nearby, ensuring a laid-back lifestyle. This nursing home has high standards of care dedicated to older adults’ welfare, making it a good option for senior living in Massachusetts.

Quality ratings

Measured by Centers for Medicare & Medicaid Services (CMS)

Overall rating Info The Overall CMS Rating combines results from health inspections, staffing levels and quality measures. Health inspections carry the most weight. Staffing and quality scores can increase or decrease the final rating based on performance compared to state and national standards.
▲ 72.4% Above MA avg. ▲ 72.4% Above MA avg.MA average: 2.9Click the badge to see the full State ranking.Click here to see the full State ranking.
Health Inspection Info Based on the results of the facility's three most recent standard inspections and any complaint investigations. CMS reviews the number, scope, and severity of deficiencies, with more recent findings weighted more heavily.
▲ 40.5% Above MA avg. ▲ 40.5% Above MA avg.MA average: 2.8Click the badge to see the full State ranking.Click here to see the full State ranking.
Staffing Info Measures average nursing staff hours per resident per day, including Registered Nurses (RNs) and total nursing staff. Ratings are adjusted based on the level of care residents require and are compared to state and national benchmarks.
▲ 66.7% Above MA avg. ▲ 66.7% Above MA avg.MA average: 3.0Click the badge to see the full State ranking.Click here to see the full State ranking.
Quality Measures Info Based on clinical and physical health indicators reported to CMS, such as hospital readmissions, falls, pressure ulcers, and improvements in mobility. These measures reflect how well residents' health needs are being managed.
▼ 5.6% Below MA avg. ▼ 5.6% Below MA avg.MA average: 3.2Click the badge to see the full State ranking.Click here to see the full State ranking.

Staffing hours breakdown

Info Daily nursing hours per resident by staff type, reported to CMS. Higher is generally better — compare this facility to state and national averages to see where staffing stands.

Hours per resident per day — compared to Massachusetts state averages

Total nursing care / resident Info This home is ranked 31st out of 93 homes in Massachusetts for nurse hours. Total adjusted nursing hours per resident per day, combining RN, LPN, and aide time. CMS adjusts this for case-mix so facilities can be fairly compared.
4h 4m per day
Rank #31 / 93Nurse hours — State benchmarkedThis home is ranked 31st out of 93 homes in Massachusetts. Shows adjusted nurse hours per resident per day benchmarked to the Massachusetts average, with a ranking across 93 Massachusetts facilities. More hours mean more direct care. The national average is about 3.5 hrs; below 3.0 is a red flag.Rankings are based only on facilities in Massachusetts that report data for that category. Facilities without available data are excluded from the ranking.Click the rank badge to see the full State ranking.Click here to see the full State ranking.
This facility Massachusetts avg (3h 56m per day)
vs Massachusetts avg
+3%

2 of 6 metrics below state avg

Standout metric Weekend RN is +43% above state avg
Staff typeHours / Day / Residentvs state avg
Registered Nurse (RN) Info RNs hold the highest nursing license and can assess residents, interpret test results, and direct care plans. More RN hours per day often signals stronger clinical oversight and faster response to health changes. 48m per day ▲ 22% State avg: 39m per day · National avg: 41m per day
LPN / LVN Info Licensed Practical Nurses (LPNs) or Licensed Vocational Nurses (LVNs) deliver routine hands-on care — medication administration, wound dressing, and monitoring vital signs. They work under RN supervision and make up a large share of daily bedside care. 34m per day ▼ 40% State avg: 57m per day · National avg: 52m per day
Nurse Aide Info Certified Nurse Aides (CNAs) provide the most direct day-to-day assistance: bathing, dressing, feeding, and mobility. Nurse aide hours are typically the largest staffing category and directly affect residents' quality of life. 2h 24m per day ▲ 6% State avg: 2h 16m per day · National avg: 2h 20m per day
Weekend Total Nursing Info Combined nursing hours (RN + LPN + Nurse Aide) per resident per day on weekends. Staffing often drops on weekends — this figure reveals whether the facility maintains adequate coverage outside of weekday hours. 3h 29m per day ■ Avg State avg: 3h 29m per day · National avg: 3h 27m per day
Physical Therapist Info Hours per resident per day provided by licensed Physical Therapists (PTs) or PT Assistants. PT services help residents recover mobility after injury or illness and are especially important for post-acute (short-stay) rehabilitation. 1m per day ▼ 79% State avg: 5m per day · National avg: 4m per day
Weekend RN Info Registered nurse hours specifically on weekends. Facilities sometimes reduce RN presence on Saturdays and Sundays — a low weekend RN figure compared to weekday hours can indicate reduced clinical oversight when most administrative staff are absent. 39m per day ▲ 43% State avg: 27m per day · National avg: 29m per day

Capacity and availability

This home usually has availability

Lower occupancy than the Massachusetts average: 82%
Occupancy rate
64.8% Rank #79 / 96Occupancy rate — State benchmarkedThis home is ranked 79th out of 96 homes in Massachusetts. Shows this facility's occupancy rate versus the Massachusetts average, with its Statewide rank out of 96. Higher occupancy signals strong local demand and financial stability.Rankings are based only on facilities in Massachusetts that report data for that category. Facilities without available data are excluded from the ranking.Click the rank badge to see the full State ranking.Click here to see the full State ranking.
Avg. Length of Stay
152 days
Bed community size
117-bed community Rank #68 / 280Bed count — State benchmarkedThis home is ranked 68th out of 280 homes in Massachusetts. Shows this facility's certified or reported bed count compared to other Massachusetts facilities. Larger communities may offer more amenities, programs, and on-site services for residents and families.Rankings are based only on facilities in Massachusetts that report data for that category. Facilities without available data are excluded from the ranking.Click the rank badge to see the full State ranking.Click here to see the full State ranking.
A larger shared setting that may offer more common spaces and organized community services.
Walk Score
Walk Score: 67 / 100 Rank #185 / 499Walk Score — State benchmarkedThis home is ranked 185th out of 499 homes in Massachusetts. Shows how walkable this facility's neighborhood is compared to the average Walk Score across Massachusetts facilities. Higher scores benefit residents, families, and staff.Rankings are based only on facilities in Massachusetts that report data for that category. Facilities without available data are excluded from the ranking.Click the rank badge to see the full State ranking.Click here to see the full State ranking.
Moderately walkable. Some errands can be accomplished on foot, with a mix of nearby amenities.

Contact Our Lady’s Haven Skilled Nursing & Rehabilitative Care

Staffing Data

Reporting period: October 1 – December 31, 2025 (Q4 2025). Source: CMS Payroll-Based Journal report.

Total staff 198
Employees 84
Contractors 114
Staff to resident ratio 2.64 : 1
59% more staff per resident than Massachusetts average
Massachusetts average ratio: 1.66 : 1 Massachusetts average ratio: 1.66 : 1See full Massachusetts ranking
Avg staff/day 44
Average shift 7.4 hours
6% worse than Massachusetts average
Massachusetts average: 7.9 hours Massachusetts average shift: 7.9 hoursSee full Massachusetts ranking
Total staff hours (quarter) 29,769

Nursing staff breakdown

Q4 2025 · Oct 1 – Dec 31 More info This data comes from the CMS Payroll-Based Journal report covering October 1 – December 31, 2025.
Registered Nurse

Manages medical care and health needs.

RN Staff Info 27 total: 9 full-time employees and 18 contractors. 27
Average shift length Info Average shift length. Calculated as total hours divided by days worked and average staff per day. 6.9 hours
Licensed Practical Nurse

Assists with medical care and medications.

LPN Staff Info 37 total: 6 full-time employees and 31 contractors. 37
Average shift length Info Average shift length. Calculated as total hours divided by days worked and average staff per day. 8.1 hours
Certified Nursing Assistant

Helps with daily care and mobility.

CNA Staff Info 94 total: 47 full-time employees and 47 contractors. 94
Average shift length Info Average shift length. Calculated as total hours divided by days worked and average staff per day. 7.5 hours

Contractor staffing

Q4 2025 · Oct 1 – Dec 31 More info This data comes from the CMS Payroll-Based Journal report covering October 1 – December 31, 2025.

Total hours from contractors

19.3%

5,733 contractor hours this quarter

Certified Nursing Assistant: 47 Licensed Practical Nurse: 31 Registered Nurse: 18 Speech Language Pathologist: 4 Respiratory Therapy Technician: 4 Physical Therapy Aide: 3 Physical Therapy Assistant: 2 Mental Health Service Worker: 1 Qualified Social Worker: 1 Occupational Therapy Aide: 1 Occupational Therapy Assistant: 1 Medical Director: 1

Staff by category

Q4 2025 · Oct 1 – Dec 31 More info This data comes from the CMS Payroll-Based Journal report covering October 1 – December 31, 2025.
Certified Nursing Assistant47479416,80292100%7.5
Licensed Practical Nurse631373,39592100%8.1
Registered Nurse918273,39192100%6.9
Clinical Nurse Specialist100101,7819098%8.1
Dietitian4041,25292100%6.6
RN Director of Nursing2026266470%7.3
Speech Language Pathologist0445046368%6.6
Administrator1014395964%7.4
Physical Therapy Assistant0224145762%7.3
Nurse Practitioner1013905257%7.5
Mental Health Service Worker1123744852%7.2
Occupational Therapy Aide0111242123%5.9
Respiratory Therapy Technician0441153740%3.1
Physical Therapy Aide033641921%3.4
Qualified Activities Professional303402022%1.9
Qualified Social Worker011282224%1.3
Occupational Therapy Assistant0112467%3.9
Medical Director011833%2.7
94 Certified Nursing Assistant
% of Days 100%
37 Licensed Practical Nurse
% of Days 100%
27 Registered Nurse
% of Days 100%
10 Clinical Nurse Specialist
% of Days 98%
4 Dietitian
% of Days 100%
2 RN Director of Nursing
% of Days 70%
4 Speech Language Pathologist
% of Days 68%
1 Administrator
% of Days 64%
2 Physical Therapy Assistant
% of Days 62%
1 Nurse Practitioner
% of Days 57%
2 Mental Health Service Worker
% of Days 52%
1 Occupational Therapy Aide
% of Days 23%
4 Respiratory Therapy Technician
% of Days 40%
3 Physical Therapy Aide
% of Days 21%
3 Qualified Activities Professional
% of Days 22%
1 Qualified Social Worker
% of Days 24%
1 Occupational Therapy Assistant
% of Days 7%
1 Medical Director
% of Days 3%

Penalties and fines

Federal penalties imposed by CMS for regulatory violations, including civil money penalties (fines) and denials of payment for new Medicare/Medicaid admissions.

Source: CMS Penalties Database

No penalties in the past 3 years

No civil money penalties or payment denials were reported in the last 3 years.

Quality of care over time

These measures show how residents usually do over time at this home, based on health outcomes and preventive care.

High-risk clinical events score Info A composite score based on pressure ulcers, falls with injury, weight loss, walking ability decline, and activities of daily living decline. 8.7
15% better than Massachusetts average

Massachusetts average: 10.2

Functional decline score Info A composite score based on activities of daily living decline, walking ability decline, and incontinence. 18.1
9% better than Massachusetts average

Massachusetts average: 20.0

Long-stay resident measures
Need for Help with Daily Activities Increased Info Percent of long-stay residents whose need for help with daily activities has increased 17.8%
5% better than Massachusetts average

Massachusetts average: 18.7%

Walking Ability Worsened Info Percent of long-stay residents whose ability to move independently worsened 15.6%
20% better than Massachusetts average

Massachusetts average: 19.3%

Low Risk Residents with Bowel/Bladder Incontinence Info Percent of low risk long-stay residents who lose control of their bowels or bladder 21.0%
5% better than Massachusetts average

Massachusetts average: 22.1%

Falls with Major Injury Info Percent of long-stay residents experiencing one or more falls with major injury 2.5%
29% better than Massachusetts average

Massachusetts average: 3.6%

High Risk Residents with Pressure Ulcers Info Percent of long-stay high risk residents with pressure ulcers 2.1%
54% better than Massachusetts average

Massachusetts average: 4.7%

Urinary Tract Infection Info Percent of long-stay residents with a urinary tract infection 2.6%
27% worse than Massachusetts average

Massachusetts average: 2.1%

Lost Too Much Weight Info Percent of long-stay residents who lose too much weight 5.4%
5% worse than Massachusetts average

Massachusetts average: 5.2%

Depressive Symptoms Info Percent of long-stay residents who have depressive symptoms 0.0%
100% better than Massachusetts average

Massachusetts average: 10.7%

Antipsychotic Use Info Percent of long-stay residents who received an antipsychotic medication 23.0%
13% worse than Massachusetts average

Massachusetts average: 20.3%

Pneumococcal Vaccine Info Percent of long-stay residents assessed and appropriately given the pneumococcal vaccine 92.8%
In line with Massachusetts average

Massachusetts average: 91.9%

Influenza Vaccine Info Percent of long-stay residents assessed and appropriately given the seasonal influenza vaccine 94.5%
In line with Massachusetts average

Massachusetts average: 94.8%

Short-stay resident measures
Pneumococcal Vaccine Info Percent of short-stay residents assessed and appropriately given the pneumococcal vaccine 77.9%
In line with Massachusetts average

Massachusetts average: 76.7%

Antipsychotic medication increase Info Percent of short-stay residents who newly received an antipsychotic medication 0.0%
100% better than Massachusetts average

Massachusetts average: 1.3%

Influenza Vaccine Info Percent of short-stay residents assessed and appropriately given the seasonal influenza vaccine 84.2%
8% better than Massachusetts average

Massachusetts average: 77.7%

Breakdown by payment type

Medicare

31% of new residents, usually for short-term rehab.

Typical stay 28 days

Private pay

43% of new residents, often for short stays.

Typical stay 4 - 5 months

Medicaid

26% of new residents, often for long-term daily care.

Typical stay 11 - 12 months

Facility Characteristics

Source: CMS Long-Term Care Facility Characteristics (Data as of Jan 2026)

Total residents 75
Medicare
1
1.3% of residents
Medicaid
42
56% of residents
Private pay or other
32
42.7% of residents
Programs & Services
Residents Group

Residents meet regularly to discuss policies, care quality, and activities

Active Resident Council

Organized group of residents that meets regularly to discuss facility policies, quality of life, and activities.

Finances and operations

Based on CMS SNF Cost Report for fiscal year ending in 12/2023.

Nonprofit
Church Related
Net patient revenue Info Net patient revenue — what the home actually collects for resident care, after contractual allowances, bad debt and discounts are subtracted from its gross charges (CMS cost report, Worksheet G-3). It covers resident care only; money the home earns from other sources is shown separately as "Other income."
$9.1M
Net patient income Info Net patient income: net patient revenue minus the home's total operating expenses. A positive figure means it earns more from resident care than it spends to deliver it; a negative figure means the opposite. It excludes non-operating "other income."
-$431.4K
Nonprofit Church Related
Net patient revenue Info Net patient revenue — what the home actually collects for resident care, after contractual allowances, bad debt and discounts are subtracted from its gross charges (CMS cost report, Worksheet G-3). It covers resident care only; money the home earns from other sources is shown separately as "Other income."
$9.1M Rank #71 / 96Revenue — State benchmarkedThis home is ranked 71st out of 96 homes in Massachusetts. Shows this facility's annual revenue compared to the Massachusetts average. Higher revenue generally means more resources for staffing and capital — read alongside Payroll %.Rankings are based only on facilities in Massachusetts that report data for that category. Facilities without available data are excluded from the ranking.Click the rank badge to see the full State ranking.Click here to see the full State ranking.
Net patient income Info Net patient income: net patient revenue minus the home's total operating expenses. A positive figure means it earns more from resident care than it spends to deliver it; a negative figure means the opposite. It excludes non-operating "other income."
-$431.4K
Other income Info Money the home earns outside of resident care — such as investments, grants, rentals and other non-operating sources (CMS cost report, Worksheet G-3). It is tracked separately from net patient revenue: it is not part of that figure, and it is not included in net patient income.
$149.1K
Payroll costs Info Staff salaries plus wage-related costs — benefits such as payroll taxes, health insurance and retirement — from the home's own accounting records (CMS cost report, Worksheet A). Contract or agency labor is counted separately, under other operating costs. Rank #75 / 96Payroll — State benchmarkedThis home is ranked 75th out of 96 homes in Massachusetts. Shows total annual staff payroll benchmarked to the Massachusetts average. Higher payroll investment relative to peers often signals better staffing and less reliance on cheaper contract labor.Rankings are based only on facilities in Massachusetts that report data for that category. Facilities without available data are excluded from the ranking.Click the rank badge to see the full State ranking.Click here to see the full State ranking.
$5.5M 60.6% of net patient revenue Info Payroll as a share of revenue: staff salaries and wage-related benefits divided by net patient revenue. A higher figure means more of each revenue dollar goes to staff pay. Rank #39 / 96Payroll % — State benchmarkedThis home is ranked 39th out of 96 homes in Massachusetts. Shows payroll as a percentage of revenue versus the Massachusetts average. Well-run Massachusetts facilities typically land around 54–65% — the top third Statewide. Below 25% may signal understaffing or heavy agency use — read with Staffing ratings.Rankings are based only on facilities in Massachusetts that report data for that category. Facilities without available data are excluded from the ranking.Click the rank badge to see the full State ranking.Click here to see the full State ranking.
Other operating costs Info Everything it costs to run the home apart from payroll — food, utilities, supplies, maintenance, contract labor and administration. Calculated as total operating expense minus payroll (staff salaries and wage-related benefits).
$4.0M
Total costs Info The home's total operating expense for the year — all the costs of running it, salaries included (CMS cost report, Worksheet G-3).
$9.5M

What does this home offer?

Building type icon
Building type icon

Building Type: 3-story

On-site medical care and health services icon

On-site Medical Care and Health Services

Rehabilitative support icon

Rehabilitative Support

Who this home usually serves

TYPE OF STAY

Mix of rehab and long-term care

This home supports both short-term rehab and long-term care, with residents staying for a wide range of durations.

New residents most often arrive under private pay (43% of admissions), and a typical private pay stay runs around 4 - 5 months.

Admissions
181 total

Coverage residents most often arrive under.

Medicare 31%
Private pay 43%
Medicaid 26%
Discharges
181 total

Coverage residents most often leave under.

Medicare 9%
Private pay 43%
Medicaid 48%

Places of interest near Our Lady’s Haven Skilled Nursing & Rehabilitative Care

Address 1.2 miles from city center Info Estimated distance in miles from Fairhaven's city center to Our Lady’s Haven Skilled Nursing & Rehabilitative Care's address, calculated via Google Maps.

Calculate Travel Distance to Our Lady’s Haven Skilled Nursing & Rehabilitative Care

Add your location

Address

Compare Nursing Homes around Fairhaven

The information below is reported by the Massachusetts Executive Office of Elder Affairs and Department of Public Health.

3 facilities compared · CMS & MA Dept. of Health data

Our Lady’s Haven Skilled Nursing & Rehabilitative Care
NH
HC
MC
NC
PC
RC
Fairhaven
117
Facility 117
MA AVG 94
Rank #68 / 280
64.8%
Facility 64.8%
MA AVG 82%
Rank #79 / 96
-21%
4.07
Facility 4.07
MA AVG 3.93
Rank #31 / 93
+7%+3%
$0
Facility $0
MA AVG $76.6k
Rank #1 / 94
35
Facility 35
MA AVG 32.7
Rank #64 / 93
8.8
Facility 8.8
MA AVG 7.2
Rank #71 / 93
-76-
67
Facility 67
MA AVG 53
Rank #185 / 499
Diana Henry
$9.1M
Facility $9.1M
MA AVG $17.4M
Rank #71 / 96
$5.5M
Facility $5.5M
MA AVG $6.5M
Rank #75 / 96
60.6%
Facility 60.6%
MA AVG 43.6%
Rank #39 / 96
225485
Alden Court Nursing Care
NH
HC
NC
PC
Fairhaven
142
Facility 142
MA AVG 94
Rank #34 / 280
92.5%
Facility 92.5%
MA AVG 82%
Rank #21 / 96
+13%
3.95
Facility 3.95
MA AVG 3.93
Rank #38 / 93
-71%+1%
$0
Facility $0
MA AVG $76.6k
Rank #1 / 94
12
Facility 12
MA AVG 32.7
Rank #13 / 93
3.0
Facility 3.0
MA AVG 7.2
Rank #7 / 93
1133-
28
Facility 28
MA AVG 53
Rank #366 / 499
Peter Gordon
$20.0M
Facility $20.0M
MA AVG $17.4M
Rank #34 / 96
$9.8M
Facility $9.8M
MA AVG $6.5M
Rank #34 / 96
48.8%
Facility 48.8%
MA AVG 43.6%
Rank #51 / 96
225387
Royal of Fairhaven Nursing Center
NH
HC
MC
Fairhaven
107
Facility 107
MA AVG 94
Rank #86 / 280
82.1%
Facility 82.1%
MA AVG 82%
Rank #55 / 96
0%
3.43
Facility 3.43
MA AVG 3.93
Rank #80 / 93
+4%-13%
$8.6k
Facility $8.6k
MA AVG $76.6k
Rank #56 / 94
17
Facility 17
MA AVG 32.7
Rank #27 / 93
4.3
Facility 4.3
MA AVG 7.2
Rank #23 / 93
272-
54
Facility 54
MA AVG 53
Rank #238 / 499
Kristie Celorier
$9.4M
Facility $9.4M
MA AVG $17.4M
Rank #86 / 96
$4.5M
Facility $4.5M
MA AVG $6.5M
Rank #89 / 96
47.9%
Facility 47.9%
MA AVG 43.6%
Rank #52 / 96
225117

Financial Assistance for
Nursing Home in Massachusetts

Our Lady’s Haven Skilled Nursing & Rehabilitative Care is located in Fairhaven, Massachusetts.
Here are the financial assistance programs available to residents in Massachusetts.

Get Financial aid guidance

Home Care Program

MassHealth Home Care

Age 60+
General Massachusetts resident, at risk of nursing home placement.
Income Limits (2025) ~$1,500/month individual, varies by region
Asset Limits $2,000 individual, excludes home, car
MA

Coordinated through Aging Services Access Points (ASAPs); high demand in urban areas.

Benefits
In-home care (3-5 hours/day) Homemaker services Respite care (up to 14 days/year) Adult day care (~$75/day)

Frail Elder Waiver

Massachusetts Medicaid FE Waiver

Age 65+
General Massachusetts resident, Medicaid-eligible, nursing home-level care need.
Income Limits (2025) ~$2,829/month 300% FBR, individual
Asset Limits $2,000 (individual), $3,000 (couple).
MA

Requires clinical eligibility determination.

Benefits
Personal care (5-7 hours/day) Respite care (240 hours/year) Adult day care (~$75/day) Home health services

Senior Care Options (SCO)

Massachusetts Senior Care Options

Age 65+
General Massachusetts resident, eligible for MassHealth (Medicare optional), nursing home-level care need.
Income Limits (2025) ~$2,829/month (300% FBR, individual); QIT allowed.
Asset Limits $2,000 (individual), $3,000 (couple) (excludes home up to $713,000, car).
MA

Not available in Dukes/Nantucket Counties; multiple SCO providers (e.g., CCA, Tufts).

Benefits
Personal care (5-7 hours/day) Medical care Respite (240 hours/year) Adult

Medicare Savings Program (MSP)

Massachusetts Medicare Savings Program (MassHealth Buy-In)

Age 65+ or disabled
General Massachusetts resident, Medicare Part A/B.
Income Limits (2025) ~$2,510/month (QMB), ~$3,380/month (SLMB), ~$3,598/month (QI)—individual.
Asset Limits $9,430 (individual), $14,130 (couple).
MA

Three tiers; no waitlist; includes Extra Help for Part D.

Benefits
Covers Part B premiums ($174.70/month) Deductibles ($240/year) Copays (~20%)

National Family Caregiver Support Program (NFCSP) Respite

Massachusetts NFCSP Respite Care

Age
General Caregivers of 60+ needing care or 55+ caregivers of others; Massachusetts resident; functional needs (2+ ADLs).
Income Limits (2025) Prioritizes ~$24,980/year (individual); no strict cap.
Asset Limits Not assessed; need-based.
MA

27 ASAPs; prioritizes low-income, rural caregivers.

Benefits
Respite (4-6 hours/week or 5 days/year) Adult day care ($60/day) Caregiver training Supplies (~$500/year)

Prescription Advantage

Massachusetts Prescription Advantage

Age 65+ or disabled
General Massachusetts resident, enrolled in Medicare Part D (or ineligible for Medicare).
Income Limits (2025) No strict limit; copays vary by income ~$24,980-$75,000/year individual
Asset Limits Not assessed.
MA

Supplements Medicare Part D; no enrollment fee for low-income.

Benefits
Covers prescription copays ($5-$40/drug) Fills coverage gaps Catastrophic cost protection ($4,000+ covered)

VA Aid and Attendance (A&A) and Housebound Benefits

Massachusetts VA Aid and Attendance/Housebound

Age 65+ or disabled veteran/spouse
General Massachusetts resident, wartime service, need for ADL help (A&A) or homebound.
Income Limits (2025) Net income < ~$1,984/month (veteran with dependent, A&A); pension offsets income.
Asset Limits ~$155,356 net worth limit
MA

High veteran demand statewide.

Benefits
Cash (~$1,433-$2,642/month veteran, ~$951-$1,318 spouse) for care costs (e.g., in-home, assisted living)

Frequently Asked Questions about Our Lady’s Haven Skilled Nursing & Rehabilitative Care

Is Our Lady’s Haven Skilled Nursing & Rehabilitative Care in a walkable area?

Our Lady’s Haven Skilled Nursing & Rehabilitative Care has a walk score of 67. Moderately walkable. Some errands can be accomplished on foot, with a mix of nearby amenities.

What is the occupancy rate at Our Lady’s Haven Skilled Nursing & Rehabilitative Care?

Our Lady’s Haven Skilled Nursing & Rehabilitative Care's occupancy is 64.8%.

Does Our Lady’s Haven Skilled Nursing & Rehabilitative Care operate as a for-profit or non-profit?

Our Lady’s Haven Skilled Nursing & Rehabilitative Care is registered as a non-profit.

Are there photos of Our Lady’s Haven Skilled Nursing & Rehabilitative Care?

Yes — there are 5 photos of Our Lady’s Haven Skilled Nursing & Rehabilitative Care in the photo gallery on this page.

What is the address of Our Lady’s Haven Skilled Nursing & Rehabilitative Care?

Our Lady’s Haven Skilled Nursing & Rehabilitative Care is located at 71 Center St, Fairhaven, MA 02719.

What is the phone number of Our Lady’s Haven Skilled Nursing & Rehabilitative Care?

(508) 999-4561 will put you in contact with the team at Our Lady’s Haven Skilled Nursing & Rehabilitative Care.

Is Our Lady’s Haven Skilled Nursing & Rehabilitative Care Medicare or Medicaid certified?

Yes — Our Lady’s Haven Skilled Nursing & Rehabilitative Care is a CMS-certified provider of Medicare and Medicaid.

Guides for Better Senior Living

Care Cost Calculator: See Prices in Your Area

Nursing Home Data Explorer

Don’t Wait Too Long: 7 Red Flag Signs Your Parent Needs Assisted Living Now

The True Cost of Assisted Living in 2025 – And How Families Are Paying For It

Understanding Senior Living Costs: Pricing Models, Discounts & Financial Assistance