Alden Estates of Naperville
Nursing Home · Naperville, IL
CMS overall rating Info The Overall CMS Rating is scored from 1 to 5 stars and combines results from health inspections, staffing levels, and quality measures. Health inspections carry the most weight. Staffing and quality scores can increase or decrease the final rating based on performance compared to state and national standards.

Alden Estates of Naperville

Nursing Home · Naperville, IL
CMS overall rating Info The Overall CMS Rating is scored from 1 to 5 stars and combines results from health inspections, staffing levels, and quality measures. Health inspections carry the most weight. Staffing and quality scores can increase or decrease the final rating based on performance compared to state and national standards.
Calculator: See prices in your area
Alden Estates of Naperville accepts Medicare, Medicaid, and private pay.

Overview of Alden Estates of Naperville

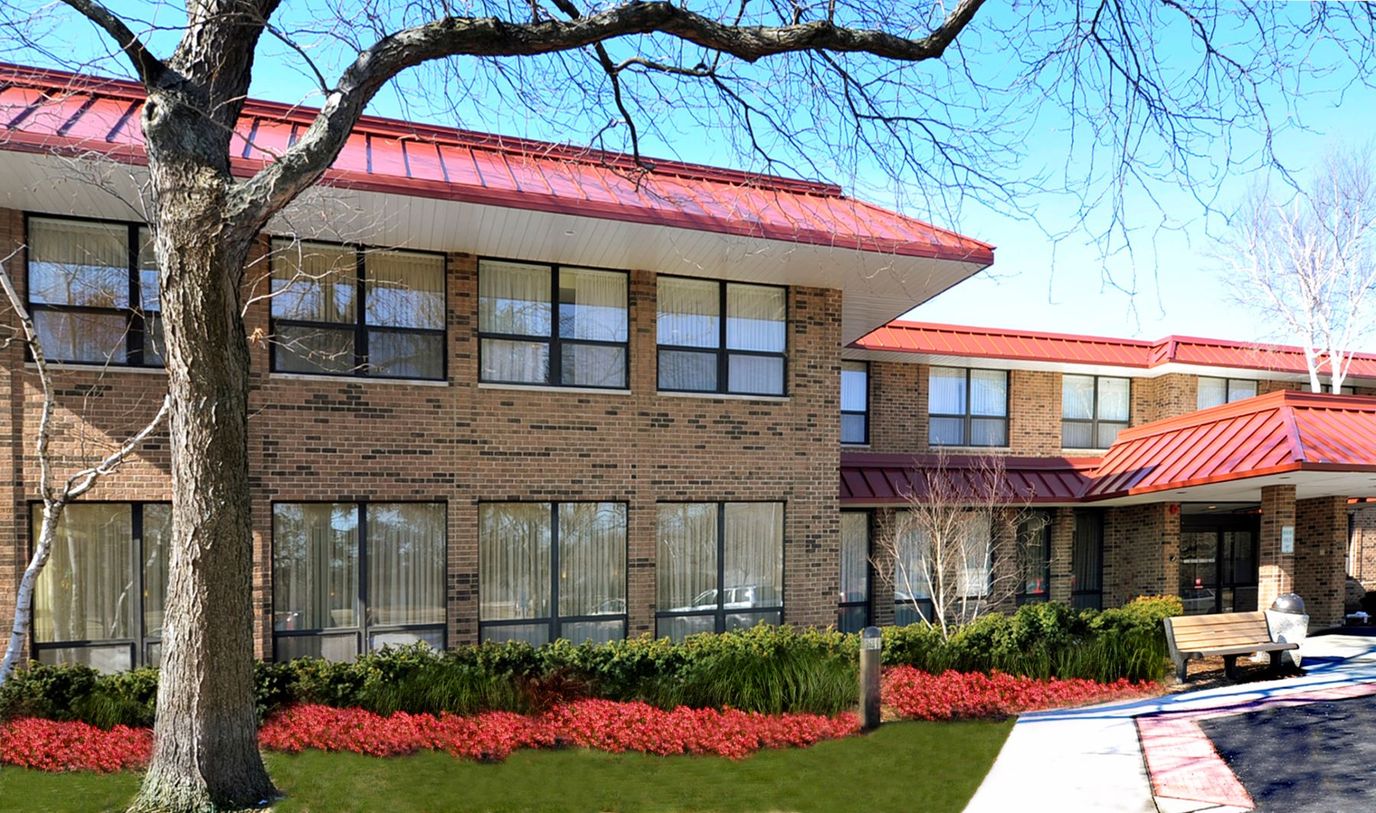
Alden Estates of Naperville stands as a trusted destination in Naperville, Illinois, providing an exceptional haven for individuals seeking innovative therapies and top-quality care. Within its walls, residents are greeted with not just care, but a luxurious experience defined by thoughtful accommodations and an array of enticing amenities. This is a place where individuals can find both recovery and renewal, backed by a range of specialized programs including orthopedic, cardiac, and neurological rehabilitation.
The home offers a five-star experience that extends beyond just care, embracing the finer aspects of life. Residents can relish in the comforts of an on-site ice cream parlor, a salon for hair and nail services, and a five-star restaurant-style dining experience that caters to breakfast, lunch, and dinner. The facility’s commitment to modernity is reflected in its complimentary Wi-Fi and state-of-the-art equipment that power its comprehensive therapy programs.

(630) 983-0300

Quality ratings

Measured by Centers for Medicare & Medicaid Services (CMS)

Overall rating Info The Overall CMS Rating combines results from health inspections, staffing levels and quality measures. Health inspections carry the most weight. Staffing and quality scores can increase or decrease the final rating based on performance compared to state and national standards.
▼ 20.6% Below IL avg. ▼ 20.6% Below IL avg.Click the badge to see the full State ranking.Click here to see the full State ranking.
Health Inspection Info Based on the results of the facility's three most recent standard inspections and any complaint investigations. CMS reviews the number, scope, and severity of deficiencies, with more recent findings weighted more heavily.
▲ 8.1% Above IL avg. ▲ 8.1% Above IL avg.Click the badge to see the full State ranking.Click here to see the full State ranking.
Staffing Info Measures average nursing staff hours per resident per day, including Registered Nurses (RNs) and total nursing staff. Ratings are adjusted based on the level of care residents require and are compared to state and national benchmarks.
▼ 53.2% Below IL avg. ▼ 53.2% Below IL avg.Click the badge to see the full State ranking.Click here to see the full State ranking.
Quality Measures Info Based on clinical and physical health indicators reported to CMS, such as hospital readmissions, falls, pressure ulcers, and improvements in mobility. These measures reflect how well residents' health needs are being managed.
▲ 6.6% Above IL avg. ▲ 6.6% Above IL avg.Click the badge to see the full State ranking.Click here to see the full State ranking.

Staffing hours breakdown

Info Daily nursing hours per resident by staff type, reported to CMS. Higher is generally better — compare this facility to state and national averages to see where staffing stands.

Hours per resident per day — compared to Illinois state averages

Total nursing care / resident Info This home is ranked 62nd out of 129 homes in Illinois.

Total adjusted nursing hours per resident per day, combining RN, LPN, and aide time. CMS adjusts this for case-mix so facilities can be fairly compared.
2h 59m per day
Rank #62 / 129Nurse hours — State benchmarkedThis home is ranked 62nd out of 129 homes in Illinois.Shows adjusted nurse hours per resident per day benchmarked to the Illinois average, with a ranking across 129 Illinois SNFs. More hours mean more direct care. The national average is about 3.5 hrs; below 3.0 is a red flag.Click the rank badge to see the full State ranking.Click here to see the full State ranking.
This facility Illinois avg (3h 6m per day)
vs Illinois avg
-4%

2 of 6 metrics below state avg

Standout metric RN (Weekend) is +12% above state avg
Staff typeHours / Day / Residentvs state avg
Registered Nurse (RN) Info RNs hold the highest nursing license and can assess residents, interpret test results, and direct care plans. More RN hours per day often signals stronger clinical oversight and faster response to health changes. 42m per day ▼ 5% State avg: 44m per day · National avg: 41m per day
LPN / LVN Info Licensed Practical Nurses (LPNs) or Licensed Vocational Nurses (LVNs) deliver routine hands-on care — medication administration, wound dressing, and monitoring vital signs. They work under RN supervision and make up a large share of daily bedside care. 30m per day ▼ 21% State avg: 38m per day · National avg: 52m per day
Nurse Aide Info Certified Nurse Aides (CNAs) provide the most direct day-to-day assistance: bathing, dressing, feeding, and mobility. Nurse aide hours are typically the largest staffing category and directly affect residents' quality of life. 2h 17m per day ▲ 7% State avg: 2h 8m per day · National avg: 2h 21m per day
Total Nursing (Weekend) Info Combined nursing hours (RN + LPN + Nurse Aide) per resident per day on weekends. Staffing often drops on weekends — this figure reveals whether the facility maintains adequate coverage outside of weekday hours. 3h 4m per day ■ Avg State avg: 3h 5m per day · National avg: 3h 26m per day
Physical Therapist Info Hours per resident per day provided by licensed Physical Therapists (PTs) or PT Assistants. PT services help residents recover mobility after injury or illness and are especially important for post-acute (short-stay) rehabilitation. 3m per day ■ Avg State avg: 3m per day · National avg: 4m per day
RN (Weekend) Info Registered nurse hours specifically on weekends. Facilities sometimes reduce RN presence on Saturdays and Sundays — a low weekend RN figure compared to weekday hours can indicate reduced clinical oversight when most administrative staff are absent. 38m per day ▲ 12% State avg: 34m per day · National avg: 29m per day

Capacity and availability

This home usually has availability

Occupancy lower than 85% suggests more openings may be available.

Higher occupancy than the Illinois average: 69.3%
Occupancy rate 72.1% Rank #76 / 129Occupancy rate — State benchmarkedThis home is ranked 76th out of 129 homes in Illinois.Shows this facility's occupancy rate versus the Illinois average, with its Statewide rank out of 129. Higher occupancy signals strong local demand and financial stability.Click the rank badge to see the full State ranking.Click here to see the full State ranking.
Avg. Length of Stay 63 days
Occupancy rate
72.1% Rank #76 / 129Occupancy rate — State benchmarkedThis home is ranked 76th out of 129 homes in Illinois.Shows this facility's occupancy rate versus the Illinois average, with its Statewide rank out of 129. Higher occupancy signals strong local demand and financial stability.Click the rank badge to see the full State ranking.Click here to see the full State ranking.
Avg. Length of Stay
63 days

Who this home usually serves

TYPE OF STAY

Mix of rehab and long-term care

This home supports both short-term rehab and long-term care, with residents staying for a wide range of durations.

Breakdown by payment type

Medicare

11% of new residents, usually for short-term rehab.

Typical stay 1 - 2 months

Private pay

50% of new residents, often for short stays.

Typical stay 1 - 2 months

Medicaid

40% of new residents, often for long-term daily care.

Typical stay 3 - 4 months

Finances and operations

Privately-owned community
Operated by a business corporation.
Home revenue
$16.7M
Operating loss
-$2.5M
Privately-owned community Operated by a business corporation.
Home revenue
$16.7M Rank #61 / 127Revenue — State benchmarkedThis home is ranked 61st out of 127 homes in Illinois.Shows this facility's annual revenue compared to the Illinois SNF average. Higher revenue generally means more resources for staffing and capital — read alongside Payroll %.Click the rank badge to see the full State ranking.Click here to see the full State ranking.
Operating loss
-$2.5M
Payroll costs Info The portion of the home's budget spent on staff, including nurses, caregivers, and other employees who support care and operations. Rank #70 / 127Payroll — State benchmarkedThis home is ranked 70th out of 127 homes in Illinois.Shows total annual staff payroll benchmarked to the Illinois average. Higher payroll investment relative to peers often signals better staffing and less reliance on cheaper contract labor.Click the rank badge to see the full State ranking.Click here to see the full State ranking.
$7.2M
43.2% of revenue Rank #82 / 127Payroll % — State benchmarkedThis home is ranked 82nd out of 127 homes in Illinois.Shows payroll as a percentage of revenue versus the Illinois average. Well-run Illinois SNFs typically land around 52–65% — the top third Statewide. Below 25% may signal understaffing or heavy agency use — read with Staffing ratings.Click the rank badge to see the full State ranking.Click here to see the full State ranking.
Other operating costs Info All remaining costs needed to run the home, such as food, utilities, building maintenance, supplies and administrative expenses.
$12.0M
Total costs $19.3M
Walk Score
Walk Score: 45 / 100 Rank #81 / 130Walk Score — State benchmarkedThis home is ranked 81st out of 130 homes in Illinois.Shows how walkable this facility's neighborhood is compared to the average Walk Score across Illinois SNFs. Higher scores benefit residents, families, and staff.Click the rank badge to see the full State ranking.Click here to see the full State ranking.
Somewhat walkable. A few nearby services may be reachable on foot, but most trips require transportation.

About this community

Therapy & Rehabilitation

3 services
Rehabilitation Services
Respite Care
Short-Term Rehab

Staffing & Medical

1 service
24-Hour Staffing

Additional Services

1 service
Short-Term Rehabilitation And Post-Acute Care

Contact Alden Estates of Naperville

Health Inspection History

Inspections Since 2022
Total health inspections 13

Illinois average 10.4


Last Health inspection on Aug 2025

Total health citations
49 Rank #98 / 128Health citations — State benchmarkedThis home is ranked 98th out of 128 homes in Illinois.Shows this facility's total health deficiency citations benchmarked to the Illinois State average, with a ranking across all 128 IL SNFs. Lower citation counts earn a better rank.Click the rank badge to see the full State ranking.Click here to see the full State ranking.

Illinois average 36.8

Citations per inspection
3.77 Rank #76 / 128Citations per inspection — State benchmarkedThis home is ranked 76th out of 128 homes in Illinois.Shows average deficiency citations per CMS inspection for this facility versus the Illinois mean across 128 SNFs with citation data. Lower is better.Click the rank badge to see the full State ranking.Click here to see the full State ranking.

Illinois average 3.68


Health citations are formal notices following inspections when they fail to comply with safety and care standards.

25 of 49 citations resulted from standard inspections; and 24 of 49 resulted from complaint investigations.

Breakdown of citation severity (last 4 years)
Critical Health citations
0
100% better than Illinois average

Illinois average: 0.7


Serious Health citations
2 Rank #19 / 100Serious citations (G–I) — State benchmarkedThis home is ranked 19th out of 100 homes in Illinois.Shows G–I scope serious health citations for this facility versus other Illinois SNFs. Lower counts rank better.Click the rank badge to see the full State ranking.Click here to see the full State ranking.
44% better than Illinois average

Illinois average: 3.6

0 critical citations Illinois average: 0.7

2 serious citations Illinois average: 3.6

47 moderate citations Illinois average: 32

0 minor citations Illinois average: 0.5
Citations history (last 4 years)
Quality of Care moderate citation Aug 31, 2025
Corrected

Administration moderate citation Jun 13, 2024
Corrected

Infection Control moderate citation Jun 13, 2024
Corrected

Nutrition moderate citation Jun 13, 2024
Corrected

Financial Assistance for
Nursing Home in Illinois

Alden Estates of Naperville is located in Naperville, Illinois.
Here are the financial assistance programs available to residents in Illinois.

Get Financial aid guidance

Community Care Program

Illinois CCP

Age 60+
General Illinois resident, at risk of nursing home placement.
Income Limits (2025) ~$1,215/month individual
Asset Limits $17,500 individual, excludes home, car
IL

High demand in urban areas; waitlists possible.

Benefits
In-home care (3-5 hours/day) Adult day services ($65/day) Emergency home response systems ($30/month)

Illinois Respite Program

IL Respite (via NFCSP)

Age Caregiver of someone 60+ (or with dementia)
General Illinois resident.
Income Limits No strict limit; prioritizes low-income.
Asset Limits Not applicable.
IL

Limited slots; urban/rural balance.

Benefits
In-home respite (4-6 hours/day) Adult day care (~$65/day) Short-term facility care (up to 5 days)

Supportive Living Program (SLP)

Illinois Medicaid Supportive Living Program

Age 65+ or 22-64 with disability
General Illinois resident, Medicaid-eligible, needs moderate assistance (not nursing home-level).
Income Limits (2025) ~$2,829/month (300% FBR, individual); QIT allowed.
Asset Limits $2,000 (individual), $3,000 (couple) (excludes home, car).
IL

~200 SLP sites statewide; room/board not covered.

Benefits
Personal care (5-7 hours/day, e.g., bathing, mobility) Meals Housekeeping Medication management Respite (~240 hours/year)

Persons Who Are Elderly Waiver

Illinois Medicaid Elderly Waiver

Age 65+
General Illinois resident, Medicaid-eligible, nursing home-level care need.
Income Limits (2025) ~$2,829/month 300% FBR, individual
Asset Limits $2,000 (individual), $3,000 (couple).
IL

Part of HealthChoice Illinois; consumer-directed options available.

Benefits
Personal care (5-7 hours/day, e.g., dressing, eating) Homemaker Adult day care (~$60/day) Respite (240 hours/year) Home mods ($1,000 avg.)

Medicare Savings Program (MSP)

Illinois Medicare Savings Program

Age 65+ or disabled
General Illinois resident, Medicare Part A/B.
Income Limits (2025) ~$2,510/month (QMB), ~$3,380/month (SLMB), ~$3,598/month (QI)—individual.
Asset Limits $9,430 (individual), $14,130 (couple).
IL

Three tiers; no waitlist.

Benefits
Covers Part B premiums ($174.70/month) Deductibles ($240/year) Copays (~20%)

Optional State Supplementation (OSS)

Illinois Optional State Supplementation

Age 65+ or disabled
General Illinois resident, in approved facility, SSI recipient or low-income.
Income Limits (2025) ~$1,004/month including SSI
Asset Limits $2,000 (individual), $3,000 (couple).
IL

~$50-$500/month based on facility type.

Benefits
Cash (~$50-$500/month) for room/board in personal care homes or SLFs

VA Aid and Attendance (A&A) and Housebound Benefits

Illinois VA Aid and Attendance/Housebound

Age 65+ or disabled veteran/spouse
General Illinois resident, wartime service, need for ADL help (A&A) or homebound.
Income Limits (2025) Net income < ~$1,984/month (veteran with dependent, A&A); pension offsets income.
Asset Limits ~$155,356 net worth limit
IL

High veteran demand in urban/rural areas.

Benefits
Cash (~$1,433-$2,642/month veteran, ~$951-$1,318 spouse) for care costs (e.g., in-home, assisted living)

Places of interest near Alden Estates of Naperville

Address 2.3 miles from city center Info Estimated distance in miles from Naperville's city center to Alden Estates of Naperville's address, calculated via Google Maps.

Calculate Travel Distance to Alden Estates of Naperville

Add your location

Address

Staffing Data

Reporting period: April 1 – June 30, 2025 (Q2 2025). Source: CMS Payroll-Based Journal report.

Total staff 188
Employees 152
Contractors 36
Staff to resident ratio 1.24:1
35% worse than Illinois average
Illinois average ratio: 1.90:1 Illinois average ratio: 1.90:1See full Illinois ranking
Avg staff/day 70
Average shift 8.7 hours
14% better than Illinois average
Illinois average: 7.6 hours Illinois average shift: 7.6 hoursSee full Illinois ranking
Total staff hours (quarter) 55,462

Nursing staff breakdown

Q2 2025 · Apr 1 – Jun 30 More info This data comes from the CMS Payroll-Based Journal report covering April 1 – June 30, 2025.
Registered Nurse

Manages medical care and health needs.

Total count 22
Average shift length Info Average shift length. Calculated as total hours divided by days worked and average staff per day. 9.9 hours

No contractors work on this role.

Licensed Practical Nurse

Assists with medical care and medications.

Total count 16
Average shift length Info Average shift length. Calculated as total hours divided by days worked and average staff per day. 10.2 hours

No contractors work on this role.

Certified Nursing Assistant

Helps with daily care and mobility.

Total count 97
Average shift length Info Average shift length. Calculated as total hours divided by days worked and average staff per day. 8.8 hours

No contractors work on this role.

Contractor staffing

Q2 2025 · Apr 1 – Jun 30 More info This data comes from the CMS Payroll-Based Journal report covering April 1 – June 30, 2025.

Total hours from contractors

7.3%

4,035 contractor hours this quarter

Physical Therapy Assistant: 9 Physical Therapy Aide: 7 Speech Language Pathologist: 7 Qualified Social Worker: 3 Respiratory Therapy Technician: 3 Occupational Therapy Aide: 2 Medical Director: 1 Therapeutic Recreation Specialist: 1 Other Social Services Staff: 1 Nurse Practitioner: 1 Qualified Activities Professional: 1

Staff by category

Q2 2025 · Apr 1 – Jun 30 More info This data comes from the CMS Payroll-Based Journal report covering April 1 – June 30, 2025.
Certified Nursing Assistant9709729,54991100%8.8
Registered Nurse220229,31291100%9.9
Licensed Practical Nurse160167,12791100%10.2
Other Dietary Services Staff100102,49791100%7.4
Physical Therapy Assistant0991,0998492%6.7
Respiratory Therapy Technician0331,0336470%8.1
RN Director of Nursing2029547077%7.3
Physical Therapy Aide0776807987%7.4
Other Social Services Staff1124816369%7.5
Speech Language Pathologist0774755965%7.9
Administrator1014725965%8
Nurse Practitioner1124656268%7.5
Dental Services Staff1014125763%7.2
Dietitian1013635055%7.3
Therapeutic Recreation Specialist0112123538%6
Occupational Therapy Aide0221832730%6.5
Qualified Social Worker0331195459%2.2
Medical Director011302325%1.3
Qualified Activities Professional011111%1.3
97 Certified Nursing Assistant
% of Days 100%
22 Registered Nurse
% of Days 100%
16 Licensed Practical Nurse
% of Days 100%
10 Other Dietary Services Staff
% of Days 100%
9 Physical Therapy Assistant
% of Days 92%
3 Respiratory Therapy Technician
% of Days 70%
2 RN Director of Nursing
% of Days 77%
7 Physical Therapy Aide
% of Days 87%
2 Other Social Services Staff
% of Days 69%
7 Speech Language Pathologist
% of Days 65%
1 Administrator
% of Days 65%
2 Nurse Practitioner
% of Days 68%
1 Dental Services Staff
% of Days 63%
1 Dietitian
% of Days 55%
1 Therapeutic Recreation Specialist
% of Days 38%
2 Occupational Therapy Aide
% of Days 30%
3 Qualified Social Worker
% of Days 59%
1 Medical Director
% of Days 25%
1 Qualified Activities Professional
% of Days 1%

Facility Characteristics

Source: CMS Long-Term Care Facility Characteristics (Data as of Jan 2026)

Total residents 152
Medicare
16
10.5% of residents
Medicaid
104
68.4% of residents
Private pay or other
32
21.1% of residents
Programs & Services
Residents Group

Residents meet regularly to discuss policies, care quality, and activities

Active Resident Council

Organized group of residents that meets regularly to discuss facility policies, quality of life, and activities.

Quality of care over time

These measures show how residents usually do over time at this home, based on health outcomes and preventive care.

High-risk clinical events score Info A composite score based on pressure ulcers, falls with injury, weight loss, walking ability decline, and activities of daily living decline. 6.4
34% better than Illinois average

Illinois average: 9.7

Functional decline score Info A composite score based on activities of daily living decline, walking ability decline, and incontinence. 12.2
34% better than Illinois average

Illinois average: 18.6

Long-stay resident measures
Above average Info CMS star rating based on long-stay quality measure performance. 5 stars = significantly above average, 1 star = significantly below average.
Need for Help with Daily Activities Increased Info Percent of long-stay residents whose need for help with daily activities has increased 8.3%
46% better than Illinois average

Illinois average: 15.5%

Walking Ability Worsened Info Percent of long-stay residents whose ability to move independently worsened 6.3%
66% better than Illinois average

Illinois average: 18.4%

Low Risk Residents with Bowel/Bladder Incontinence Info Percent of low risk long-stay residents who lose control of their bowels or bladder 22.0%
In line with Illinois average

Illinois average: 21.6%

Falls with Major Injury Info Percent of long-stay residents experiencing one or more falls with major injury 1.1%
68% better than Illinois average

Illinois average: 3.4%

High Risk Residents with Pressure Ulcers Info Percent of long-stay high risk residents with pressure ulcers 6.5%
23% worse than Illinois average

Illinois average: 5.3%

Urinary Tract Infection Info Percent of long-stay residents with a urinary tract infection 1.5%
18% better than Illinois average

Illinois average: 1.8%

Lost Too Much Weight Info Percent of long-stay residents who lose too much weight 9.8%
49% worse than Illinois average

Illinois average: 6.5%

Depressive Symptoms Info Percent of long-stay residents who have depressive symptoms 6.3%
87% better than Illinois average

Illinois average: 48.1%

Antipsychotic Use Info Percent of long-stay residents who received an antipsychotic medication 18.4%
9% better than Illinois average

Illinois average: 20.2%

Pneumococcal Vaccine Info Percent of long-stay residents assessed and appropriately given the pneumococcal vaccine 47.1%
47% worse than Illinois average

Illinois average: 89.2%

Influenza Vaccine Info Percent of long-stay residents assessed and appropriately given the seasonal influenza vaccine 91.4%
In line with Illinois average

Illinois average: 91.6%

Hospitalizations per 1,000 days Info Number of hospitalizations per 1,000 long-stay resident days. 3.40
66% worse than Illinois average

Illinois average: 2.05

ED visits per 1,000 days Info Number of outpatient emergency department visits per 1,000 long-stay resident days. 1.12
50% better than Illinois average

Illinois average: 2.25

Short-stay resident measures
Below average Info CMS star rating based on short-stay quality measure performance. 5 stars = much above average, 1 star = much below average.
Pneumococcal Vaccine Info Percent of short-stay residents assessed and appropriately given the pneumococcal vaccine 18.3%
73% worse than Illinois average

Illinois average: 68.3%

Antipsychotic medication increase Info Percent of short-stay residents who newly received an antipsychotic medication 0.9%
60% better than Illinois average

Illinois average: 2.3%

Influenza Vaccine Info Percent of short-stay residents assessed and appropriately given the seasonal influenza vaccine 38.7%
39% worse than Illinois average

Illinois average: 63.0%

Re-hospitalized after SNF stay Info Percentage of short-stay residents who were re-hospitalized after their nursing home admission. 31.7%
21% worse than Illinois average

Illinois average: 26.2%

Emergency department visits Info Percentage of short-stay residents who had an outpatient emergency department visit. 13.9%
In line with Illinois average

Illinois average: 14.0%

Falls with major injury Info Percentage of SNF residents who experience falls with major injury during their stay. 0.0%
100% better than Illinois average

Illinois average: 0.8%

Ability to care for self at discharge Info Percentage of residents at or above expected ability to care for themselves at discharge. 61.2%
14% better than Illinois average

Illinois average: 53.7%

Successful return to home or community Info Rate of successful return to home or community from a skilled nursing facility. 41.5%
18% worse than Illinois average

Illinois average: 50.6%

Penalties and fines

Federal penalties imposed by CMS for regulatory violations, including civil money penalties (fines) and denials of payment for new Medicare/Medicaid admissions.

Source: CMS Penalties Database (Data as of Jan 2026)

Total fines amount $9K Rank #53 / 129Federal fines — State benchmarkedThis home is ranked 53rd out of 129 homes in Illinois.Shows this facility's cumulative CMS federal fine dollars versus the Illinois average among facilities with fines, and where it ranks among 129 skilled nursing facilities in the pool. Lower total dollars mean a better rank.Click the rank badge to see the full State ranking.Click here to see the full State ranking.
94% lower than Illinois average

Illinois average: $143K

Number of fines 1
66% fewer fines than Illinois average

Illinois average: 3.0

Payment Denials Info Serious action where Medicare and/or Medicaid temporarily stops payments for new residents until issues are fixed. 0
100% fewer payment denials than Illinois average

Illinois average: 1.1

Fines amount comparison
This facility $9K
Illinois average $143K
Penalty History

Penalties are imposed by CMS for violations of federal nursing home regulations.

1 penalty in the past 3 years

Apr 10, 2024 · $9K

Civil Money Penalty Info Fines imposed for noncompliance, which can be assessed per day or per instance of violation. Apr 10, 2024
$9K

Last updated: Jan 2026

Compare Nursing Home around Bolingbrook

The information below is reported by the Illinois Department of Public Health, Office of Health Care Regulation.

3 facilities compared · CMS & IL Dept. of Health data

Filter by care type
Alden Estates of Naperville
NH

Nursing Home Licensed facility providing 24/7 skilled nursing care for residents with complex, ongoing medical needs. Staffed by RNs, LPNs, and CNAs. Inspected and star-rated annually by CMS. Accepts Medicare (short-term rehab) and Medicaid (long-term care).

Naperville (Naperville Park District)203 72.1% +4%2.98 -17%-4%$9.3k493.82156- 45 The Floyd A. Schlossberg Living Trust$16.7M$7.2M43.2%145582
Meadowbrook Naperville
NH

Nursing Home Licensed facility providing 24/7 skilled nursing care for residents with complex, ongoing medical needs. Staffed by RNs, LPNs, and CNAs. Inspected and star-rated annually by CMS. Accepts Medicare (short-term rehab) and Medicaid (long-term care).

Naperville (Raymond Drive)245 81.0% +17%2.41 +31%-22%$234.5k543.26210- 52 -$23.9M$11.9M49.9%145874
Meadowbrook Bolingbrook
NH

Nursing Home Licensed facility providing 24/7 skilled nursing care for residents with complex, ongoing medical needs. Staffed by RNs, LPNs, and CNAs. Inspected and star-rated annually by CMS. Accepts Medicare (short-term rehab) and Medicaid (long-term care).

AL

Assisted Living A licensed, long-term care setting for seniors or individuals with disabilities who need help with daily activities — like bathing, dressing, and medication management — but not 24-hour skilled nursing. Offers housing, meals, and around-the-clock support while aiming to maximize resident independence.

IL

Independent Living Lifestyle-focused communities for older adults offering dining, activities, and transportation with minimal personal care. Best for active, independent seniors who want community without medical support.

MC

Memory Care Secured, specialized care for people living with Alzheimer's or dementia. Staff trained in cognitive impairment, with higher staff-to-resident ratios and an environment designed to reduce confusion and wandering risk.

Bolingbrook (Remington Boulevard)298 77.5% +12%2.88 +33%-7%$217.3k483.05236C+ 33 Descendants S Corp Fbo Ashley Maria Dimas$33.4M$15.2M45.5%145710

Guides for Better Senior Living

Care Cost Calculator: See Prices in Your Area

Nursing Home Data Explorer

Don’t Wait Too Long: 7 Red Flag Signs Your Parent Needs Assisted Living Now

The True Cost of Assisted Living in 2025 – And How Families Are Paying For It

Understanding Senior Living Costs: Pricing Models, Discounts & Financial Assistance

Frequently Asked Questions about Alden Estates of Naperville

What neighborhood is Alden Estates of Naperville in?

Alden Estates of Naperville is in the Naperville Park District neighborhood of Naperville.

Is Alden Estates of Naperville in a walkable area?

Alden Estates of Naperville has a walk score of 45. Somewhat walkable. A few nearby services may be reachable on foot, but most trips require transportation.

What is the occupancy rate at Alden Estates of Naperville?

Alden Estates of Naperville's occupancy is 72.1%.

Are there photos of Alden Estates of Naperville?

Yes — there are 4 photos of Alden Estates of Naperville in the photo gallery on this page.

What is the address of Alden Estates of Naperville?

Alden Estates of Naperville is located at 1525 Oxford Lane, Naperville, IL 60565.

What is the phone number of Alden Estates of Naperville?

(630) 983-0300 will put you in contact with the team at Alden Estates of Naperville.

Is Alden Estates of Naperville Medicare or Medicaid certified?

Yes — Alden Estates of Naperville is a CMS-certified provider of Medicare and Medicaid.

Explore Open Rooms
1 Contact details
2 What type of senior care service are you looking for?
3 What budget do you have in mind for senior care?
4 How soon do you need to find care?
5 Additional details

Thank you for your interest!

Our team will be in touch shortly to help with next steps.