The Springs at Monarch Landing

Assisted Living in Naperville

CMS overall rating Info The Overall CMS Rating is scored from 1 to 5 stars and combines results from health inspections, staffing levels, and quality measures. Health inspections carry the most weight. Staffing and quality scores can increase or decrease the final rating based on performance compared to state and national standards.

Overview of The Springs at Monarch Landing

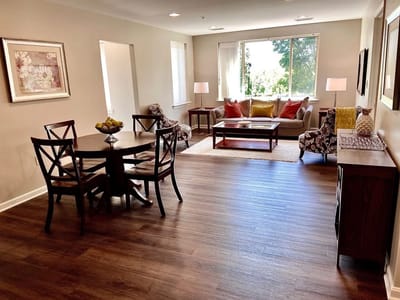
The Springs at Monarch Landing ensures that every aspect of residential wellness is stimulated to create the best version of themselves. They promote an engaging and enriching lifestyle for residents of independent living, assisted living, and memory care. The vibrant community offers a home-like atmosphere that can elevate the senior living experience. The Springs at Grand Park is where seniors nurture their holistic needs.

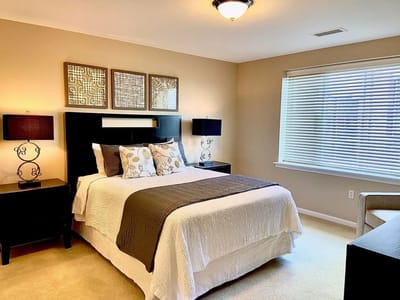
The residential independent and assisted living housing offers private apartments with full kitchens and private bathrooms. The memory care unit has more services given to residents regarding specifically designed programs that stimulate cognitive retention. All residents are encouraged to live a worry-free lifestyle by assisting seniors with daily activities.

(630) 344-0300

Quality ratings

Measured by Centers for Medicare & Medicaid Services (CMS)

Overall rating Info The Overall CMS Rating combines results from health inspections, staffing levels and quality measures. Health inspections carry the most weight. Staffing and quality scores can increase or decrease the final rating based on performance compared to state and national standards.
5/5 ▲ 1.9 Illinois average: 3.2/5
Health Inspection Info Based on the results of the facility's three most recent standard inspections and any complaint investigations. CMS reviews the number, scope, and severity of deficiencies, with more recent findings weighted more heavily.
5/5 ▲ 2.0 Illinois average: 3.0/5
Staffing Info Measures average nursing staff hours per resident per day, including Registered Nurses (RNs) and total nursing staff. Ratings are adjusted based on the level of care residents require and are compared to state and national benchmarks.
5/5 ▲ 1.7 Illinois average: 3.3/5
Quality Measures Info Based on clinical and physical health indicators reported to CMS, such as hospital readmissions, falls, pressure ulcers, and improvements in mobility. These measures reflect how well residents' health needs are being managed.
4/5 ▲ 0.8 Illinois average: 3.2/5

Staffing hours breakdown

Info Daily nursing hours per resident by staff type, reported to CMS. Higher is generally better — compare this facility to state and national averages to see where staffing stands.

Hours per resident per day — compared to Illinois state averages

Total nursing care / resident Info This home is ranked 7th out of 128 homes in Illinois.

Total adjusted nursing hours per resident per day, combining RN, LPN, and aide time. CMS adjusts this for case-mix so facilities can be fairly compared.
5h 41m per day
Rank #7 / 128Nurse hours — state benchmarkedThis home is ranked 7th out of 128 homes in Illinois.Shows adjusted nurse hours per resident per day benchmarked to the Illinois average, with a ranking across 128 Illinois SNFs. More hours mean more direct care. The national average is about 3.5 hrs; below 3.0 is a red flag.
This facility Illinois avg (3h 57m per day)
vs Illinois avg
+44%

0 of 6 metrics below state avg

Standout metric RN (Weekend) is +121% above state avg
Staff typeHours / dayvs state avg
Registered Nurse (RN) Info RNs hold the highest nursing license and can assess residents, interpret test results, and direct care plans. More RN hours per day often signals stronger clinical oversight and faster response to health changes. 1h 36m per day ▲ 118% State avg: 44m per day · National avg: 41m per day
LPN / LVN Info Licensed Practical Nurses (LPNs) or Licensed Vocational Nurses (LVNs) deliver routine hands-on care — medication administration, wound dressing, and monitoring vital signs. They work under RN supervision and make up a large share of daily bedside care. 40m per day ▲ 5% State avg: 38m per day · National avg: 52m per day
Nurse Aide Info Certified Nurse Aides (CNAs) provide the most direct day-to-day assistance: bathing, dressing, feeding, and mobility. Nurse aide hours are typically the largest staffing category and directly affect residents' quality of life. 3h 0m per day ▲ 41% State avg: 2h 8m per day · National avg: 2h 20m per day
Total Nursing (Weekend) Info Combined nursing hours (RN + LPN + Nurse Aide) per resident per day on weekends. Staffing often drops on weekends — this figure reveals whether the facility maintains adequate coverage outside of weekday hours. 4h 40m per day ▲ 51% State avg: 3h 5m per day · National avg: 3h 26m per day
Physical Therapist Info Hours per resident per day provided by licensed Physical Therapists (PTs) or PT Assistants. PT services help residents recover mobility after injury or illness and are especially important for post-acute (short-stay) rehabilitation. 5m per day ▲ 67% State avg: 3m per day · National avg: 4m per day
RN (Weekend) Info Registered nurse hours specifically on weekends. Facilities sometimes reduce RN presence on Saturdays and Sundays — a low weekend RN figure compared to weekday hours can indicate reduced clinical oversight when most administrative staff are absent. 1h 15m per day ▲ 121% State avg: 34m per day · National avg: 28m per day

Capacity and availability

This home usually has limited availability

Occupancy between 85% and 95% suggests balanced demand.

Higher occupancy than the Illinois average: 69.3%
Occupancy rate 90.6% Rank #12 / 128Occupancy rate — state benchmarkedThis home is ranked 12th out of 128 homes in Illinois.Shows this facility's occupancy rate versus the Illinois average, with its statewide rank out of 128. Higher occupancy signals strong local demand and financial stability.
Avg. Length of Stay 52 days
Occupancy rate
90.6% Rank #12 / 128Occupancy rate — state benchmarkedThis home is ranked 12th out of 128 homes in Illinois.Shows this facility's occupancy rate versus the Illinois average, with its statewide rank out of 128. Higher occupancy signals strong local demand and financial stability.
Avg. Length of Stay
52 days

Who this home usually serves

TYPE OF STAY

Mostly short-term rehab stays

Most residents typically stay for a few weeks or months before returning home or moving on.

Might be optimal for
Short stays Recovery Medicare-covered care

Breakdown by payment type

Medicare

65% of new residents, usually for short-term rehab.

Typical stay 19 days

Private pay

35% of new residents, often for short stays.

Typical stay 5 - 6 months

Finances and operations

Privately-owned community
Operated by a business corporation.
Home revenue
$37.8M
Operating loss
-$4.6M
Privately-owned community Operated by a business corporation.
Home revenue
$37.8M Rank #39 / 126Revenue — state benchmarkedThis home is ranked 39th out of 126 homes in Illinois.Shows this facility's annual revenue compared to the Illinois SNF average. Higher revenue generally means more resources for staffing and capital — read alongside Payroll %.
Operating loss
-$4.6M
Payroll costs Info The portion of the home's budget spent on staff, including nurses, caregivers, and other employees who support care and operations. Rank #3 / 126Payroll — state benchmarkedThis home is ranked 3rd out of 126 homes in Illinois.Shows total annual staff payroll benchmarked to the Illinois average. Higher payroll investment relative to peers often signals better staffing and less reliance on cheaper contract labor.
$13.8M
36.5% of revenue Rank #11 / 126Payroll % — state benchmarkedThis home is ranked 11th out of 126 homes in Illinois.Shows payroll as a percentage of revenue versus the Illinois average. Well-run SNFs often land around 55–65%. Below 25% may signal understaffing or heavy agency use — read with Staffing ratings.
Other operating costs Info All remaining costs needed to run the home, such as food, utilities, building maintenance, supplies and administrative expenses.
$28.6M
Total costs $42.4M
Bed community size
28-bed community
A moderately sized community that may balance personal attention with shared amenities and social activities.
Years in operation
1 year in operation
A newer community that may feature more recent facilities and programs.
Walk Score
Walk Score: 27 / 100 Rank #84 / 99Walk Score — state benchmarkedThis home is ranked 84th out of 99 homes in Illinois.Shows how walkable this facility's neighborhood is compared to the average Walk Score across Illinois SNFs. Higher scores benefit residents, families, and staff.
Somewhat walkable. A few nearby services may be reachable on foot, but most trips require transportation.

About this community

License Details

Facility TypeAssisted Living/shared Housing Establishment
StatusActive
IssuanceDecember 3, 2024
ExpirationFebruary 12, 2026
CountyDupage

Ownership & Operating Entity

The Springs at Monarch Landing is legally operated by Monarch Landing Opco (sl-vii) Llc.

Type Of Units

Alzheimer's Units
28 units
Total beds
28 units

Memory & Specialized Care

1 service
Offers Alzheimer's Care

What does this home offer?

Pets allowed icon
Pets allowed icon

Pets Allowed: Yes, Pets Allowed

Housing options icon

Housing Options: Private Rooms / Semi-Private Rooms

Building type icon
Building type icon

Building Type: 3-story

Transportation services icon

Transportation Services

Fitness and recreation icon

Fitness and Recreation

Types of Care at The Springs at Monarch Landing

Assisted Living Memory Care Nursing Home

Contact The Springs at Monarch Landing

Inspection History

In Illinois, the Department of Public Health, Office of Health Care Regulation conducts annual unannounced surveys to assess compliance with state and federal healthcare facility standards.

3 visits/inspections Info Inspections are mandatory, regular evaluations conducted by state health departments or regulatory agencies. They ensure the community provides safe, compliant care, covering areas like resident health, staff and management.

1 other visits

Breakdown by inspection type
  • 1 licensing inspection
  • 1 incident investigation
  • 1 other inspection

Latest inspection

Date December 22, 2025

Inspection history

Inspection
05/23/2023
B40O11 7D FRI = Facility Reported Incident
07/26/2025
YTDN11 Annual Lic. Only = Annual Licensure Only Survey
12/22/2025

Inspection Report Summary for The Springs at Monarch Landing

The most recent inspection on December 22, 2025, found the facility in compliance with applicable assisted living regulations and administrative codes, with no deficiencies noted. Earlier inspections also showed no deficiencies, indicating a consistent pattern of compliance. There were no complaint investigations reported in the available records. Enforcement actions such as fines or license suspensions were not listed in the available reports. This inspection history suggests the facility has maintained regulatory standards over time.

Health Inspection History

Inspections
Total health inspections 5

Illinois average 10.4


Last Health inspection on Jul 2024

Total health citations
12 Rank #17 / 127Health citations — state benchmarkedThis home is ranked 17th out of 127 homes in Illinois.Shows this facility's total health deficiency citations benchmarked to the Illinois state average, with a ranking across all 127 IL SNFs. Lower citation counts earn a better rank.

Illinois average 36.8

Citations per inspection
2.4

Illinois average 3.68


Health citations are formal notices following inspections when they fail to comply with safety and care standards.

10 of 12 citations resulted from standard inspections; and 2 of 12 resulted from complaint investigations.

Breakdown of citation severity (last 3 years)
Critical Health citations More info
0
100% better than Illinois average

Illinois average: 0.7


Serious Health citations More info 0
100% better than Illinois average

Illinois average: 3.6

0 critical citations More info Illinois average: 0.7

0 serious citations More info Illinois average: 3.6

12 moderate citations More info Illinois average: 32

0 minor citations More info Illinois average: 0.5
Citations history (last 3 years)
Infection Control moderate citation Info Issues related to preventing and controlling infections, including hygiene practices and safety protocols. Jul 31, 2024
Corrected

Nutrition moderate citation Info Issues related to food quality, meal service, and resident's nutritional needs. Jul 31, 2024
Corrected

Pharmacy moderate citation Info Issues related to medication management, including how drugs are stored, administered, and monitored. Jul 31, 2024
Corrected

Quality of Care moderate citation Info Issues related to how well residents receive appropriate treatment and support for their medical and daily care needs. Jul 31, 2024
Corrected

Compare Assisted Living around Naperville The information below is reported by the Illinois Department of Public Health, Office of Health Care Regulation.

Filter by care type
Sunrise of Westmont
AL

Assisted Living A licensed, long-term care setting for seniors or individuals with disabilities who need help with daily activities — like bathing, dressing, and medication management — but not 24-hour skilled nursing. Offers housing, meals, and around-the-clock support while aiming to maximize resident independence.

MC

Memory Care Secured, specialized care for people living with Alzheimer's or dementia. Staff trained in cognitive impairment, with higher staff-to-resident ratios and an environment designed to reduce confusion and wandering risk.

Westmont107Yes 66 --Aspired Living Westmont Opco Llc740Studio / Suite / 1 Bed / 2 Bed
Sunrise at Fountain Square
AL

Assisted Living A licensed, long-term care setting for seniors or individuals with disabilities who need help with daily activities — like bathing, dressing, and medication management — but not 24-hour skilled nursing. Offers housing, meals, and around-the-clock support while aiming to maximize resident independence.

IL

Independent Living Lifestyle-focused communities for older adults offering dining, activities, and transportation with minimal personal care. Best for active, independent seniors who want community without medical support.

MC

Memory Care Secured, specialized care for people living with Alzheimer's or dementia. Staff trained in cognitive impairment, with higher staff-to-resident ratios and an environment designed to reduce confusion and wandering risk.

Lombard (Fountain Square)80Yes 58 1-Hcri Sun Three Lombard Il Senior Living Llc602Studio / Suite / 1 Bed
Sunrise of Naperville North
AL

Assisted Living A licensed, long-term care setting for seniors or individuals with disabilities who need help with daily activities — like bathing, dressing, and medication management — but not 24-hour skilled nursing. Offers housing, meals, and around-the-clock support while aiming to maximize resident independence.

MC

Memory Care Secured, specialized care for people living with Alzheimer's or dementia. Staff trained in cognitive impairment, with higher staff-to-resident ratios and an environment designed to reduce confusion and wandering risk.

Naperville (Naperville Park District)77Yes 49 18-Welltower Opco Group Llc301Private Rooms / Semi-Private Rooms
Sunrise of Naperville
AL

Assisted Living A licensed, long-term care setting for seniors or individuals with disabilities who need help with daily activities — like bathing, dressing, and medication management — but not 24-hour skilled nursing. Offers housing, meals, and around-the-clock support while aiming to maximize resident independence.

MC

Memory Care Secured, specialized care for people living with Alzheimer's or dementia. Staff trained in cognitive impairment, with higher staff-to-resident ratios and an environment designed to reduce confusion and wandering risk.

Naperville (Naperville Park District)76Yes 33 45A-Al I/Naperville Senior Housing Opco, Llc922Private Rooms / Semi-Private Rooms
The Springs at Monarch Landing
AL

Assisted Living A licensed, long-term care setting for seniors or individuals with disabilities who need help with daily activities — like bathing, dressing, and medication management — but not 24-hour skilled nursing. Offers housing, meals, and around-the-clock support while aiming to maximize resident independence.

MC

Memory Care Secured, specialized care for people living with Alzheimer's or dementia. Staff trained in cognitive impairment, with higher staff-to-resident ratios and an environment designed to reduce confusion and wandering risk.

NH

Nursing Home Licensed facility providing 24/7 skilled nursing care for residents with complex, ongoing medical needs. Staffed by RNs, LPNs, and CNAs. Inspected and star-rated annually by CMS. Accepts Medicare (short-term rehab) and Medicaid (long-term care).

Naperville (Naperville Park District)28Yes 27 1-Monarch Landing Opco (Sl-Vii) Llc301Private Rooms / Semi-Private Rooms

Financial Assistance for
Assisted Living in Illinois

Get Financial aid guidance

Community Care Program

Illinois CCP

Age 60+
General Illinois resident, at risk of nursing home placement.
Income Limits (2025) ~$1,215/month individual
Asset Limits $17,500 individual, excludes home, car
IL

High demand in urban areas; waitlists possible.

Benefits
In-home care (3-5 hours/day) Adult day services ($65/day) Emergency home response systems ($30/month)

Illinois Respite Program

IL Respite (via NFCSP)

Age Caregiver of someone 60+ (or with dementia)
General Illinois resident.
Income Limits No strict limit; prioritizes low-income.
Asset Limits Not applicable.
IL

Limited slots; urban/rural balance.

Benefits
In-home respite (4-6 hours/day) Adult day care (~$65/day) Short-term facility care (up to 5 days)

Supportive Living Program (SLP)

Illinois Medicaid Supportive Living Program

Age 65+ or 22-64 with disability
General Illinois resident, Medicaid-eligible, needs moderate assistance (not nursing home-level).
Income Limits (2025) ~$2,829/month (300% FBR, individual); QIT allowed.
Asset Limits $2,000 (individual), $3,000 (couple) (excludes home, car).
IL

~200 SLP sites statewide; room/board not covered.

Benefits
Personal care (5-7 hours/day, e.g., bathing, mobility) Meals Housekeeping Medication management Respite (~240 hours/year)

Persons Who Are Elderly Waiver

Illinois Medicaid Elderly Waiver

Age 65+
General Illinois resident, Medicaid-eligible, nursing home-level care need.
Income Limits (2025) ~$2,829/month 300% FBR, individual
Asset Limits $2,000 (individual), $3,000 (couple).
IL

Part of HealthChoice Illinois; consumer-directed options available.

Benefits
Personal care (5-7 hours/day, e.g., dressing, eating) Homemaker Adult day care (~$60/day) Respite (240 hours/year) Home mods ($1,000 avg.)

Medicare Savings Program (MSP)

Illinois Medicare Savings Program

Age 65+ or disabled
General Illinois resident, Medicare Part A/B.
Income Limits (2025) ~$2,510/month (QMB), ~$3,380/month (SLMB), ~$3,598/month (QI)—individual.
Asset Limits $9,430 (individual), $14,130 (couple).
IL

Three tiers; no waitlist.

Benefits
Covers Part B premiums ($174.70/month) Deductibles ($240/year) Copays (~20%)

Senior Community Service Employment Program (SCSEP)

Illinois SCSEP

Age 55+
General unemployed, low-income, Illinois resident.
Income Limits (2025) ~$1,983/month 125% FPL
Asset Limits Not specified; income-focused.
IL

Priority for veterans, rural residents.

Benefits
Paid training (~20 hours/week at ~$7.25/hour) Job placement

Optional State Supplementation (OSS)

Illinois Optional State Supplementation

Age 65+ or disabled
General Illinois resident, in approved facility, SSI recipient or low-income.
Income Limits (2025) ~$1,004/month including SSI
Asset Limits $2,000 (individual), $3,000 (couple).
IL

~$50-$500/month based on facility type.

Benefits
Cash (~$50-$500/month) for room/board in personal care homes or SLFs

VA Aid and Attendance (A&A) and Housebound Benefits

Illinois VA Aid and Attendance/Housebound

Age 65+ or disabled veteran/spouse
General Illinois resident, wartime service, need for ADL help (A&A) or homebound.
Income Limits (2025) Net income < ~$1,984/month (veteran with dependent, A&A); pension offsets income.
Asset Limits ~$155,356 net worth limit
IL

High veteran demand in urban/rural areas.

Benefits
Cash (~$1,433-$2,642/month veteran, ~$951-$1,318 spouse) for care costs (e.g., in-home, assisted living)

Places of interest near The Springs at Monarch Landing

Address 6.9 miles from city center Info Estimated distance in miles from Naperville's city center to The Springs at Monarch Landing's address, calculated via Google Maps. — 4.34 miles to nearest hospital (Endeavor Health Edward Hospital)

Calculate Travel Distance to The Springs at Monarch Landing

Add your location

Address

Staffing Data (Q2 2025)

This data corresponds to Q2 2025 and is based on CMS Payroll-Based Journal.

Total staff 174
Employees 164
Contractors 10
Staff to resident ratio 2.42:1
27% better than Illinois average

Illinois average ratio: 1.90:1

Avg staff/day 70
Average shift 8.2 hours
8% better than Illinois average

Illinois average: 7.6 hours

Total staff hours (quarter) 52,137
Nursing staff breakdown
Registered Nurse

Manages medical care and health needs.

Total count 26
Average shift length Info Average shift length. Calculated as total hours divided by days worked and average staff per day. 9.4 hours

This role is partially covered by contractors.

Licensed Practical Nurse

Assists with medical care and medications.

Total count 23
Average shift length Info Average shift length. Calculated as total hours divided by days worked and average staff per day. 9.3 hours

This role is partially covered by contractors.

Certified Nursing Assistant

Helps with daily care and mobility.

Total count 83
Average shift length Info Average shift length. Calculated as total hours divided by days worked and average staff per day. 8.2 hours

This role is partially covered by contractors.

Contractor staffing

Total hours from contractors

3.4%

1,786 contractor hours this quarter

Certified Nursing Assistant: 4 Licensed Practical Nurse: 4 Registered Nurse: 1 Feeding Assistant: 1
Staff by category
Certified Nursing Assistant7948325,43991100%8.2
Registered Nurse251269,43691100%9.4
Licensed Practical Nurse194235,22391100%9.3
Clinical Nurse Specialist8082,7127380%7.9
Other Dietary Services Staff4041,5019099%7.9
Speech Language Pathologist4041,3887785%7
Dental Services Staff2029666470%8.1
Physical Therapy Aide4049317279%7.1
RN Director of Nursing2026485459%8
Physical Therapy Assistant4045858290%6.3
Respiratory Therapy Technician3035768391%6.1
Feeding Assistant0115126470%8
Mental Health Service Worker1015126470%8
Qualified Social Worker3035106470%5.5
Dietitian1014886167%8
Administrator1014085156%8
Nurse Practitioner1012075257%4
Occupational Therapy Aide202902224%4.1
Medical Director101633%2
83 Certified Nursing Assistant
% of Days 100%
26 Registered Nurse
% of Days 100%
23 Licensed Practical Nurse
% of Days 100%
8 Clinical Nurse Specialist
% of Days 80%
4 Other Dietary Services Staff
% of Days 99%
4 Speech Language Pathologist
% of Days 85%
2 Dental Services Staff
% of Days 70%
4 Physical Therapy Aide
% of Days 79%
2 RN Director of Nursing
% of Days 59%
4 Physical Therapy Assistant
% of Days 90%
3 Respiratory Therapy Technician
% of Days 91%
1 Feeding Assistant
% of Days 70%
1 Mental Health Service Worker
% of Days 70%
3 Qualified Social Worker
% of Days 70%
1 Dietitian
% of Days 67%
1 Administrator
% of Days 56%
1 Nurse Practitioner
% of Days 57%
2 Occupational Therapy Aide
% of Days 24%
1 Medical Director
% of Days 3%

Facility Characteristics

Source: CMS Long-Term Care Facility Characteristics (Data as of Jan 2026)

Total residents 72
Medicare
9
12.5% of residents
Medicaid
56
77.8% of residents
Private pay or other
7
9.7% of residents
Programs & Services
Residents Group

Residents meet regularly to discuss policies, care quality, and activities

CCRC

Part of a Continuing Care Retirement Community offering multiple care levels

Active Resident Council

Organized group of residents that meets regularly to discuss facility policies, quality of life, and activities.

Quality of care over time

These measures show how residents usually do over time at this home, based on health outcomes and preventive care.

High-risk clinical events score Info A composite score based on pressure ulcers, falls with injury, weight loss, walking ability decline, and activities of daily living decline. 7.0
28% better than Illinois average

Illinois average: 9.7

Functional decline score Info A composite score based on activities of daily living decline, walking ability decline, and incontinence. 19.9
7% worse than Illinois average

Illinois average: 18.6

Long-stay resident measures
Significantly above average Illinois avg: 3.6 Info CMS star rating based on long-stay quality measure performance. 5 stars = significantly above average, 1 star = significantly below average.
Need for Help with Daily Activities Increased Info Percent of long-stay residents whose need for help with daily activities has increased 16.1%
In line with Illinois average

Illinois average: 15.5%

Walking Ability Worsened Info Percent of long-stay residents whose ability to move independently worsened 11.2%
39% better than Illinois average

Illinois average: 18.4%

Low Risk Residents with Bowel/Bladder Incontinence Info Percent of low risk long-stay residents who lose control of their bowels or bladder 32.3%
49% worse than Illinois average

Illinois average: 21.6%

Falls with Major Injury Info Percent of long-stay residents experiencing one or more falls with major injury 2.6%
21% better than Illinois average

Illinois average: 3.4%

High Risk Residents with Pressure Ulcers Info Percent of long-stay high risk residents with pressure ulcers 2.2%
58% better than Illinois average

Illinois average: 5.3%

Urinary Tract Infection Info Percent of long-stay residents with a urinary tract infection 0.5%
75% better than Illinois average

Illinois average: 1.8%

Lost Too Much Weight Info Percent of long-stay residents who lose too much weight 2.9%
56% better than Illinois average

Illinois average: 6.5%

Depressive Symptoms Info Percent of long-stay residents who have depressive symptoms 0.0%
100% better than Illinois average

Illinois average: 48.1%

Antipsychotic Use Info Percent of long-stay residents who received an antipsychotic medication 9.7%
52% better than Illinois average

Illinois average: 20.2%

Pneumococcal Vaccine Info Percent of long-stay residents assessed and appropriately given the pneumococcal vaccine 100.0%
12% better than Illinois average

Illinois average: 89.2%

Influenza Vaccine Info Percent of long-stay residents assessed and appropriately given the seasonal influenza vaccine 100.0%
9% better than Illinois average

Illinois average: 91.6%

Hospitalizations per 1,000 days Info Number of hospitalizations per 1,000 long-stay resident days. 2.37
16% worse than Illinois average

Illinois average: 2.04

ED visits per 1,000 days Info Number of outpatient emergency department visits per 1,000 long-stay resident days. 1.49
34% better than Illinois average

Illinois average: 2.25

Short-stay resident measures
Above average Illinois avg: 2.3 Info CMS star rating based on short-stay quality measure performance. 5 stars = much above average, 1 star = much below average.
Pneumococcal Vaccine Info Percent of short-stay residents assessed and appropriately given the pneumococcal vaccine 98.8%
45% better than Illinois average

Illinois average: 68.3%

Antipsychotic medication increase Info Percent of short-stay residents who newly received an antipsychotic medication 0.6%
74% better than Illinois average

Illinois average: 2.3%

Influenza Vaccine Info Percent of short-stay residents assessed and appropriately given the seasonal influenza vaccine 100.0%
59% better than Illinois average

Illinois average: 63.0%

Re-hospitalized after SNF stay Info Percentage of short-stay residents who were re-hospitalized after their nursing home admission. 24.1%
8% better than Illinois average

Illinois average: 26.2%

Emergency department visits Info Percentage of short-stay residents who had an outpatient emergency department visit. 11.3%
19% better than Illinois average

Illinois average: 14.0%

Falls with major injury Info Percentage of SNF residents who experience falls with major injury during their stay. 0.0%
100% better than Illinois average

Illinois average: 0.8%

Ability to care for self at discharge Info Percentage of residents at or above expected ability to care for themselves at discharge. 52.6%
In line with Illinois average

Illinois average: 53.7%

Successful return to home or community Info Rate of successful return to home or community from a skilled nursing facility. 68.1%
35% better than Illinois average

Illinois average: 50.6%

Guides for Better Senior Living

Care Cost Calculator: See Prices in Your Area

Nursing Home Data Explorer

Don’t Wait Too Long: 7 Red Flag Signs Your Parent Needs Assisted Living Now

The True Cost of Assisted Living in 2025 – And How Families Are Paying For It

Understanding Senior Living Costs: Pricing Models, Discounts & Financial Assistance

Explore Open Rooms
1 Contact details
2 What type of senior care service are you looking for?
3 What budget do you have in mind for senior care?
4 How soon do you need to find care?
5 Additional details

Thank you for your interest!

Our team will be in touch shortly to help with next steps.