


Aldersgate
Nursing Home, Assisted Living, Hospice Care, Independent Living, Memory Care, Respite Care & Skilled Nursing · Charlotte, NC
Aldersgate
Nursing Home, Assisted Living, Hospice Care, Independent Living, Memory Care, Respite Care & Skilled Nursing · Charlotte, NC
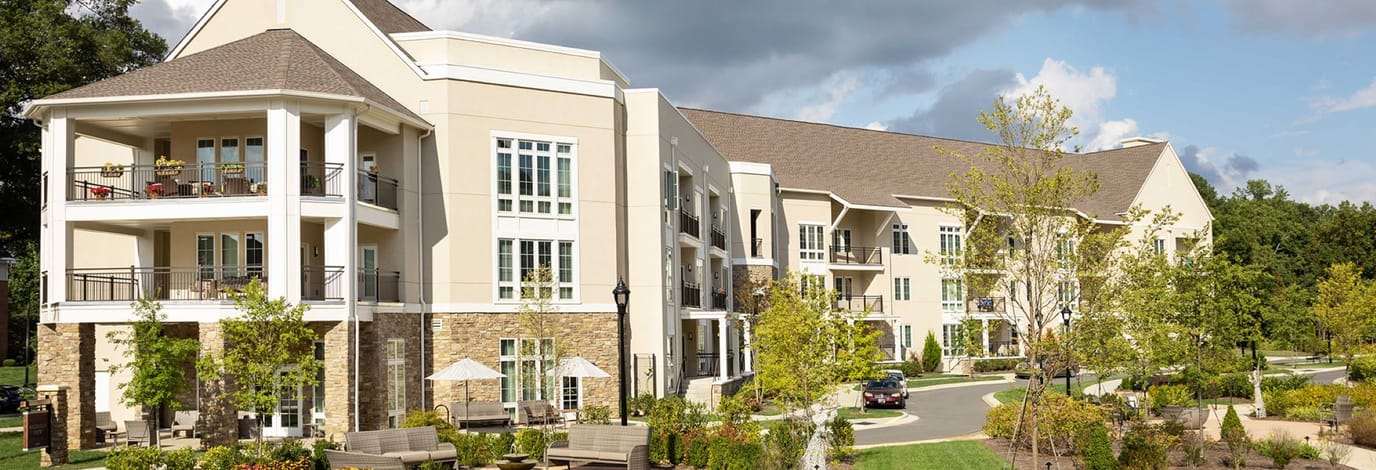
Situated along Shamrock Drive, Givens Aldersgate is a life plan community in Charlotte, NC, that offers assisted living, memory care, and skilled nursing. With a 230-acre campus, this 120-bed community provides a variety of accommodations, including private suites for those living with Alzheimer’s and dementia. Daily housekeeping, personal laundry, chef-prepared meals, and personal transportation are also provided to enrich residents’ living experiences. Nursing assistance is also available 24/7, along with physician services, to ensure accessibility of care at all times.
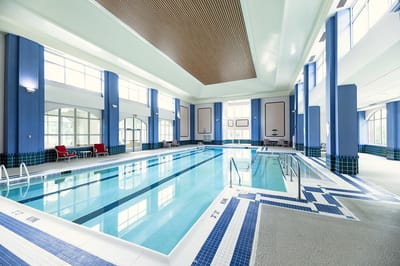
Enrichment activities, gardening, and spiritual support promote holistic wellness and encourage residents to live actively. Physical & speech therapy, as well as medication management, are also provided for residents’ welfare. Its location is also relatively walkable, with a walkability score of 40, indicating that some services can be reached on foot. Currently, the community has 93.8% occupancy, with an average length of stay of 50 days.
Walk Score: 40 / 100 Rank #226 / 573Walk Score — State benchmarkedThis home is ranked 226th out of 573 homes in North Carolina for walk score. Shows how walkable this facility's neighborhood is compared to the average walk score across North Carolina facilities. Higher scores benefit residents, families, and staff.Facilities with the same value for a metric share the same rank. Rankings are based only on facilities in North Carolina that report data for that category. Facilities without available data are excluded from the ranking.Click the rank badge to see the full State ranking.Click here to see the full State ranking.
Somewhat walkable. A few nearby services may be reachable on foot, but most trips require transportation.
BBB Rating: A+ (Not Accredited)
An independent rating from the Better Business Bureau based on factors such as complaint history, transparency, and business practices.
How BBB ratings work
How BBB ratings work
Staffing
Key information about the people who lead and staff this community.
ContactMr. Joseph P. Snyder, President (per BBB, record updated Jun 2026)
Inspection History
In North Carolina, the Department of Health and Human Services, Division of Health Service Regulation conducts unannounced surveys to ensure nursing and adult care homes meet safety standards.
Since 2023 · 3 years of data
20 deficiencies
0 penalties
Inspection Scorecard
 This scorecard compares key inspection, deficiency, and complaint metrics at this facility against the North Carolina state average. Metrics rated ≥15% worse than average are highlighted in red; those ≥15% better are highlighted in green.
Since 2023 vs. North Carolina state average
Overall vs. NC average
0 Worse
No metrics in this bucket.
1 Better
Metrics better than North Carolina average:
• Total deficiencies (57% below)
• Total deficiencies (57% below)
Deficiencies
| This Facility | NC Average | vs. NC Avg |
|---|---|---|---|
|
Total deficiencies
| 20 | 46 | This facility has 57% fewer total deficiencies than a typical North Carolina nursing home (20 vs. NC avg 46).↓ 57% better |
Inspection Reports Summary
An editor-reviewed summary of the themes and findings across this facility's recent inspection reports.
- October 16, 2024 inspection found 7 deficiencies including immediate jeopardy for nurse incompetency in disinfecting glucometers and failures in infection control, medication storage, and resident care planning.
- September 30, 2025 complaint investigation substantiated unsafe mechanical lift transfers causing a resident’s left distal femur fracture and multiple failures in dignified dining, abuse reporting, medication, and food safety.
- June 8, 2023 annual inspection cited 7 deficiencies related to communication barriers, unresolved food service grievances, inaccurate assessments, incomplete care plans, and expired food storage.
What does this home offer?
Room Sizes: 1,548 / 1,598 / 1,650 / 1,740 / 1,867 / 1,880 / 1,935 / 2,035 / 2,158 sq. ft
Housing Options: 1 Bed / 2 Bed
Building Type: 3-story
Places of interest near Aldersgate
![]() 4.1 miles from city center
4.1 miles from city center
![]() Estimated distance in miles from Charlotte's city center to Aldersgate's address, calculated via Google Maps.
Estimated distance in miles from Charlotte's city center to Aldersgate's address, calculated via Google Maps.
Calculate Travel Distance to Aldersgate
Add your location
Compare Nursing Homes around Charlotte
The information below is reported by the North Carolina Department of Health and Human Services, Division of Health Service Regulation.
| Brookdale Carriage Club Providence | NH AL IL MC SNF | Charlotte (Olde Providence North) | 77
Facility
77
NC AVG
72
Rank
#166 / 388 | - | - | 8.12
Facility
8.12
NC AVG
3.98
Rank
#4 / 97 | +78% | +104% | $0
Facility
$0
NC AVG
$74.6k
Rank
#1 / 105 | 11
Facility
11
NC AVG
20.9
Rank
#39 / 101 | 3.7
Facility
3.7
NC AVG
5.0
Rank
#43 / 101 | - | 7 | A+ |
12
Facility
12
NC AVG
33
Rank
#441 / 573 | Bkd Fm Holding Company LLC | $19.6MFiscal year ending 12/2023
Facility
$19.6MFiscal year ending 12/2023
NC AVG
$13.2M
Rank
#100 / 104 | $8.1MFiscal year ending 12/2023
Facility
$8.1MFiscal year ending 12/2023
NC AVG
$4.9M
Rank
#39 / 104 | 41.6%Fiscal year ending 12/2023
Facility
41.6%Fiscal year ending 12/2023
NC AVG
39.8%
Rank
#1 / 104 | 345482 | ||||
| The Sharon at SouthPark | NH AL IL MC SNF | Charlotte (Beverly Woods) | 19
Facility
19
NC AVG
72
Rank
#334 / 388 |
25.3%
Facility
25.3%
NC AVG
68
Rank
#220 / 240 | -63% | - | - | - | $0
Facility
$0
NC AVG
$74.6k
Rank
#1 / 105 | 10
Facility
10
NC AVG
20.9
Rank
#37 / 101 | 5.0
Facility
5.0
NC AVG
5.0
Rank
#67 / 101 | - | 5 | - |
49
Facility
49
NC AVG
33
Rank
#162 / 573 | Katherine Richards | $10.6MFiscal year ending 12/2023
Facility
$10.6MFiscal year ending 12/2023
NC AVG
$13.2M
Rank
#12 / 104 | $13.4MFiscal year ending 12/2023
Facility
$13.4MFiscal year ending 12/2023
NC AVG
$4.9M
Rank
#16 / 104 | 127%Fiscal year ending 12/2023
Facility
127%Fiscal year ending 12/2023
NC AVG
39.8%
Rank
#80 / 104 | 345564 | ||||
| Briar Creek Health Center at The Barclay at SouthPark | NH AL IL MC RC SNF | S Charlotte (Beverly Woods) | 6
Facility
6
NC AVG
72
Rank
#336 / 388 |
66.7%
Facility
66.7%
NC AVG
68
Rank
#142 / 240 | -2% | - | -26% | - | $8.6k
Facility
$8.6k
NC AVG
$74.6k
Rank
#56 / 105 | 8
Facility
8
NC AVG
20.9
Rank
#31 / 101 | 2.7
Facility
2.7
NC AVG
5.0
Rank
#29 / 101 | 2 | 4 | - |
30
Facility
30
NC AVG
33
Rank
#309 / 573 | Charlotte Sp Senior Housing Jv Opco, LLC | $19.6MFiscal year ending 09/2023
Facility
$19.6MFiscal year ending 09/2023
NC AVG
$13.2M
Rank
#30 / 104 | $9.5MFiscal year ending 09/2023
Facility
$9.5MFiscal year ending 09/2023
NC AVG
$4.9M
Rank
#29 / 104 | 48.5%Fiscal year ending 09/2023
Facility
48.5%Fiscal year ending 09/2023
NC AVG
39.8%
Rank
#50 / 104 | 345578 | ||||
| Peak Resources Charlotte | NH AL HOS IL MC RC SNF | Charlotte (Country Club Heights) | 142
Facility
142
NC AVG
72
Rank
#15 / 388 |
84.1%
Facility
84.1%
NC AVG
68
Rank
#80 / 240 | +24% | 3.17
Facility
3.17
NC AVG
3.98
Rank
#89 / 97 | -62% | -20% | $14.1k
Facility
$14.1k
NC AVG
$74.6k
Rank
#61 / 105 | 23
Facility
23
NC AVG
20.9
Rank
#72 / 101 | 3.8
Facility
3.8
NC AVG
5.0
Rank
#46 / 101 | 5 | 119 | - |
64
Facility
64
NC AVG
33
Rank
#46 / 573 | Peak Resources Inc | $13.1MFiscal year ending 09/2023
Facility
$13.1MFiscal year ending 09/2023
NC AVG
$13.2M
Rank
#72 / 104 | $4.8MFiscal year ending 09/2023
Facility
$4.8MFiscal year ending 09/2023
NC AVG
$4.9M
Rank
#90 / 104 | 36.5%Fiscal year ending 09/2023
Facility
36.5%Fiscal year ending 09/2023
NC AVG
39.8%
Rank
#79 / 104 | 345013 |
Financial Assistance for
Nursing Home in North Carolina
Aldersgate is located in Charlotte, North Carolina.
Here are the financial assistance programs available to residents in North Carolina.
Frequently Asked Questions about Aldersgate
What neighborhood is Aldersgate in?
Aldersgate is in the Windsor Park neighborhood of Charlotte.
Is Aldersgate in a walkable area?
Aldersgate has a walk score of 40. Somewhat walkable. A few nearby services may be reachable on foot, but most trips require transportation.
Are pets allowed at Aldersgate?
No, Aldersgate has a no-pet policy.
Are there photos of Aldersgate?
Yes — there are 4 photos of Aldersgate in the photo gallery on this page.
What is the address of Aldersgate?
Aldersgate is located at 3800 Shamrock Dr, Charlotte, NC 28215.
What is the phone number of Aldersgate?
(704) 532-7000 will put you in contact with the team at Aldersgate.
Is Aldersgate Medicare or Medicaid certified?
Aldersgate is not currently listed as a CMS-certified provider of Medicare or Medicaid.
Guides for Better Senior Living
Care Cost Calculator: See Prices in Your Area
Nursing Home Data Explorer
Don’t Wait Too Long: 7 Red Flag Signs Your Parent Needs Assisted Living Now
The True Cost of Assisted Living in 2025 – And How Families Are Paying For It
Understanding Senior Living Costs: Pricing Models, Discounts & Financial Assistance
Updated on
