


Total staff
105
Employees
86
Contractors
19
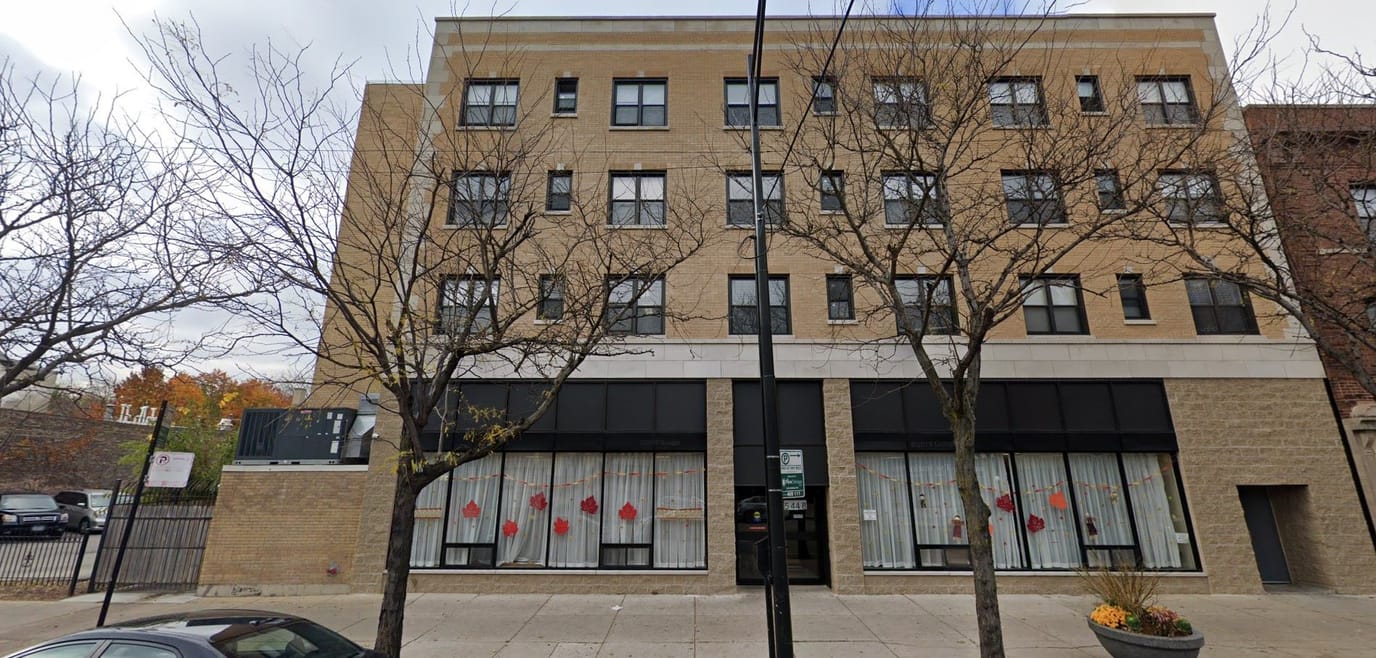
Located in Chicago’s Edgewater neighborhood, All American Village Nursing and Rehabilitation Center provides skilled nursing and rehabilitation services for adults aged 21 and older. The 144-bed community also accepts Medicare, Medicaid, and private-pay residents, offering multiple options for covering the cost of care.
Clinical services include around-the-clock staffing, rehabilitation therapies, comprehensive nursing care, diabetes management, dietary support, and psychiatric services. Residents receive an average of 1 hour and 31 minutes of nursing care per day. Alongside healthcare support, the community offers chef-prepared meals with family-style dining and a variety of social activities, including movies, musical events, celebrations, and organized outings.
Occupancy is approximately 95%, reflecting strong demand for available beds. Residents stay an average of 394 days, indicating that many individuals rely on the community for long-term care rather than short-term rehabilitation alone.
The surrounding area has a Walk Score of 95, placing it in the “Walker’s Paradise” category. Many shops, services, and daily destinations can be reached on foot, providing added convenience for visitors and mobile older adults.
Staffing hours
![]() Daily nursing hours per resident by staff type, reported to CMS. Higher is generally better — compare this facility to state and national averages to see where staffing stands.
Daily nursing hours per resident by staff type, reported to CMS. Higher is generally better — compare this facility to state and national averages to see where staffing stands.
Hours per resident per day vs Illinois averages
Total nursing care
![]() This home is ranked 155th out of 155 homes in Illinois for nurse hours. Total adjusted nursing hours per resident per day, combining RN, LPN, and aide time. CMS adjusts this for case-mix so facilities can be fairly compared.
This home is ranked 155th out of 155 homes in Illinois for nurse hours. Total adjusted nursing hours per resident per day, combining RN, LPN, and aide time. CMS adjusts this for case-mix so facilities can be fairly compared.
1h 31m
51% below state avg5 of 6 metrics below state avg
Reporting period: October 1 – December 31, 2025 (Q4 2025). Source: CMS Payroll-Based Journal report.
Manages medical care and health needs.
Assists with medical care and medications.
Helps with daily care and mobility.
Total hours from contractors
1,307 contractor hours this quarter
| Certified Nursing Assistant | 41 | 0 | 41 | 17,364 | 92 | 100% | 7.7 |
| Licensed Practical Nurse | 20 | 0 | 20 | 8,050 | 92 | 100% | 7.9 |
| Registered Nurse | 4 | 0 | 4 | 2,046 | 92 | 100% | 8.4 |
| RN Director of Nursing | 3 | 0 | 3 | 1,339 | 81 | 88% | 7.3 |
| Mental Health Service Worker | 5 | 1 | 6 | 1,077 | 83 | 90% | 7.5 |
| Other Dietary Services Staff | 2 | 0 | 2 | 1,030 | 91 | 99% | 7.9 |
| Clinical Nurse Specialist | 2 | 1 | 3 | 629 | 64 | 70% | 7 |
| Dietitian | 1 | 0 | 1 | 512 | 64 | 70% | 8 |
| Diagnostic X-ray Services Staff | 6 | 0 | 6 | 484 | 60 | 65% | 6.9 |
| Physical Therapy Aide | 0 | 2 | 2 | 480 | 68 | 74% | 7.1 |
| Nurse Practitioner | 1 | 0 | 1 | 473 | 63 | 68% | 7.5 |
| Administrator | 1 | 0 | 1 | 405 | 54 | 59% | 7.5 |
| Respiratory Therapy Technician | 0 | 5 | 5 | 311 | 37 | 40% | 8.1 |
| Physical Therapy Assistant | 0 | 3 | 3 | 179 | 32 | 35% | 5.6 |
| Speech Language Pathologist | 0 | 2 | 2 | 126 | 30 | 33% | 4.2 |
| Qualified Social Worker | 0 | 1 | 1 | 83 | 35 | 38% | 2.4 |
| Occupational Therapy Assistant | 0 | 1 | 1 | 48 | 6 | 7% | 8 |
| Medical Director | 0 | 2 | 2 | 36 | 3 | 3% | 6 |
| Other Physician | 0 | 1 | 1 | 30 | 12 | 13% | 2.5 |
Federal penalties imposed by CMS for regulatory violations, including civil money penalties (fines) and denials of payment for new Medicare/Medicaid admissions.
Source: CMS Penalties Database
No penalties in the past 3 years
No civil money penalties or payment denials were reported in the last 3 years.
These measures show how residents usually do over time at this home, based on health outcomes and preventive care.
Illinois average: 9.7
Illinois average: 18.6
Illinois average: 15.5%
Illinois average: 18.4%
Illinois average: 21.6%
Illinois average: 3.4%
Illinois average: 5.3%
Illinois average: 1.8%
Illinois average: 6.5%
Illinois average: 48.1%
Illinois average: 20.2%
Illinois average: 89.2%
Illinois average: 91.6%
Illinois average: 2.05
Illinois average: 2.25
Illinois average: 68.3%
Illinois average: 26.2%
Illinois average: 14.0%
Illinois average: 0.8%
Quality measures are calculated from Minimum Data Set (MDS) assessments. For most measures, lower percentages indicate better care quality.
4% of new residents, usually for short-term rehab.
2% of new residents, often for short stays.
95% of new residents, often for long-term daily care.
Source: CMS Long-Term Care Facility Characteristics (Data as of Jan 2026)
Residents meet regularly to discuss policies, care quality, and activities
Organized group of residents that meets regularly to discuss facility policies, quality of life, and activities.
Data sourced from CMS Long-Term Care Facility Characteristics quarterly report. Payer mix reflects the current resident census by primary payment source.
Historical financial and operational data for All American Village Nursing and Rehabilitation Center from 2023, based on CMS SNF Cost Reports.
Key figures below are for fiscal year ending in 12/2023.
Based on CMS SNF Cost Report for fiscal year ending in 12/2023.
Most residents stay for extended periods and receive ongoing daily care.
Most new residents arrive under Medicaid (95% of admissions), and a typical Medicaid stay runs around 1 - 2 years.
Coverage residents most often arrive under.
Coverage residents most often leave under.
![]() 6.9 miles from city center
6.9 miles from city center
![]() Estimated distance in miles from Chicago's city center to All American Village Nursing and Rehabilitation Center's address, calculated via Google Maps.
— 3.48 miles to nearest hospital (Ascension Saint Joseph - Chicago)
Estimated distance in miles from Chicago's city center to All American Village Nursing and Rehabilitation Center's address, calculated via Google Maps.
— 3.48 miles to nearest hospital (Ascension Saint Joseph - Chicago)
Add your location
Info below is compiled from CMS reports & the IL Dept. of Public Health (IDPH), senior community websites & trusted data sources such as Walk Score & BBB.
Communities are listed from highest to lowest based on our ranking methodology.
| Mercy Circle Senior Living | NH AL IL MC SNF | Chicago (Mount Greenwood) | 43
Facility
43
IL AVG
85
Rank
#330 / 419 | - | - | 4.57
Facility
4.57
IL AVG
3.10
Rank
#24 / 155 | -8% | +47% | $0
Facility
$0
IL AVG
$151.3k
Rank
#1 / 155 | 16
Facility
16
IL AVG
36.8
Rank
#24 / 155 | 4.0
Facility
4.0
IL AVG
3.7
Rank
#105 / 155 | - | 22 | - |
44
Facility
44
IL AVG
51
Rank
#392 / 648 | Sisters Of Mercy Of The Americas West Midwest Community Inc | $10.3MFiscal year ending 06/2024
Facility
$10.3MFiscal year ending 06/2024
IL AVG
$12.2M
Rank
#95 / 154 | $5.1MFiscal year ending 06/2024
Facility
$5.1MFiscal year ending 06/2024
IL AVG
$4.8M
Rank
#112 / 154 | 49.8%Fiscal year ending 06/2024
Facility
49.8%Fiscal year ending 06/2024
IL AVG
44.3%
Rank
#105 / 154 | 146174 | ||||
| The Selfhelp Home Senior Living Community | NH AL IL RC SNF | Chicago (Uptown) | 72
Facility
72
IL AVG
85
Rank
#204 / 419 |
81.9%
Facility
81.9%
IL AVG
73
Rank
#63 / 157 | +12% | 5.56
Facility
5.56
IL AVG
3.10
Rank
#8 / 155 | +44% | +79% | $0
Facility
$0
IL AVG
$151.3k
Rank
#1 / 155 | 21
Facility
21
IL AVG
36.8
Rank
#41 / 155 | 5.3
Facility
5.3
IL AVG
3.7
Rank
#138 / 155 | 1 | 59 | A+ |
92
Facility
92
IL AVG
51
Rank
#28 / 648 | Marvin Rubin | $9.3MFiscal year ending 09/2023
Facility
$9.3MFiscal year ending 09/2023
IL AVG
$12.2M
Rank
#76 / 154 | $7.0MFiscal year ending 09/2023
Facility
$7.0MFiscal year ending 09/2023
IL AVG
$4.8M
Rank
#72 / 154 | 75.3%Fiscal year ending 09/2023
Facility
75.3%Fiscal year ending 09/2023
IL AVG
44.3%
Rank
#59 / 154 | 146009 | ||||
| The Clare | NH AL IL MC SNF | Chicago (Rush & Division) | 49
Facility
49
IL AVG
85
Rank
#294 / 419 |
92.2%
Facility
92.2%
IL AVG
73
Rank
#23 / 157 | +26% | 3.69
Facility
3.69
IL AVG
3.10
Rank
#48 / 155 | +61% | +19% | $0
Facility
$0
IL AVG
$151.3k
Rank
#1 / 155 | 13
Facility
13
IL AVG
36.8
Rank
#19 / 155 | 2.6
Facility
2.6
IL AVG
3.7
Rank
#25 / 155 | 1 | 45 | A+ |
100
Facility
100
IL AVG
51
Rank
#1 / 648 | County Of Fulton | $4.4MFiscal year ending 11/2023
Facility
$4.4MFiscal year ending 11/2023
IL AVG
$12.2M
Rank
#147 / 154 | $3.6MFiscal year ending 11/2023
Facility
$3.6MFiscal year ending 11/2023
IL AVG
$4.8M
Rank
#146 / 154 | 81.8%Fiscal year ending 11/2023
Facility
81.8%Fiscal year ending 11/2023
IL AVG
44.3%
Rank
#14 / 154 | 146151 | ||||
| Asbury Gardens | NH HOS MC PC SNF | North Aurora (Airport Road) | 75
Facility
75
IL AVG
85
Rank
#193 / 419 |
76.5%
Facility
76.5%
IL AVG
73
Rank
#78 / 157 | +5% | 4.00
Facility
4.00
IL AVG
3.10
Rank
#41 / 155 | +6% | +29% | $6.4k
Facility
$6.4k
IL AVG
$151.3k
Rank
#66 / 155 | 21
Facility
21
IL AVG
36.8
Rank
#41 / 155 | 3.5
Facility
3.5
IL AVG
3.7
Rank
#72 / 155 | - | 57 | A+ |
38
Facility
38
IL AVG
51
Rank
#434 / 648 | Abraham Diamond | $6.7MFiscal year ending 12/2023
Facility
$6.7MFiscal year ending 12/2023
IL AVG
$12.2M
Rank
#137 / 154 | $3.8MFiscal year ending 12/2023
Facility
$3.8MFiscal year ending 12/2023
IL AVG
$4.8M
Rank
#128 / 154 | 56.5%Fiscal year ending 12/2023
Facility
56.5%Fiscal year ending 12/2023
IL AVG
44.3%
Rank
#28 / 154 | 146170 | ||||
| All American Village Nursing and Rehabilitation Center | NH SNF | Chicago (Edgewater) | 144
Facility
144
IL AVG
85
Rank
#54 / 419 |
95.9%
Facility
95.9%
IL AVG
73
Rank
#9 / 157 | +31% | 1.51
Facility
1.51
IL AVG
3.10
Rank
#155 / 155 | -73% | -51% | $0
Facility
$0
IL AVG
$151.3k
Rank
#1 / 155 | 32
Facility
32
IL AVG
36.8
Rank
#84 / 155 | 3.2
Facility
3.2
IL AVG
3.7
Rank
#54 / 155 | - | 138 | - |
95
Facility
95
IL AVG
51
Rank
#18 / 648 | - | $10.3MFiscal year ending 12/2023
Facility
$10.3MFiscal year ending 12/2023
IL AVG
$12.2M
Rank
#126 / 154 | $6.2MFiscal year ending 12/2023
Facility
$6.2MFiscal year ending 12/2023
IL AVG
$4.8M
Rank
#100 / 154 | 60.5%Fiscal year ending 12/2023
Facility
60.5%Fiscal year ending 12/2023
IL AVG
44.3%
Rank
#34 / 154 | 146198 |
All American Village Nursing and Rehabilitation Center is located in Chicago, Illinois.
Here are the financial assistance programs available to residents in Illinois.
All American Village Nursing and Rehabilitation Center is in the Edgewater neighborhood.
All American Village Nursing and Rehabilitation Center has a walk score of 95. Walker's paradise. Daily errands do not require a car, with many shops and services nearby.
All American Village Nursing and Rehabilitation Center's occupancy is 95.2%.
No, All American Village Nursing and Rehabilitation Center has a no-pet policy.
All American Village Nursing and Rehabilitation Center is registered as a for-profit.
Yes — there is 1 photo of All American Village Nursing and Rehabilitation Center in the photo gallery on this page.
All American Village Nursing and Rehabilitation Center is located at 5448 N Broadway, Chicago, IL 60640.
Care Cost Calculator: See Prices in Your Area
Nursing Home Data Explorer
Don’t Wait Too Long: 7 Red Flag Signs Your Parent Needs Assisted Living Now
The True Cost of Assisted Living in 2025 – And How Families Are Paying For It
Understanding Senior Living Costs: Pricing Models, Discounts & Financial Assistance


