Total health inspections
21
California average 12.5
Last Health inspection on Sep 2025

We arrange tours, appointments, and even moving support so you don’t have to
Thank you for your interest!
Our team will be in touch shortly to help with next steps.


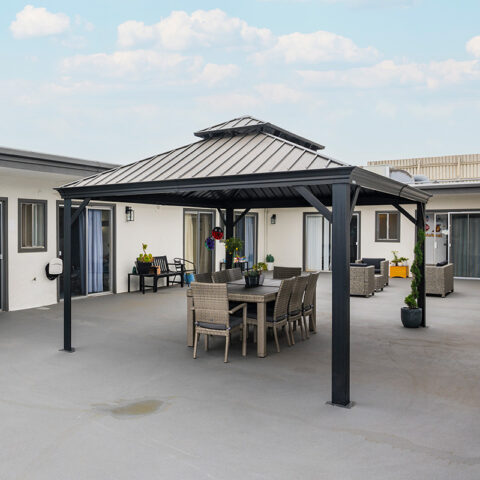
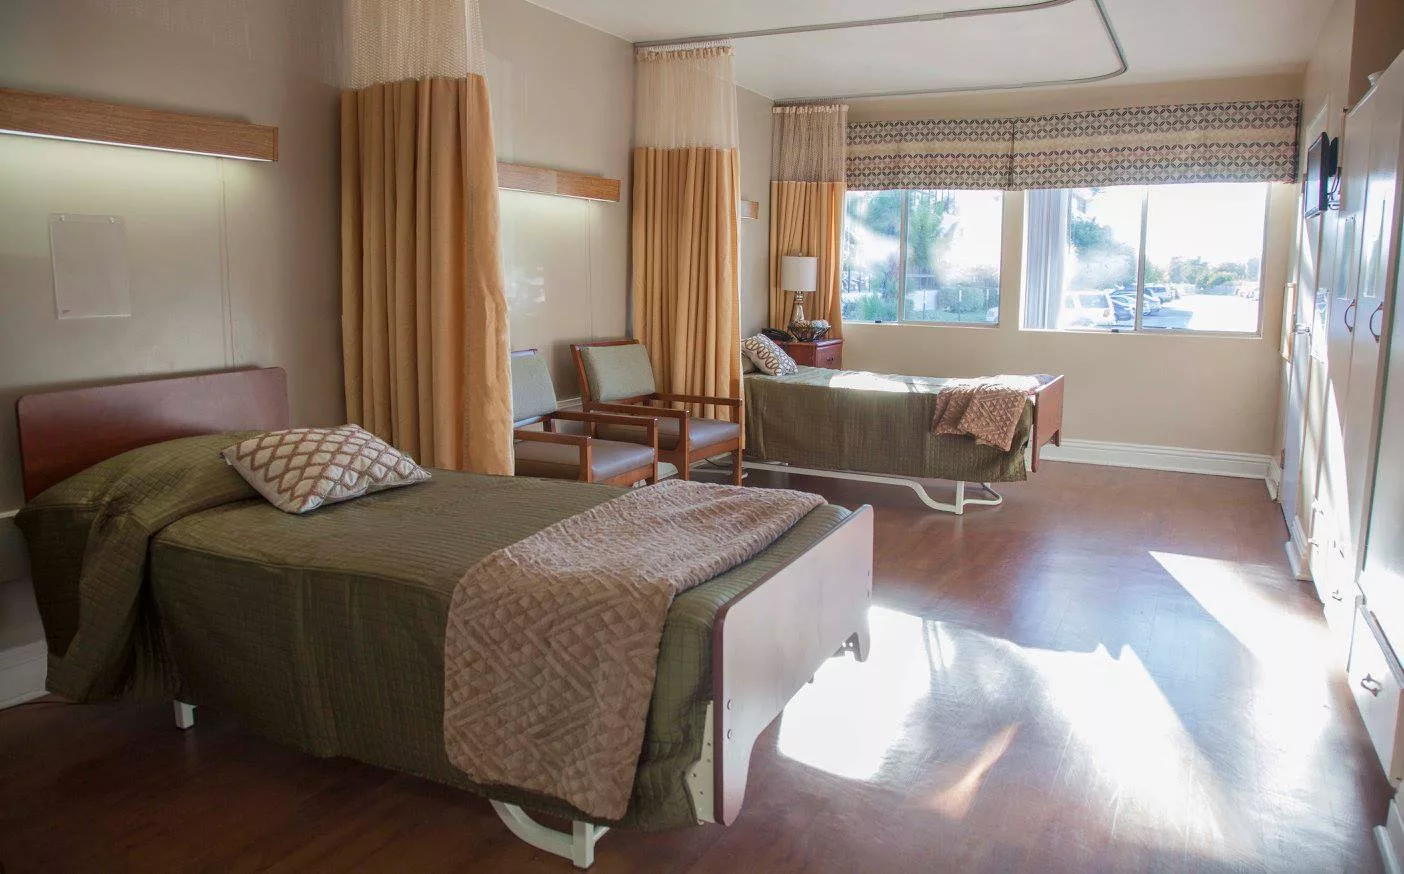

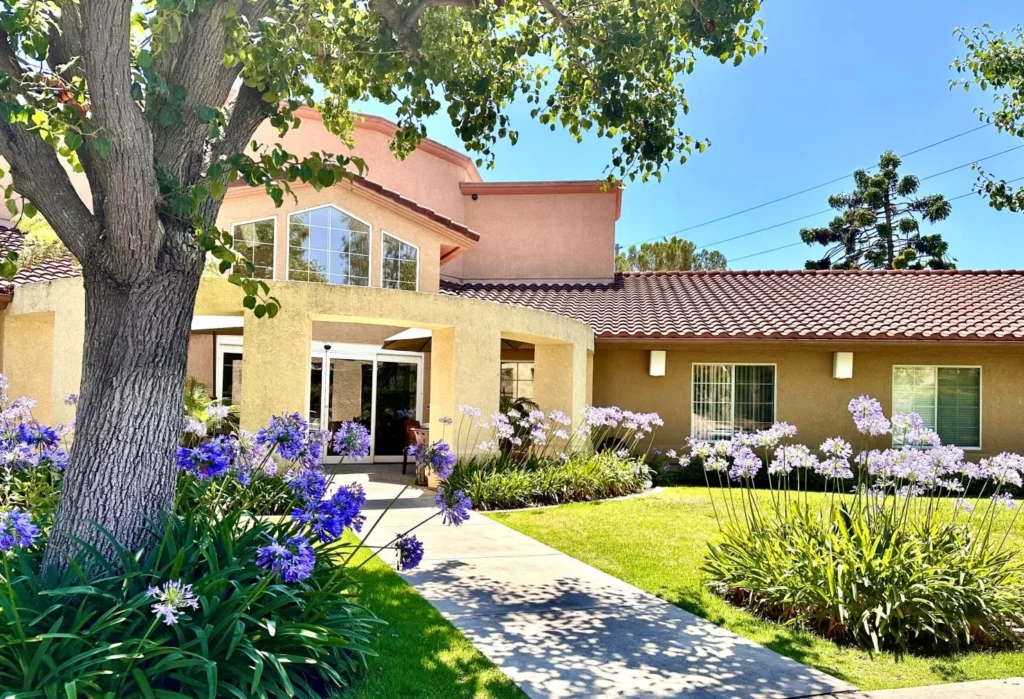
Nestled in Rancho Mission Viejo, California, The Orchards Health Center is an assisted living community thoughtfully woven together with an unwavering commitment to the highest level of care, boundless compassion, and all the comforts of home. They offer round-the-clock skilled nursing care within a beautiful, nurturing setting. The focus at The Orchards is rooted in understanding who their residents are and what they can achieve.
At The Orchards Health Center, their services cater to individuals whose needs go beyond standard assisted care, encompassing those recovering from orthopedic surgeries or injuries, cardiac procedures/diseases, strokes, pulmonary conditions, and other illnesses. The devoted and memory care-trained staff firmly believes in empowering residents’ lives through life-enriching programs, fostering social engagement, and establishing personalized goals. In their view, healthcare extends beyond mental and physical well-being; it’s intricately woven with quality of life.
May provide extensive amenities, services and programs.
Occupancy is moderate, suggesting balanced demand.
This home supports both short-term rehab and long-term care, with residents staying for a wide range of durations.
38% of new residents, usually for short-term rehab.
47% of new residents, often for short stays.
15% of new residents, often for long-term daily care.
California average 12.5
Last Health inspection on Sep 2025
California average 50.2
California average 4.65
Health citations are formal notices following inspections when they fail to comply with safety and care standards.
67 of 110 citations resulted from standard inspections; 35 of 110 resulted from complaint investigations; and 8 of 110 came from combined inspections (standard and complaint).
California average: 0.4
California average: 1
Data sourced from CMS Health Deficiencies reports. Citation severity codes range from A (least serious) to L (most serious). Immediate Jeopardy (J-L) citations indicate situations where the facility's noncompliance has placed residents at risk of death or serious harm.
Nursing Home Licensed facility providing 24/7 skilled nursing care for residents with complex, ongoing medical needs. Staffed by RNs, LPNs, and CNAs. Inspected and star-rated annually by CMS. Accepts Medicare (short-term rehab) and Medicaid (long-term care).
Assisted Living A licensed, long-term care setting for seniors or individuals with disabilities who need help with daily activities — like bathing, dressing, and medication management — but not 24-hour skilled nursing. Offers housing, meals, and around-the-clock support while aiming to maximize resident independence.
Assisted Living A licensed, long-term care setting for seniors or individuals with disabilities who need help with daily activities — like bathing, dressing, and medication management — but not 24-hour skilled nursing. Offers housing, meals, and around-the-clock support while aiming to maximize resident independence.
Nursing Home Licensed facility providing 24/7 skilled nursing care for residents with complex, ongoing medical needs. Staffed by RNs, LPNs, and CNAs. Inspected and star-rated annually by CMS. Accepts Medicare (short-term rehab) and Medicaid (long-term care).
Nursing Home Licensed facility providing 24/7 skilled nursing care for residents with complex, ongoing medical needs. Staffed by RNs, LPNs, and CNAs. Inspected and star-rated annually by CMS. Accepts Medicare (short-term rehab) and Medicaid (long-term care).
Assisted Living A licensed, long-term care setting for seniors or individuals with disabilities who need help with daily activities — like bathing, dressing, and medication management — but not 24-hour skilled nursing. Offers housing, meals, and around-the-clock support while aiming to maximize resident independence.
Nursing Home Licensed facility providing 24/7 skilled nursing care for residents with complex, ongoing medical needs. Staffed by RNs, LPNs, and CNAs. Inspected and star-rated annually by CMS. Accepts Medicare (short-term rehab) and Medicaid (long-term care).
Assisted Living A licensed, long-term care setting for seniors or individuals with disabilities who need help with daily activities — like bathing, dressing, and medication management — but not 24-hour skilled nursing. Offers housing, meals, and around-the-clock support while aiming to maximize resident independence.
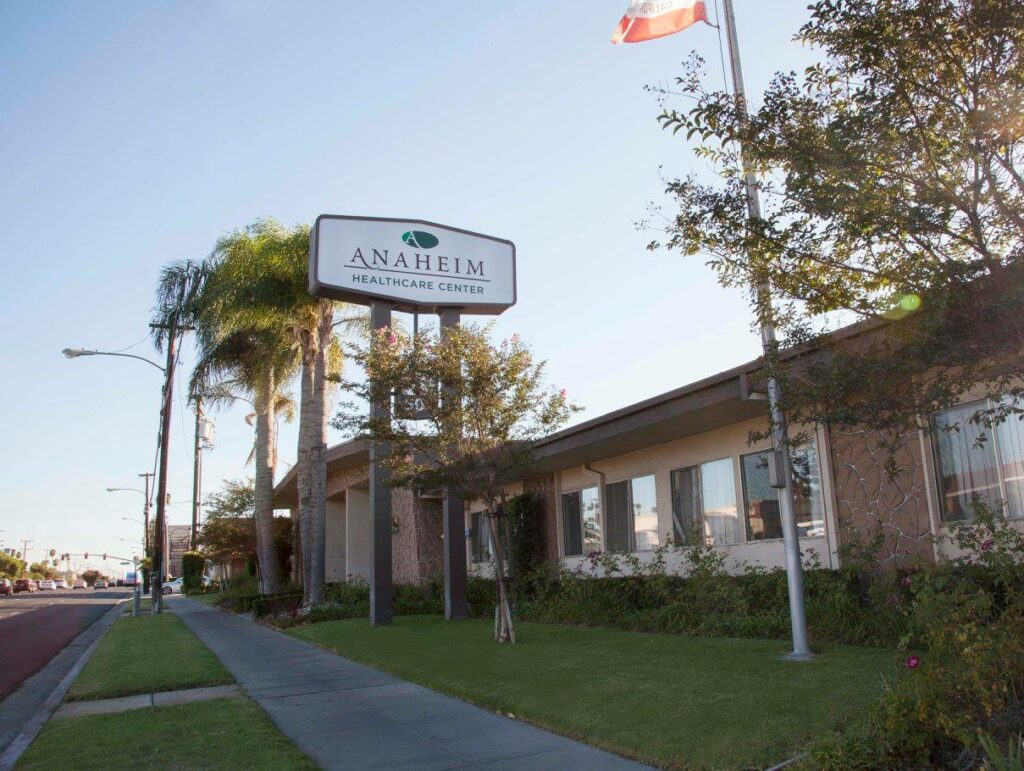
![]() 4.6 miles from city center — 6.05 miles to nearest hospital (Fresenius Medical Care at St Jude Medical Cnter Apheresis)
4.6 miles from city center — 6.05 miles to nearest hospital (Fresenius Medical Care at St Jude Medical Cnter Apheresis)
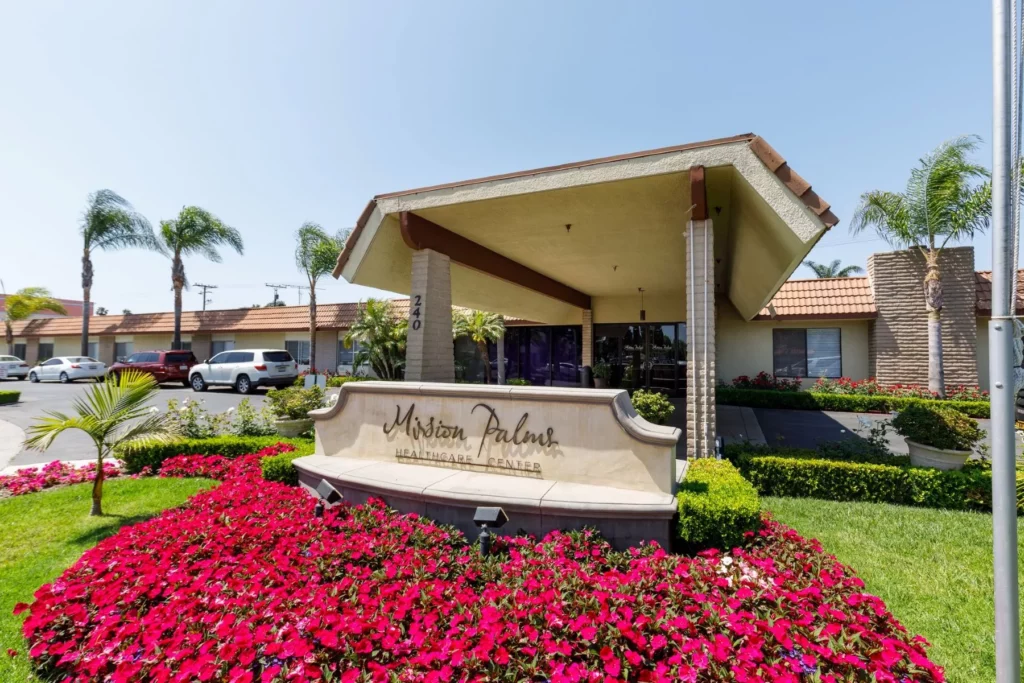
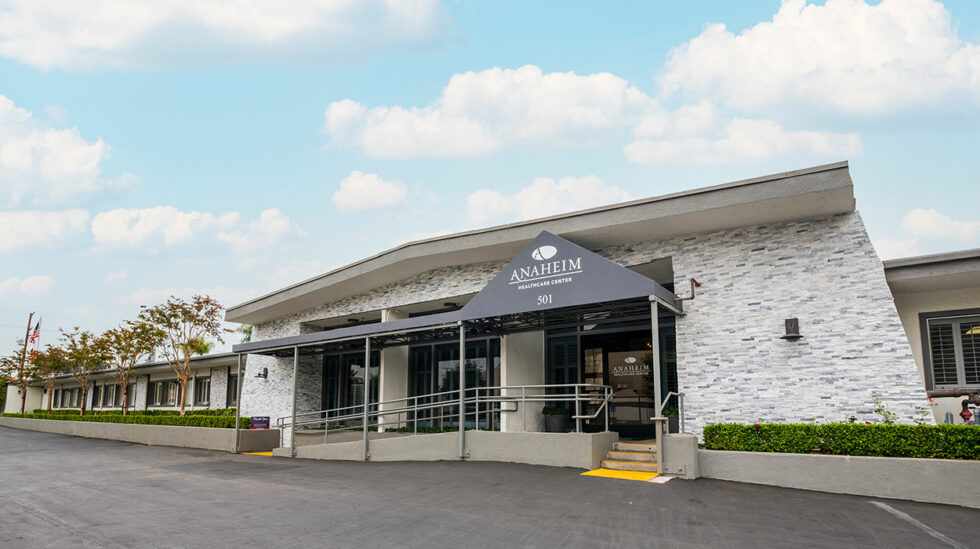
![]() 501 S Beach Blvd, Anaheim, CA 92804
501 S Beach Blvd, Anaheim, CA 92804
Add your location
This data corresponds to Q2 2025 and is based on CMS Payroll-Based Journal.
California average ratio: 0.00:1
California average: 7.7 hours
Manages medical care and health needs.
No contractors work on this role.
Assists with medical care and medications.
No contractors work on this role.
Helps with daily care and mobility.
No contractors work on this role.
Total hours from contractors
84 contractor hours this quarter
| Certified Nursing Assistant | 161 | 0 | 161 | 54,025 | 91 | 100% | 7.3 |
| Licensed Practical Nurse | 71 | 0 | 71 | 25,157 | 91 | 100% | 7.9 |
| Registered Nurse | 19 | 0 | 19 | 6,503 | 91 | 100% | 8.2 |
| Other Dietary Services Staff | 18 | 0 | 18 | 5,579 | 91 | 100% | 7.1 |
| Speech Language Pathologist | 9 | 0 | 9 | 3,666 | 90 | 99% | 7.5 |
| RN Director of Nursing | 8 | 0 | 8 | 2,704 | 68 | 75% | 7.6 |
| Physical Therapy Aide | 6 | 0 | 6 | 2,460 | 91 | 100% | 8 |
| Dental Services Staff | 5 | 0 | 5 | 1,902 | 81 | 89% | 7.9 |
| Physical Therapy Assistant | 5 | 0 | 5 | 1,472 | 79 | 87% | 7.4 |
| Respiratory Therapy Technician | 4 | 0 | 4 | 1,466 | 89 | 98% | 8 |
| Qualified Social Worker | 3 | 0 | 3 | 1,163 | 68 | 75% | 7.8 |
| Clinical Nurse Specialist | 3 | 0 | 3 | 1,118 | 67 | 74% | 7 |
| Nurse Practitioner | 1 | 0 | 1 | 504 | 63 | 69% | 8 |
| Administrator | 1 | 0 | 1 | 500 | 63 | 69% | 7.9 |
| Therapeutic Recreation Specialist | 1 | 0 | 1 | 391 | 55 | 60% | 7.1 |
| Other Physician | 0 | 6 | 6 | 54 | 3 | 3% | 3 |
| Medical Director | 0 | 1 | 1 | 30 | 3 | 3% | 10 |
Source: CMS Long-Term Care Facility Characteristics (Data as of Jan 2026)
Residents meet regularly to discuss policies, care quality, and activities
State-approved Nurse Aide Training and Competency Evaluation Program on-site
Organized group of residents that meets regularly to discuss facility policies, quality of life, and activities.
Data sourced from CMS Long-Term Care Facility Characteristics quarterly report. Payer mix reflects the current resident census by primary payment source.
These measures show how residents usually do over time at this home, based on health outcomes and preventive care.
California average: 6.6
California average: 11.3
California average: 11.1%
California average: 12.0%
California average: 11.3%
California average: 1.7%
California average: 5.0%
California average: 1.2%
California average: 4.2%
California average: 6.7%
California average: 10.1%
California average: 98.5%
California average: 98.2%
California average: 2.25
California average: 1.59
California average: 94.0%
California average: 1.5%
California average: 93.2%
California average: 23.2%
California average: 11.2%
California average: 0.8%
California average: 53.7%
California average: 50.6%
Quality measures are calculated from Minimum Data Set (MDS) assessments. For most measures, lower percentages indicate better care quality.
Federal penalties imposed by CMS for regulatory violations, including civil money penalties (fines) and denials of payment for new Medicare/Medicaid admissions.
Source: CMS Penalties Database (Data as of Jan 2026)
California average: $55K
California average: 2.4
California average: 0.5
Penalties are imposed by CMS for violations of federal nursing home regulations.
Last updated: Jan 2026
Historical financial and operational data for Anaheim Healthcare Center based on CMS SNF Cost Reports.
Loading trend charts...
Care Cost Calculator: See Prices in Your Area
Nursing Home Data Explorer
Don’t Wait Too Long: 7 Red Flag Signs Your Parent Needs Assisted Living Now
The True Cost of Assisted Living in 2025 – And How Families Are Paying For It
Understanding Senior Living Costs: Pricing Models, Discounts & Financial Assistance

Touring a community? Use this expert-backed checklist to stay organized, ask the right questions, and find the perfect fit.
We'll send you a PDF version of the touring checklist.