


Total staff
77
Employees
64
Contractors
13
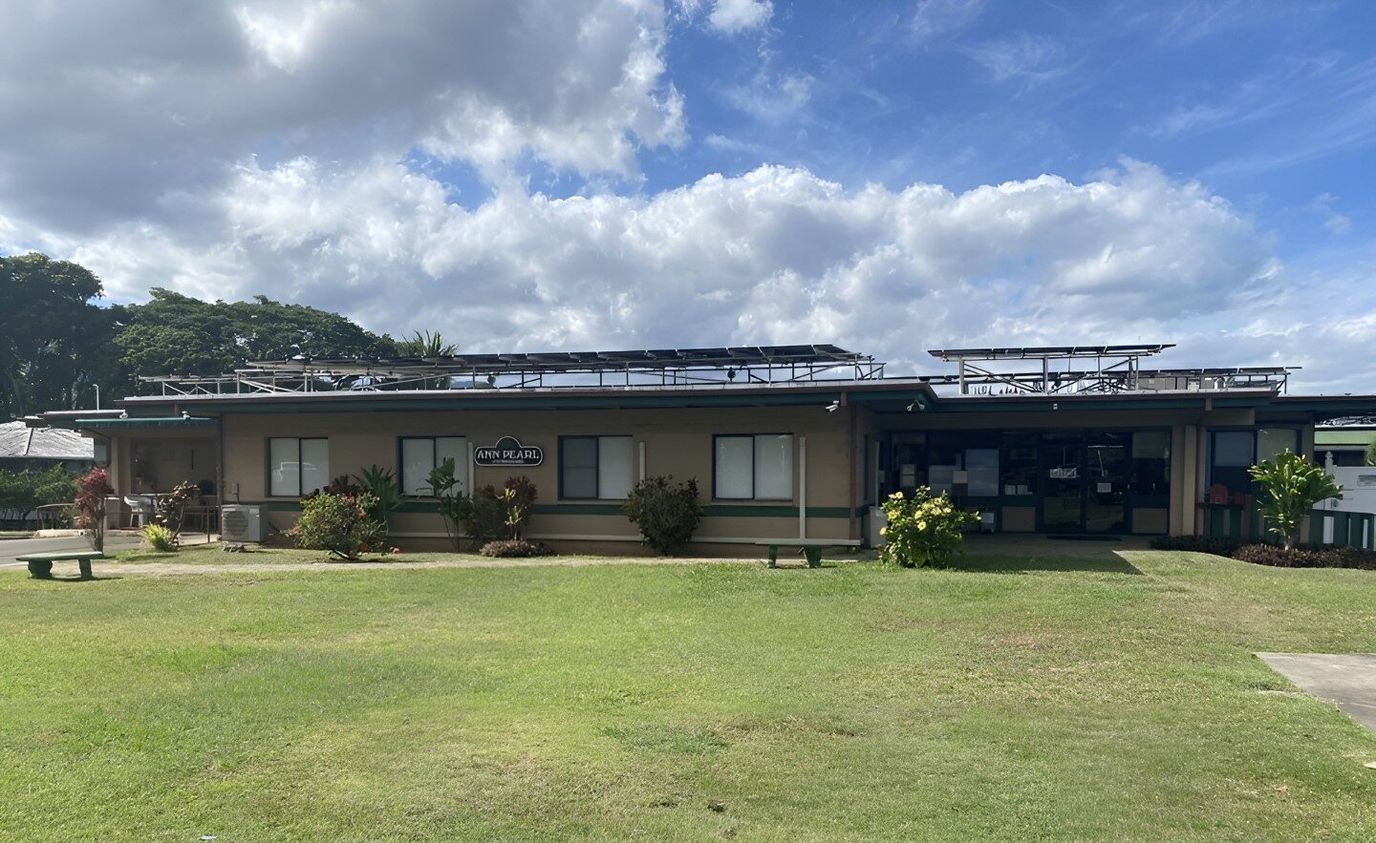
Spend your golden years with Ann Pearl Rehab & Nursing, an outstanding community surrounded by delightful local amenities on Waikalua Road, Kaneohe, HI, offering rehabilitation and skilled nursing. Dedicated to improving residents’ well-being, a kind and well-trained team provides the highest quality of care for their specific needs 24/7. As part of Ohana Pacific, this community consistently promotes a cozy and nurturing environment for residents to recover quickly and flourish.
Prioritizing residents’ holistic wellness, a full calendar of fun recreational activities and engaging programs is conducted. Mealtimes are also something to look forward to, with delightful and healthy dining options that cater to their dietary needs and preferences. The community’s welcoming setting and dedicated services make it an ideal place for those who looking for comprehensive care.
| Staff type | Hours / Day / Resident | vs state avg |
|---|---|---|
|
Registered Nurse (RN)
| 1h 32m per day | ▼ 6% State avg: 1h 38m per day · National avg: 41m per day |
|
LPN / LVN
| 17m per day | ▼ 17% State avg: 21m per day · National avg: 52m per day |
|
Nurse Aide
| 2h 0m per day | ▼ 27% State avg: 2h 44m per day · National avg: 2h 21m per day |
|
Weekend Total Nursing
| 3h 21m per day | ▼ 20% State avg: 4h 11m per day · National avg: 3h 26m per day |
|
Physical Therapist
| 4m per day | ▼ 11% State avg: 5m per day · National avg: 4m per day |
|
Weekend RN
| 1h 10m per day | ▼ 5% State avg: 1h 14m per day · National avg: 29m per day |
Reporting period: October 1 – December 31, 2025 (Q4 2025). Source: CMS Payroll-Based Journal report.
Manages medical care and health needs.
Assists with medical care and medications.
Helps with daily care and mobility.
Total hours from contractors
2,065 contractor hours this quarter
| Certified Nursing Assistant | 30 | 6 | 36 | 10,214 | 92 | 100% | 7.4 |
| Registered Nurse | 18 | 0 | 18 | 6,577 | 92 | 100% | 7.9 |
| Licensed Practical Nurse | 4 | 0 | 4 | 1,569 | 89 | 97% | 8 |
| Clinical Nurse Specialist | 3 | 0 | 3 | 1,200 | 71 | 77% | 7.9 |
| Other Dietary Services Staff | 2 | 0 | 2 | 567 | 70 | 76% | 7.1 |
| Nurse Aide in Training | 3 | 0 | 3 | 532 | 65 | 71% | 7.8 |
| Nurse Practitioner | 1 | 0 | 1 | 472 | 59 | 64% | 8 |
| Dietitian | 2 | 0 | 2 | 440 | 53 | 58% | 8 |
| Administrator | 1 | 0 | 1 | 408 | 51 | 55% | 8 |
| Respiratory Therapy Technician | 0 | 1 | 1 | 400 | 59 | 64% | 6.8 |
| Physical Therapy Assistant | 0 | 2 | 2 | 322 | 52 | 57% | 6.2 |
| Qualified Social Worker | 0 | 3 | 3 | 99 | 25 | 27% | 3.9 |
| Physical Therapy Aide | 0 | 1 | 1 | 56 | 15 | 16% | 3.7 |
Federal penalties imposed by CMS for regulatory violations, including civil money penalties (fines) and denials of payment for new Medicare/Medicaid admissions.
Source: CMS Penalties Database (Data as of Jan 2026)
Hawaii average: $38K
Hawaii average: 1.5
Hawaii average: 0.1
No penalties in the past 3 years
No civil money penalties or payment denials were reported in the last 3 years.
These measures show how residents usually do over time at this home, based on health outcomes and preventive care.
Hawaii average: 10.2
Hawaii average: 20.0
Hawaii average: 17.6%
Hawaii average: 25.8%
Hawaii average: 18.3%
Hawaii average: 2.1%
Hawaii average: 3.6%
Hawaii average: 2.4%
Hawaii average: 4.7%
Hawaii average: 1.5%
Hawaii average: 10.1%
Hawaii average: 96.3%
Hawaii average: 95.4%
Hawaii average: 83.4%
Hawaii average: 1.2%
Hawaii average: 84.7%
Hawaii average: 50.6%
Quality measures are calculated from Minimum Data Set (MDS) assessments. For most measures, lower percentages indicate better care quality.
23% of new residents, usually for short-term rehab.
55% of new residents, often for short stays.
23% of new residents, often for long-term daily care.
Source: CMS Long-Term Care Facility Characteristics (Data as of Jan 2026)
Residents meet regularly to discuss policies, care quality, and activities
Organized group of residents that meets regularly to discuss facility policies, quality of life, and activities.
Data sourced from CMS Long-Term Care Facility Characteristics quarterly report. Payer mix reflects the current resident census by primary payment source.
Historical financial and operational data for Ann Pearl Rehab & Nursing from 2011–2023, based on CMS SNF Cost Reports.
Key figures below are for fiscal year ending in 12/2023.
Based on CMS SNF Cost Report for fiscal year ending in 12/2023.
No pets allowed
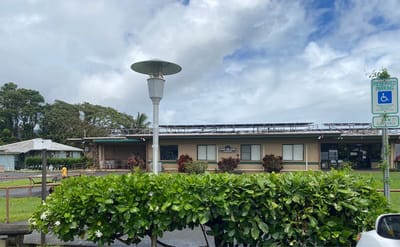
Building Type: Single-story

On-site Medical Care and Health Services
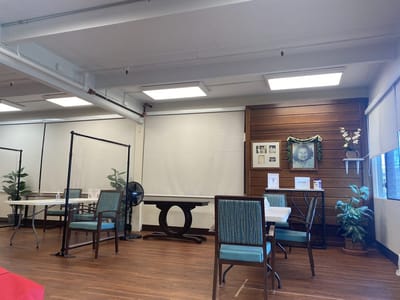
Social and Recreational Activities
This home supports both short-term rehab and long-term care, with residents staying for a wide range of durations.
Most new residents arrive under private pay (55% of admissions), and a typical private pay stay runs around 2 - 3 months.
Coverage residents most often arrive under.
Coverage residents most often leave under.
![]() 1.1 miles from city center
1.1 miles from city center
![]() Estimated distance in miles from Kaneohe's city center to Ann Pearl Rehab & Nursing's address, calculated via Google Maps.
Estimated distance in miles from Kaneohe's city center to Ann Pearl Rehab & Nursing's address, calculated via Google Maps.
Add your location
Info below is compiled from CMS reports & the HI Dept. of Health, senior community websites & trusted data sources such as Walk Score & BBB.
Communities are listed from highest to lowest based on our ranking methodology.
| Good Samaritan Society – Pohai Nani | NH AL IL RC SNF | Kaneohe | 44
Facility
44
HI AVG
43
Rank
#26 / 84 |
79.5%
Facility
79.5%
HI AVG
84.1
Rank
#18 / 23 | -5% | 4.04
Facility
4.04
HI AVG
4.20
Rank
#15 / 25 | +73% | -4% | $0
Facility
$0
HI AVG
$43.4k
Rank
#1 / 26 | 22
Facility
22
HI AVG
35.5
Rank
#4 / 26 | 7.3
Facility
7.3
HI AVG
8.2
Rank
#12 / 26 | - | 35 | - |
18
Facility
18
HI AVG
49
Rank
#140 / 177 | Beryl Muramatsu | $16.1MFiscal year ending 12/2023
Facility
$16.1MFiscal year ending 12/2023
HI AVG
$20.8M
Rank
#11 / 24 | $8.6MFiscal year ending 12/2023
Facility
$8.6MFiscal year ending 12/2023
HI AVG
$7.1M
Rank
#11 / 24 | 53.4%Fiscal year ending 12/2023
Facility
53.4%Fiscal year ending 12/2023
HI AVG
38.9%
Rank
#11 / 24 | 125033 | ||||
| Aloha Nursing and Rehab Center | NH HOS PC RC SNF | Kaneohe | 141
Facility
141
HI AVG
43
Rank
#7 / 84 |
72.6%
Facility
72.6%
HI AVG
84.1
Rank
#20 / 23 | -14% | 4.36
Facility
4.36
HI AVG
4.20
Rank
#11 / 25 | +20% | +4% | $36.3k
Facility
$36.3k
HI AVG
$43.4k
Rank
#22 / 26 | 41
Facility
41
HI AVG
35.5
Rank
#17 / 26 | 6.8
Facility
6.8
HI AVG
8.2
Rank
#7 / 26 | 1 | 102 | A+ |
58
Facility
58
HI AVG
49
Rank
#68 / 177 | Aloha Management Company Inc | $21.2MFiscal year ending 08/2024
Facility
$21.2MFiscal year ending 08/2024
HI AVG
$20.8M
Rank
#7 / 24 | $8.7MFiscal year ending 08/2024
Facility
$8.7MFiscal year ending 08/2024
HI AVG
$7.1M
Rank
#13 / 24 | 41.2%Fiscal year ending 08/2024
Facility
41.2%Fiscal year ending 08/2024
HI AVG
38.9%
Rank
#20 / 24 | 125038 | ||||
| Ann Pearl Rehab & Nursing | NH ADC MC SNF | Kaneohe | 104
Facility
104
HI AVG
43
Rank
#12 / 84 |
56.3%
Facility
56.3%
HI AVG
84.1
Rank
#23 / 23 | -33% | 3.58
Facility
3.58
HI AVG
4.20
Rank
#20 / 25 | +13% | -15% | $0
Facility
$0
HI AVG
$43.4k
Rank
#1 / 26 | 43
Facility
43
HI AVG
35.5
Rank
#19 / 26 | 8.6
Facility
8.6
HI AVG
8.2
Rank
#19 / 26 | 2 | 59 | - |
48
Facility
48
HI AVG
49
Rank
#90 / 177 | Rebecca Canon-Fratis | $9.2MFiscal year ending 12/2023
Facility
$9.2MFiscal year ending 12/2023
HI AVG
$20.8M
Rank
#20 / 24 | $4.6MFiscal year ending 12/2023
Facility
$4.6MFiscal year ending 12/2023
HI AVG
$7.1M
Rank
#22 / 24 | 50.3%Fiscal year ending 12/2023
Facility
50.3%Fiscal year ending 12/2023
HI AVG
38.9%
Rank
#17 / 24 | 125048 |
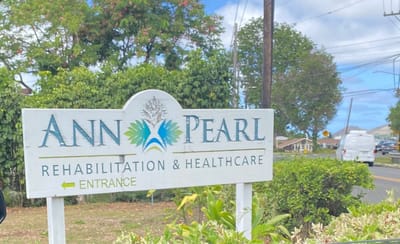
Ann Pearl Rehab & Nursing is located in Kaneohe, Hawaii.
Here are the financial assistance programs available to residents in Hawaii.
Ann Pearl Rehab & Nursing has a walk score of 48. Somewhat walkable. A few nearby services may be reachable on foot, but most trips require transportation.
Ann Pearl Rehab & Nursing's occupancy is 55.9%.
No, Ann Pearl Rehab & Nursing has a no-pet policy.
Ann Pearl Rehab & Nursing is registered as a for-profit in HI.
Yes — there are 4 photos of Ann Pearl Rehab & Nursing in the photo gallery on this page.
Ann Pearl Rehab & Nursing is located at 45-181 Waikalua Rd, Kaneohe, HI 96744.
(808) 247-8558 will put you in contact with the team at Ann Pearl Rehab & Nursing.
Care Cost Calculator: See Prices in Your Area
Nursing Home Data Explorer
Don’t Wait Too Long: 7 Red Flag Signs Your Parent Needs Assisted Living Now
The True Cost of Assisted Living in 2025 – And How Families Are Paying For It
Understanding Senior Living Costs: Pricing Models, Discounts & Financial Assistance


