Arbor Oaks Healthcare and Rehabilitation Center
Nursing Home & Respite Care · Malvern, AR
CMS overall rating Info CMS (the Centers for Medicare & Medicaid Services) is the federal agency that rates nursing home quality. Its Overall Rating runs from 1 to 5 stars, combining health inspections, staffing, and quality measures, with inspections weighted most heavily.

Arbor Oaks Healthcare and Rehabilitation Center

Nursing Home & Respite Care · Malvern, AR
CMS overall rating Info CMS (the Centers for Medicare & Medicaid Services) is the federal agency that rates nursing home quality. Its Overall Rating runs from 1 to 5 stars, combining health inspections, staffing, and quality measures, with inspections weighted most heavily.
Calculator: See prices in your area
Arbor Oaks Healthcare and Rehabilitation Center accepts Medicare, Medicaid, and private pay.

Overview of Arbor Oaks Healthcare and Rehabilitation Center

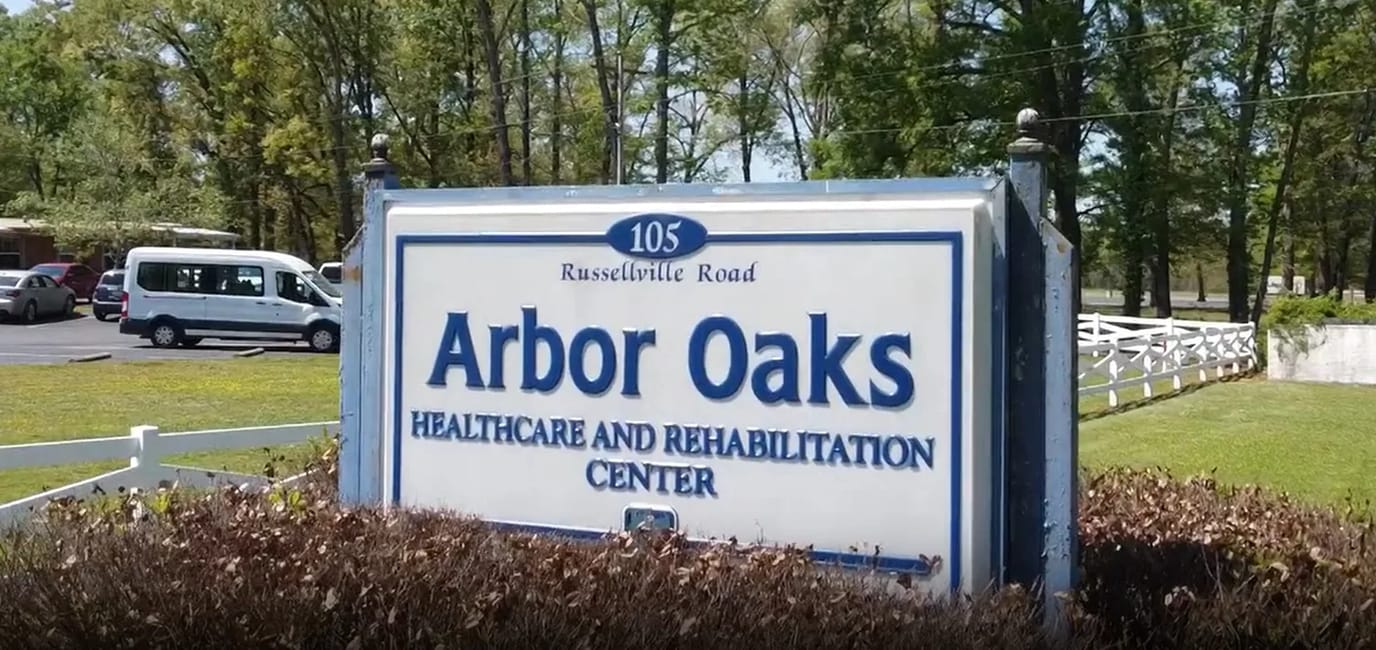
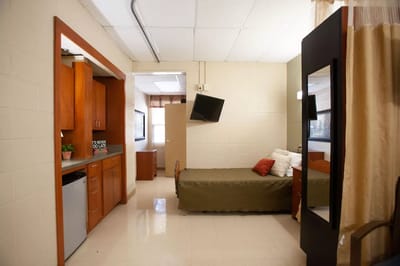
A nursing home in Malvern, Arkansas, which is owned by James Towers, Arbor Oaks Healthcare and Rehabilitation Center takes Medicare, Medicaid, and private pay, making it accessible to families using different coverage routes for short-term rehabilitation and longer-term skilled nursing care.

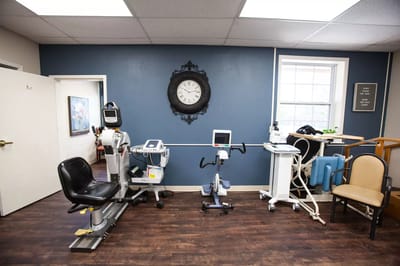
The facility spotlights rehabilitation services, supplying short-term rehab, respite care, and ongoing nursing support. With a doctor on staff and 24-hour staffing, residents get continuous clinical oversight. Total nursing care averages 4 hours and 7 minutes per resident day, distributed across registered nurses, nurse aides, and licensed vocational nurses, indicating a systematized method to hands-on care. The average stay duration runs about 179 days, signaling a mix of post-acute rehab residents and those in longer-term placement. This timeline suggests a usual trajectory for someone recuperating from hospitalization or handling an ongoing nursing need. Arbor Oaks Healthcare and Rehabilitation Center operates under the Life With Us program. Its location in Malvern has a Walk Score of 5, so the place is car-dependent, with a majority of errands requiring a car, which may be informational for visiting family members doing regular trips to the facility.

Quality ratings

Measured by Centers for Medicare & Medicaid Services (CMS)

Overall rating Info The Overall CMS Rating combines results from health inspections, staffing levels and quality measures. Health inspections carry the most weight. Staffing and quality scores can increase or decrease the final rating based on performance compared to state and national standards.
▼ 4.4% Below AR avg. ▼ 4.4% Below AR avg.AR average: 3.1Click the badge to see the full State ranking.Click here to see the full State ranking.
Health Inspection Info Based on the results of the facility's three most recent standard inspections and any complaint investigations. CMS reviews the number, scope, and severity of deficiencies, with more recent findings weighted more heavily.
▲ 3.8% Above AR avg. ▲ 3.8% Above AR avg.AR average: 2.9Click the badge to see the full State ranking.Click here to see the full State ranking.
Staffing Info Measures average nursing staff hours per resident per day, including Registered Nurses (RNs) and total nursing staff. Ratings are adjusted based on the level of care residents require and are compared to state and national benchmarks.
▼ 5.8% Below AR avg. ▼ 5.8% Below AR avg.AR average: 3.2Click the badge to see the full State ranking.Click here to see the full State ranking.
Quality Measures Info Based on clinical and physical health indicators reported to CMS, such as hospital readmissions, falls, pressure ulcers, and improvements in mobility. These measures reflect how well residents' health needs are being managed.
▼ 18.0% Below AR avg. ▼ 18.0% Below AR avg.AR average: 3.7Click the badge to see the full State ranking.Click here to see the full State ranking.

Staffing hours breakdown

Info Daily nursing hours per resident by staff type, reported to CMS. Higher is generally better — compare this facility to state and national averages to see where staffing stands.

Hours per resident per day — compared to Arkansas state averages

Total nursing care / resident Info Total adjusted nursing hours per resident per day, combining RN, LPN, and aide time. CMS adjusts this for case-mix so facilities can be fairly compared.
4h 7m per day
This facility Arkansas avg (4h 40m per day)
vs Arkansas avg
-12%

4 of 6 metrics below state avg

Standout metric LPN / LVN is +15% above state avg
Staff type Hours / Day / Resident vs state avg
Registered Nurse (RN) Info RNs hold the highest nursing license and can assess residents, interpret test results, and direct care plans. More RN hours per day often signals stronger clinical oversight and faster response to health changes. 25m per day ▲ 3% State avg: 24m per day · National avg: 41m per day
LPN / LVN Info Licensed Practical Nurses (LPNs) or Licensed Vocational Nurses (LVNs) deliver routine hands-on care — medication administration, wound dressing, and monitoring vital signs. They work under RN supervision and make up a large share of daily bedside care. 1h 5m per day ▲ 15% State avg: 57m per day · National avg: 52m per day
Nurse Aide Info Certified Nurse Aides (CNAs) provide the most direct day-to-day assistance: bathing, dressing, feeding, and mobility. Nurse aide hours are typically the largest staffing category and directly affect residents' quality of life. 2h 11m per day ▼ 20% State avg: 2h 44m per day · National avg: 2h 21m per day
Weekend Total Nursing Info Combined nursing hours (RN + LPN + Nurse Aide) per resident per day on weekends. Staffing often drops on weekends — this figure reveals whether the facility maintains adequate coverage outside of weekday hours. 3h 6m per day ▼ 11% State avg: 3h 29m per day · National avg: 3h 26m per day
Physical Therapist Info Hours per resident per day provided by licensed Physical Therapists (PTs) or PT Assistants. PT services help residents recover mobility after injury or illness and are especially important for post-acute (short-stay) rehabilitation. 1m per day ▼ 56% State avg: 2m per day · National avg: 4m per day
Weekend RN Info Registered nurse hours specifically on weekends. Facilities sometimes reduce RN presence on Saturdays and Sundays — a low weekend RN figure compared to weekday hours can indicate reduced clinical oversight when most administrative staff are absent. 14m per day ▼ 12% State avg: 16m per day · National avg: 29m per day

Capacity and availability

This home usually has availability

Lower occupancy than the Arkansas average: 71.3%
Occupancy rate
52.9%
Avg. Length of Stay
179 days
Bed community size
94-bed community Rank #154 / 330Bed count — State benchmarkedThis home is ranked 154th out of 330 homes in Arkansas. Shows this facility's certified or reported bed count compared to other Arkansas facilities. Larger communities may offer more amenities, programs, and on-site services for residents and families.Rankings are based only on facilities in Arkansas that report data for that category. Facilities without available data are excluded from the ranking.Click the rank badge to see the full State ranking.Click here to see the full State ranking.
A larger shared setting that may offer more common spaces and organized community services.
Walk Score
Walk Score: 5 / 100 Rank #369 / 419Walk Score — State benchmarkedThis home is ranked 369th out of 419 homes in Arkansas. Shows how walkable this facility's neighborhood is compared to the average Walk Score across Arkansas facilities. Higher scores benefit residents, families, and staff.Rankings are based only on facilities in Arkansas that report data for that category. Facilities without available data are excluded from the ranking.Click the rank badge to see the full State ranking.Click here to see the full State ranking.
Car-dependent. Most errands require a car, with limited nearby walkable options.

Payment & Insurance

2 services
Accept Medicaid
Accept Medicare

Therapy & Rehabilitation

3 services
Rehabilitation Services
Respite Care
Short-Term Rehab

Staffing & Medical

2 services
Doctor on Staff
24-Hour Staffing

Amenities & Lifestyle

Specific ProgramsLife With Us

Contact Arbor Oaks Healthcare and Rehabilitation Center

Staffing Data

Reporting period: October 1 – December 31, 2025 (Q4 2025). Source: CMS Payroll-Based Journal report.

Total staff 110
Employees 83
Contractors 27
Staff to resident ratio 1.75 : 1
10% more staff per resident than Arkansas average
Arkansas average ratio: 1.59 : 1 Arkansas average ratio: 1.59 : 1See full Arkansas ranking
Avg staff/day 32
Average shift 8.8 hours
10% better than Arkansas average
Arkansas average: 8 hours Arkansas average shift: 8 hoursSee full Arkansas ranking
Total staff hours (quarter) 25,902

Nursing staff breakdown

Q4 2025 · Oct 1 – Dec 31 More info This data comes from the CMS Payroll-Based Journal report covering October 1 – December 31, 2025.
Registered Nurse

Manages medical care and health needs.

RN Staff Info All 3 RN Staff are full-time employees. No contractors work on this role. 3
Average shift length Info Average shift length. Calculated as total hours divided by days worked and average staff per day. 8.6 hours
Licensed Practical Nurse

Assists with medical care and medications.

LPN Staff Info All 19 LPN Staff are full-time employees. No contractors work on this role. 19
Average shift length Info Average shift length. Calculated as total hours divided by days worked and average staff per day. 9.8 hours
Certified Nursing Assistant

Helps with daily care and mobility.

CNA Staff Info All 45 CNA Staff are full-time employees. No contractors work on this role. 45
Average shift length Info Average shift length. Calculated as total hours divided by days worked and average staff per day. 9.4 hours

Contractor staffing

Q4 2025 · Oct 1 – Dec 31 More info This data comes from the CMS Payroll-Based Journal report covering October 1 – December 31, 2025.

Total hours from contractors

8.4%

2,179 contractor hours this quarter

Speech Language Pathologist: 9 Respiratory Therapy Technician: 4 Qualified Social Worker: 3 Clinical Nurse Specialist: 3 Physical Therapy Aide: 3 Physical Therapy Assistant: 2 Occupational Therapy Aide: 1 Medical Director: 1 Occupational Therapy Assistant: 1

Staff by category

Q4 2025 · Oct 1 – Dec 31 More info This data comes from the CMS Payroll-Based Journal report covering October 1 – December 31, 2025.
Certified Nursing Assistant 45 0 45 12,977 92 100% 9.4
Licensed Practical Nurse 19 0 19 5,308 92 100% 9.8
RN Director of Nursing 3 0 3 1,416 65 71% 8
Clinical Nurse Specialist 5 3 8 1,155 87 95% 7.9
Registered Nurse 3 0 3 836 67 73% 8.6
Physical Therapy Aide 0 3 3 574 66 72% 8.2
Mental Health Service Worker 1 0 1 559 65 71% 8.6
Nurse Practitioner 3 0 3 551 66 72% 8.2
Speech Language Pathologist 0 9 9 539 71 77% 4.8
Dietitian 1 0 1 464 61 66% 7.6
Qualified Social Worker 0 3 3 440 64 70% 6.7
Administrator 1 0 1 440 55 60% 8
Medication Aide/Technician 1 0 1 295 26 28% 11.3
Nurse Aide in Training 1 0 1 159 14 15% 11.4
Respiratory Therapy Technician 0 4 4 91 41 45% 2.1
Physical Therapy Assistant 0 2 2 66 41 45% 1.6
Medical Director 0 1 1 13 11 12% 1.2
Occupational Therapy Aide 0 1 1 11 3 3% 3.5
Occupational Therapy Assistant 0 1 1 7 3 3% 2.4
45 Certified Nursing Assistant
% of Days 100%
19 Licensed Practical Nurse
% of Days 100%
3 RN Director of Nursing
% of Days 71%
8 Clinical Nurse Specialist
% of Days 95%
3 Registered Nurse
% of Days 73%
3 Physical Therapy Aide
% of Days 72%
1 Mental Health Service Worker
% of Days 71%
3 Nurse Practitioner
% of Days 72%
9 Speech Language Pathologist
% of Days 77%
1 Dietitian
% of Days 66%
3 Qualified Social Worker
% of Days 70%
1 Administrator
% of Days 60%
1 Medication Aide/Technician
% of Days 28%
1 Nurse Aide in Training
% of Days 15%
4 Respiratory Therapy Technician
% of Days 45%
2 Physical Therapy Assistant
% of Days 45%
1 Medical Director
% of Days 12%
1 Occupational Therapy Aide
% of Days 3%
1 Occupational Therapy Assistant
% of Days 3%

Penalties and fines

Includes penalties issued in 2024

Federal penalties imposed by CMS for regulatory violations, including civil money penalties (fines) and denials of payment for new Medicare/Medicaid admissions.

Source: CMS Penalties Database (Data as of Jan 2026)

Total fines amount $8K
69% lower than Arkansas average

Arkansas average: $26K

Number of fines 1
32% fewer fines than Arkansas average

Arkansas average: 1.5

Payment Denials Info Serious action where Medicare and/or Medicaid temporarily stops payments for new residents until issues are fixed. 1
429% more payment denials than Arkansas average

Arkansas average: 0.2

Fines amount comparison
This facility $8K
Arkansas average $26K
Penalty History

Penalties are imposed by CMS for violations of federal nursing home regulations.

2 penalties in the past 3 years

Multiple penalties were reported in the last 3 years.

Civil Money Penalty Info Fines imposed for noncompliance, which can be assessed per day or per instance of violation. Jun 27, 2024
$8K
Payment Denial Info Serious action where Medicare and/or Medicaid temporarily stops payments for new residents until issues are fixed. Jun 27, 2024
11 days

Last updated: Jan 2026

Quality of care over time

These measures show how residents usually do over time at this home, based on health outcomes and preventive care.

High-risk clinical events score Info A composite score based on pressure ulcers, falls with injury, weight loss, walking ability decline, and activities of daily living decline. 9.0
17% worse than Arkansas average

Arkansas average: 7.7

Functional decline score Info A composite score based on activities of daily living decline, walking ability decline, and incontinence. 13.9
In line with Arkansas average

Arkansas average: 13.3

Long-stay resident measures
Above average Info CMS star rating based on long-stay quality measure performance. 5 stars = significantly above average, 1 star = significantly below average.
Need for Help with Daily Activities Increased Info Percent of long-stay residents whose need for help with daily activities has increased 10.9%
5% better than Arkansas average

Arkansas average: 11.5%

Walking Ability Worsened Info Percent of long-stay residents whose ability to move independently worsened 14.3%
7% worse than Arkansas average

Arkansas average: 13.4%

Low Risk Residents with Bowel/Bladder Incontinence Info Percent of low risk long-stay residents who lose control of their bowels or bladder 16.4%
8% worse than Arkansas average

Arkansas average: 15.1%

Falls with Major Injury Info Percent of long-stay residents experiencing one or more falls with major injury 6.3%
61% worse than Arkansas average

Arkansas average: 3.9%

High Risk Residents with Pressure Ulcers Info Percent of long-stay high risk residents with pressure ulcers 5.2%
9% worse than Arkansas average

Arkansas average: 4.7%

Urinary Tract Infection Info Percent of long-stay residents with a urinary tract infection 0.0%
100% better than Arkansas average

Arkansas average: 1.3%

Lost Too Much Weight Info Percent of long-stay residents who lose too much weight 8.5%
69% worse than Arkansas average

Arkansas average: 5.0%

Depressive Symptoms Info Percent of long-stay residents who have depressive symptoms 0.0%
100% better than Arkansas average

Arkansas average: 1.5%

Antipsychotic Use Info Percent of long-stay residents who received an antipsychotic medication 7.0%
33% better than Arkansas average

Arkansas average: 10.5%

Pneumococcal Vaccine Info Percent of long-stay residents assessed and appropriately given the pneumococcal vaccine 98.2%
In line with Arkansas average

Arkansas average: 94.4%

Influenza Vaccine Info Percent of long-stay residents assessed and appropriately given the seasonal influenza vaccine 100.0%
In line with Arkansas average

Arkansas average: 96.2%

Hospitalizations per 1,000 days Info Number of hospitalizations per 1,000 long-stay resident days. 2.35
19% worse than Arkansas average

Arkansas average: 1.97

ED visits per 1,000 days Info Number of outpatient emergency department visits per 1,000 long-stay resident days. 3.79
74% worse than Arkansas average

Arkansas average: 2.18

Short-stay resident measures
Below average Info CMS star rating based on short-stay quality measure performance. 5 stars = much above average, 1 star = much below average.
Pneumococcal Vaccine Info Percent of short-stay residents assessed and appropriately given the pneumococcal vaccine 94.5%
17% better than Arkansas average

Arkansas average: 80.9%

Antipsychotic medication increase Info Percent of short-stay residents who newly received an antipsychotic medication 0.0%
100% better than Arkansas average

Arkansas average: 1.5%

Influenza Vaccine Info Percent of short-stay residents assessed and appropriately given the seasonal influenza vaccine 98.0%
26% better than Arkansas average

Arkansas average: 77.7%

Re-hospitalized after SNF stay Info Percentage of short-stay residents who were re-hospitalized after their nursing home admission. 26.8%
6% worse than Arkansas average

Arkansas average: 25.2%

Emergency department visits Info Percentage of short-stay residents who had an outpatient emergency department visit. 10.9%
21% better than Arkansas average

Arkansas average: 13.8%

Falls with major injury Info Percentage of SNF residents who experience falls with major injury during their stay. 7.5%
874% worse than Arkansas average

Arkansas average: 0.8%

Ability to care for self at discharge Info Percentage of residents at or above expected ability to care for themselves at discharge. 60.6%
13% better than Arkansas average

Arkansas average: 53.7%

Successful return to home or community Info Rate of successful return to home or community from a skilled nursing facility. 45.3%
11% worse than Arkansas average

Arkansas average: 50.6%

Breakdown by payment type

Medicare

28% of new residents, usually for short-term rehab.

Typical stay 1 - 2 months

Private pay

58% of new residents, often for short stays.

Typical stay 2 months

Medicaid

14% of new residents, often for long-term daily care.

Typical stay 2 - 3 years

Facility Characteristics

Source: CMS Long-Term Care Facility Characteristics (Data as of Jan 2026)

Total residents 63
Medicare
3
4.8% of residents
Medicaid
44
69.8% of residents
Private pay or other
16
25.4% of residents
Programs & Services
Residents Group

Residents meet regularly to discuss policies, care quality, and activities

Active Resident Council

Organized group of residents that meets regularly to discuss facility policies, quality of life, and activities.

Finances and operations

Based on CMS SNF Cost Report for fiscal year ending in 12/2023.

For-profit
Operated by a single business entity.
Net patient revenue Info Net patient revenue — what the home actually collects for resident care, after contractual allowances, bad debt and discounts are subtracted from its gross charges (CMS cost report, Worksheet G-3). It covers resident care only; money the home earns from other sources is shown separately as "Other income."
$6.8M
Net patient income Info Net patient income: net patient revenue minus the home's total operating expenses. A positive figure means it earns more from resident care than it spends to deliver it; a negative figure means the opposite. It excludes non-operating "other income."
$107.9K
For-profit Operated by a single business entity.
Net patient revenue Info Net patient revenue — what the home actually collects for resident care, after contractual allowances, bad debt and discounts are subtracted from its gross charges (CMS cost report, Worksheet G-3). It covers resident care only; money the home earns from other sources is shown separately as "Other income."
$6.8M
Net patient income Info Net patient income: net patient revenue minus the home's total operating expenses. A positive figure means it earns more from resident care than it spends to deliver it; a negative figure means the opposite. It excludes non-operating "other income."
$107.9K
Other income Info Money the home earns outside of resident care — such as investments, grants, rentals and other non-operating sources (CMS cost report, Worksheet G-3). It is tracked separately from net patient revenue: it is not part of that figure, and it is not included in net patient income.
$202.6K
Payroll costs Info Staff salaries plus wage-related costs — benefits such as payroll taxes, health insurance and retirement — from the home's own accounting records (CMS cost report, Worksheet A). Contract or agency labor is counted separately, under other operating costs.
$3.0M 43.7% of net patient revenue Info Payroll as a share of revenue: staff salaries and wage-related benefits divided by net patient revenue. A higher figure means more of each revenue dollar goes to staff pay.
Other operating costs Info Everything it costs to run the home apart from payroll — food, utilities, supplies, maintenance, contract labor and administration. Calculated as total operating expense minus payroll (staff salaries and wage-related benefits).
$3.7M
Total costs Info The home's total operating expense for the year — all the costs of running it, salaries included (CMS cost report, Worksheet G-3).
$6.6M

Who this home usually serves

TYPE OF STAY

Mix of rehab and long-term care

This home supports both short-term rehab and long-term care, with residents staying for a wide range of durations.

Most new residents arrive under private pay (58% of admissions), and a typical private pay stay runs around 2 months.

Admissions
124 total

Coverage residents most often arrive under.

Medicare 28%
Private pay 58%
Medicaid 14%
Discharges
112 total

Coverage residents most often leave under.

Medicare 28%
Private pay 63%
Medicaid 9%

Places of interest near Arbor Oaks Healthcare and Rehabilitation Center

Address 1.3 miles from city center Info Estimated distance in miles from Malvern's city center to Arbor Oaks Healthcare and Rehabilitation Center's address, calculated via Google Maps. — 2.32 miles to nearest hospital (Baptist Health Medical Center-Hot Spring County)

Calculate Travel Distance to Arbor Oaks Healthcare and Rehabilitation Center

Add your location

Address

Compare Nursing Homes around Fort Smith

The information below is reported by the Arkansas Department of Human Services, Office of Long Term Care.

5 facilities compared · CMS & AR Dept. of Health data

Chapel Ridge Health and Rehab
NH
Fort Smith
84
Facility 84
AR AVG 84
Rank #176 / 330
96.4% +35% 5.51 -43% +18% $0 20 4.0 - 69 A+
6
Facility 6
AR AVG 34
Rank #363 / 419
Jennifer Williams $9.3M $4.4M 47.3% 45364
Fianna Hills Nursing and Rehabilitation Center
NH
HC
MC
RC
Fort Smith
102
Facility 102
AR AVG 84
Rank #125 / 330
85.3% +20% 4.84 -30% +4% $0 20 10.0 - 95 A+
73
Facility 73
AR AVG 34
Rank #12 / 419
Rhs Nursing, LLC $11.5M $4.4M 38.1% 45354
Arbor Oaks Healthcare and Rehabilitation Center
NH
RC
Malvern
94
Facility 94
AR AVG 84
Rank #154 / 330
52.9% -26% 4.11 -50% -12% $8.0k 20 4.0 1 67 -
5
Facility 5
AR AVG 34
Rank #369 / 419
James Towers $6.8M $3.0M 43.7% 45270
Legacy Health And Rehabilitation Center
NH
MC
Fort Smith
115
Facility 115
AR AVG 84
Rank #83 / 330
82.6% +16% 4.79 +47% +3% $0 39 4.9 2 107 A+
40
Facility 40
AR AVG 34
Rank #159 / 419
Northport Health Services Of Arkansas, L.l.c $10.9M $4.9M 44.5% 45267
The Blossoms at Fort Smith Rehab & Nursing Center
NH
MC
NC
PC
RC
Fort Smith (Mill Creek)
130
Facility 130
AR AVG 84
Rank #47 / 330
82.3% +15% 3.88 -17% -17% $0 37 3.7 1 118 -
34
Facility 34
AR AVG 34
Rank #203 / 419
Brandon Brown $11.7M $4.5M 38.9% 45345

Financial Assistance for
Nursing Home in Arkansas

Arbor Oaks Healthcare and Rehabilitation Center is located in Malvern, Arkansas.
Here are the financial assistance programs available to residents in Arkansas.

Get Financial aid guidance

ARChoices

Arkansas Medicaid ARChoices

Age 65+ or 21+ with disability
General Arkansas resident, Medicaid- eligible, nursing home-level care need.
Income Limits (2025) ~$2,829/month 300% FBR, individual
Asset Limits $2,000 (individual), $3,000 (couple).
AR

Rural focus; possible waitlists.

Benefits
Personal care (5-7 hours/day) Meals ($7/meal) Respite care (240 hours/year) Adult day services ($60/day)

Choices in Living Resource Center

Arkansas Choices in Living

Age 60+
General Arkansas resident.
Income Limits No strict limit; prioritizes low-income.
Asset Limits Not applicable.
AR

Limited direct funding; mostly referral-based.

Benefits
Care coordination Limited respite (up to 5 days/year) Transportation assistance (~5 trips/month)

Living Choices Assisted Living Waiver

Arkansas Medicaid Living Choices Assisted Living Waiver

Age 65+
General Arkansas resident, requires nursing home-level care, lives in a Level II assisted living facility.
Income Limits (2025) ~$2,829/month 300% FBR, individual
Asset Limits $2,000 (individual), $3,000 (couple); spousal rules apply.
AR

Limited provider network; excludes Level I facilities (no nursing services).

Benefits
Personal care (~5 hours/day) Medication management Nursing Activities Transportation

Program of All-Inclusive Care for the Elderly (PACE)

Arkansas Medicaid PACE

Age 55+
General Arkansas resident, nursing home-level care, safe with PACE support.
Income Limits (2025) ~$2,829/month 300% FBR
Asset Limits $2,000 (individual), $3,000 (couple).
AR

Limited geographic availability.

Benefits
Primary/preventive care Personal care (5-7 hours/day) Meals Transportation Therapy

Arkansas State Plan Personal Care

Arkansas Medicaid Personal Care Program

Age
General Any age, Arkansas resident, needs ADL/IADL help, Medicaid-eligible.
Income Limits (2025) ~$1,004/month individual
Asset Limits $9,660 (individual), $14,470 (couple).
AR

No nursing home-level care requirement.

Benefits
Personal care (~4-6 hours/day) Homemaker services (e.g., meal prep)

Frequently Asked Questions about Arbor Oaks Healthcare and Rehabilitation Center

What neighborhood is Arbor Oaks Healthcare and Rehabilitation Center in?

Arbor Oaks Healthcare and Rehabilitation Center is in the Malvern neighborhood.

Is Arbor Oaks Healthcare and Rehabilitation Center in a walkable area?

Arbor Oaks Healthcare and Rehabilitation Center has a walk score of 5. Car-dependent. Most errands require a car, with limited nearby walkable options.

What is the occupancy rate at Arbor Oaks Healthcare and Rehabilitation Center?

Arbor Oaks Healthcare and Rehabilitation Center's occupancy is 52.9%.

Does Arbor Oaks Healthcare and Rehabilitation Center operate as a for-profit or non-profit?

Arbor Oaks Healthcare and Rehabilitation Center is registered as a for-profit.

Are there photos of Arbor Oaks Healthcare and Rehabilitation Center?

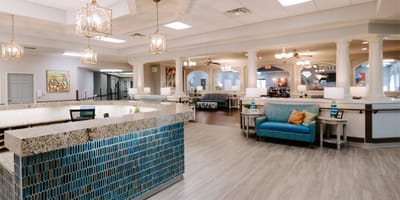
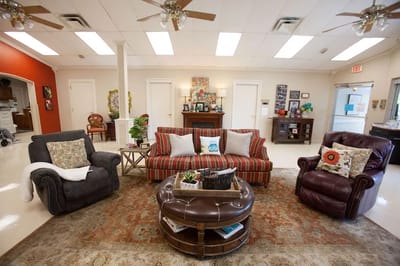
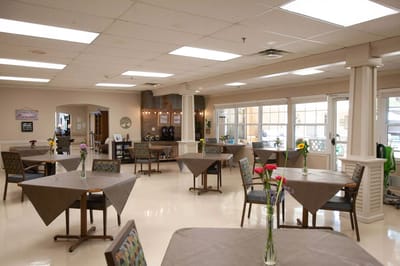
Yes — there are 7 photos of Arbor Oaks Healthcare and Rehabilitation Center in the photo gallery on this page.

What is the address of Arbor Oaks Healthcare and Rehabilitation Center?

Arbor Oaks Healthcare and Rehabilitation Center is located at 105 Russellville Rd, Malvern, AR 72104.

What is the phone number of Arbor Oaks Healthcare and Rehabilitation Center?

(501) 332-5251 will put you in contact with the team at Arbor Oaks Healthcare and Rehabilitation Center.

Guides for Better Senior Living

Care Cost Calculator: See Prices in Your Area

Nursing Home Data Explorer

Don’t Wait Too Long: 7 Red Flag Signs Your Parent Needs Assisted Living Now

The True Cost of Assisted Living in 2025 – And How Families Are Paying For It

Understanding Senior Living Costs: Pricing Models, Discounts & Financial Assistance