


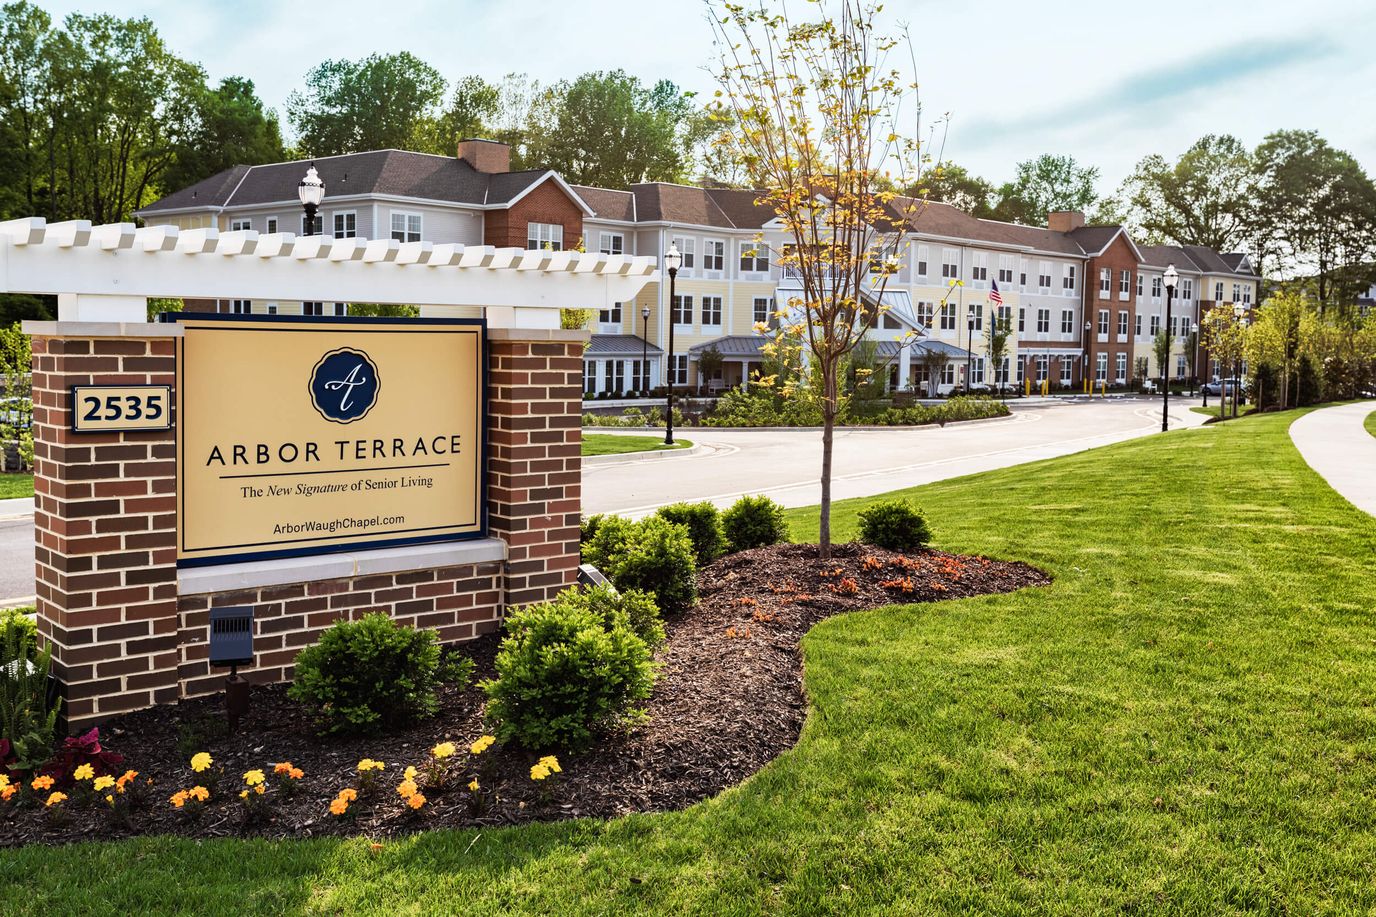
Arbor Terrace at Waugh Chapel
Assisted Living & Memory Care · Gambrills, MD


Arbor Terrace at Waugh Chapel
Assisted Living & Memory Care · Gambrills, MD
Overview of Arbor Terrace at Waugh Chapel
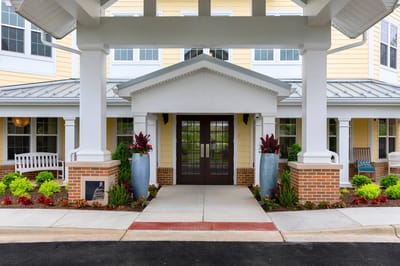
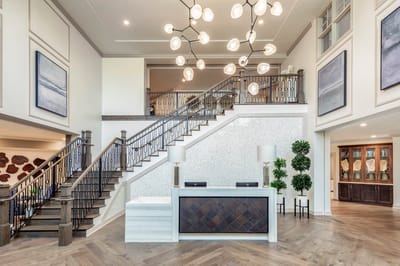
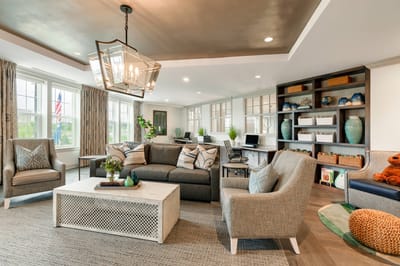
Arbor Terrace at Waugh Chapel is dedicated to crafting a retirement lifestyle that truly makes a difference. This commitment to excellence is further underscored by the multitude of awards it has garnered over time, reflecting a multi-acclaimed facility that goes above and beyond. With an unwavering focus on not only delivering top-tier service but also forging meaningful connections, Arbor Terrace has become a trusted haven for the well-being of seniors. Nestled in a serene, pet-friendly neighborhood exuding a classic charm, the community offers a tranquil respite from the hustle and bustle.
Beyond its exceptional assisted living facilities, Arbor Terrace extends its dedication to dementia care, with specialized memory care apartments thoughtfully designed to cater to the unique needs of residents. This comprehensive approach ensures that seniors receive the support they deserve, making Arbor Terrace a cherished destination among memory care locations. Backed by a dedicated team of well-trained professionals, the community provides services ranging from concierge and transportation to meticulous housekeeping. The inviting outdoor spaces provide a safe haven for relaxation, and an array of dining options further contribute to the comprehensive experience Arbor Terrace is renowned for. With a firm commitment to enhancing the lives of its residents, Arbor Terrace at Waugh Chapel is a true embodiment of excellence and care.
96-bed community Rank #140 / 697Bed count — State benchmarkedThis home is ranked 140th out of 697 homes in Maryland. Shows this facility's certified or reported bed count compared to other Maryland facilities. Larger communities may offer more amenities, programs, and on-site services for residents and families.Rankings are based only on facilities in Maryland that report data for that category. Facilities without available data are excluded from the ranking.Click the rank badge to see the full State ranking.Click here to see the full State ranking.
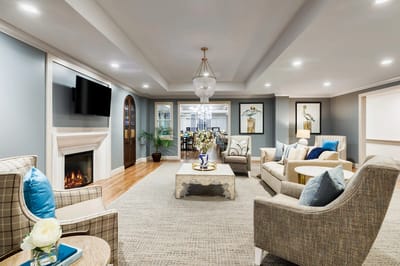
A larger shared setting that may offer more common spaces and organized community services.
4 years in operation Rank #191 / 208Years in operation — State benchmarkedThis home is ranked 191st out of 208 homes in Maryland. Shows how long this facility has been in operation compared to other Maryland facilities. Longer operating histories may benefit residents, families, and staff.Rankings are based only on facilities in Maryland that report data for that category. Facilities without available data are excluded from the ranking.Click the rank badge to see the full State ranking.Click here to see the full State ranking.
An established community with some operational experience and growing routines.
Walk Score: 47 / 100 Rank #459 / 985Walk Score — State benchmarkedThis home is ranked 459th out of 985 homes in Maryland. Shows how walkable this facility's neighborhood is compared to the average Walk Score across Maryland facilities. Higher scores benefit residents, families, and staff.Rankings are based only on facilities in Maryland that report data for that category. Facilities without available data are excluded from the ranking.Click the rank badge to see the full State ranking.Click here to see the full State ranking.
Somewhat walkable. A few nearby services may be reachable on foot, but most trips require transportation.
BBB Rating: A+ (Not Accredited)
An independent rating from the Better Business Bureau based on factors such as complaint history, transparency, and business practices.
How BBB ratings work
How BBB ratings work
About this community
Best Memory Care Community
U.S. News & World Report
Facility TypeAl
CountyAnne Arundel
Profit StatusTrue
Apartment
$161 - $304 per day
Wheelchair Accessible
Safety Features24-hour care and supervision.
Hospice Affiliations
Staffing
Key information about the people who lead and staff this community.
No CNA training program
ContactMs. Candace Jones
Rehabilitation Services
Respite Care
Licensed Nurses/CNAs
24-Hour Staffing
Dedicated Alzheimer's Unit
Mild Alzheimer's Level
Moderate Alzheimer's Level
Severe Alzheimer's Level
Bridges Neighborhood
Pets Allowed
HousekeepingYes
Linen ServiceYes
Utilities IncludedYes
Dining
Personal Linen And Laundry Services
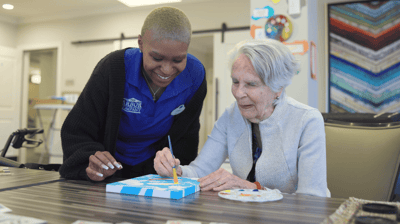
Activities
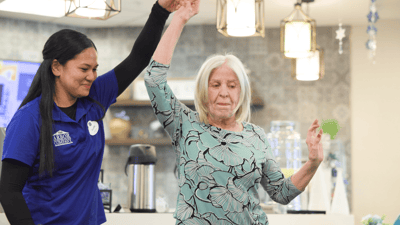
Specific ProgramsConcierge Services, Exercise and Wellness Programs, Housekeeping Services, Full Range of Activities for Engaging Residents
AL$6,900 per month
Bridges$7,700 per month
MC$7,150 per month
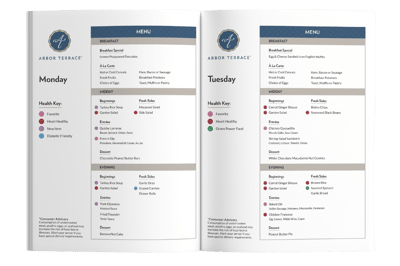
Food DescriptionDining at Arbor Terrace Waugh Chapel is an experience designed to delight. The culinary team prepares fresh, restaurant-style meals daily, focusing on healthy, tasty, and customized options.
Demographics
Resident demographic information for this facility.
Gender
- Female 70.1%
- Male 29.9%
Age Distribution
- 75-84 42.9%
- 85-94 39%
- 65-74 10.4%
- 95+ 7.8%
Ethnicity
- White 85.7%
- African American 11.7%
- Asian 1.3%
- Hawaiian/Pacific Islander 1.3%
Living Spaces & Floor Plans for Arbor Terrace at Waugh Chapel
The Montgomery I Floor Plan
Download PDFThe Montgomery II Floor Plan
Download PDFThe Talbot I Floor Plan
Download PDFThe Talbot II Floor Plan
Download PDFThe Talbot III Floor Plan
Download PDFThe Talbot III Corner Floor Plan
Download PDFThe Queen Anne Floor Plan
Download PDFPlaces of interest near Arbor Terrace at Waugh Chapel
![]() 9.5 miles from city center
9.5 miles from city center
![]() Estimated distance in miles from Gambrills's city center to Arbor Terrace at Waugh Chapel's address, calculated via Google Maps.
— 8.86 miles to nearest hospital (Luminis Health Anne Arundel Medical Center)
Estimated distance in miles from Gambrills's city center to Arbor Terrace at Waugh Chapel's address, calculated via Google Maps.
— 8.86 miles to nearest hospital (Luminis Health Anne Arundel Medical Center)
Calculate Travel Distance to Arbor Terrace at Waugh Chapel
Add your location
Compare Assisted Living around Bowie
The information below is reported by the Maryland Department of Health, Office of Health Care Quality.
| Tribute at Melford | AL MC | Bowie (Melford Boulevard) | 140
Facility
140
MD AVG
43
Rank
#52 / 697 | Yes |
17
Facility
17
MD AVG
43
Rank
#766 / 985 | Studio / 1 Bed | 5
Facility
5
MD AVG
21
Rank
#182 / 208 | - |
32% Male Residents — State Benchmarked 32% of residents are male, compared to the Maryland average of 31%. This facility caters to a majority female resident pool (68% female), consistent with the broader assisted living trend where women significantly outnumber men. |
68% Female Residents — State Benchmarked 68% of residents are female, compared to the Maryland average of 69%. Women comprise the large majority, consistent with national assisted living demographics where women live longer and enter care facilities at higher rates. |
24% White Residents — State Benchmarked 24% of residents are reported as White, compared to the Maryland average of 81%. A lower White share than the Maryland average — the community may draw a more diverse resident mix relative to other facilities in Maryland. |
58% African American Residents — State Benchmarked 58% of residents are reported as African American or Black, compared to the Maryland average of 13%. A higher African American share than the typical Maryland average — useful context when comparing cultural fit and community composition. |
18% Other Ethnicity Residents — State Benchmarked 18% of residents fall into categories other than White or African American (combined), compared to the Maryland average of 6%. This column aggregates Hispanic, Asian, multiracial, and any other labeled groups that are not classified as White or African American. Reported subgroups in this total: Mixed Race (10%), Asian (4%), Hispanic (4%). |
16% Residents Age 65–74 — State Benchmarked 16% of residents are 65–74, compared to the Maryland average of 13%. In line with the statewide profile for this youngest senior bracket in assisted living. |
26% Residents Age 75–84 — State Benchmarked 26% of residents are 75–84, compared to the Maryland average of 31%. Below the state norm — the resident mix may skew either younger or older than this typical middle bracket. |
36% Residents Age 85–94 — State Benchmarked 36% of residents are 85–94, compared to the Maryland average of 44%. The population here skews younger than the statewide norm, which may indicate a more active, lower-acuity community. |
18% Residents Age 95+ — State Benchmarked 18% of residents are 95 or older, compared to the Maryland average of 16%. In line with the statewide profile for the oldest resident bracket. |
| Harmony at Enterprise | AL IL MC | Bowie | 102
Facility
102
MD AVG
43
Rank
#112 / 697 | Yes |
7
Facility
7
MD AVG
43
Rank
#876 / 985 | Studio / 1 Bed / 2 Bed | - | - | - | - | - | - | - | - | - | - | - |
| Brookdale Woodward Estates | AL | Bowie (Bowie Town Center) | 100
Facility
100
MD AVG
43
Rank
#117 / 697 | No |
27
Facility
27
MD AVG
43
Rank
#668 / 985 | Studio / 1 Bed / 2 Bed | 27
Facility
27
MD AVG
21
Rank
#61 / 208 | - |
31% Male Residents — State Benchmarked 31% of residents are male, compared to the Maryland average of 31%. This facility caters to a majority female resident pool (69% female), consistent with the broader assisted living trend where women significantly outnumber men. |
69% Female Residents — State Benchmarked 69% of residents are female, compared to the Maryland average of 69%. Women comprise the large majority, consistent with national assisted living demographics where women live longer and enter care facilities at higher rates. |
29% White Residents — State Benchmarked 29% of residents are reported as White, compared to the Maryland average of 81%. A lower White share than the Maryland average — the community may draw a more diverse resident mix relative to other facilities in Maryland. |
69% African American Residents — State Benchmarked 69% of residents are reported as African American or Black, compared to the Maryland average of 13%. A higher African American share than the typical Maryland average — useful context when comparing cultural fit and community composition. |
2% Other Ethnicity Residents — State Benchmarked 2% of residents fall into categories other than White or African American (combined), compared to the Maryland average of 6%. This column aggregates Hispanic, Asian, multiracial, and any other labeled groups that are not classified as White or African American. Reported subgroups in this total: Asian (2%). |
10% Residents Age 65–74 — State Benchmarked 10% of residents are 65–74, compared to the Maryland average of 13%. Fewer younger seniors suggests the resident population skews older, likely requiring higher acuity care and more hands-on support. |
49% Residents Age 75–84 — State Benchmarked 49% of residents are 75–84, compared to the Maryland average of 31%. A high concentration in this mid-range bracket, where residents typically need moderate support with daily activities. |
33% Residents Age 85–94 — State Benchmarked 33% of residents are 85–94, compared to the Maryland average of 44%. The population here skews younger than the statewide norm, which may indicate a more active, lower-acuity community. |
6% Residents Age 95+ — State Benchmarked 6% of residents are 95 or older, compared to the Maryland average of 16%. Most residents here have not yet reached the oldest-old bracket, suggesting a younger overall community. |
| Arbor Terrace at Waugh Chapel | AL MC | Gambrills (Waugh Chapel Towne Centre) | 96
Facility
96
MD AVG
43
Rank
#140 / 697 | No |
47
Facility
47
MD AVG
43
Rank
#459 / 985 | - | 4
Facility
4
MD AVG
21
Rank
#191 / 208 | A+ |
30% Male Residents — State Benchmarked 30% of residents are male, compared to the Maryland average of 31%. This facility caters to a majority female resident pool (70% female), consistent with the broader assisted living trend where women significantly outnumber men. |
70% Female Residents — State Benchmarked 70% of residents are female, compared to the Maryland average of 69%. Women comprise the large majority, consistent with national assisted living demographics where women live longer and enter care facilities at higher rates. |
86% White Residents — State Benchmarked 86% of residents are reported as White, compared to the Maryland average of 81%. Close to the average for this category among assisted living facilities in Maryland with reported race/ethnicity data. |
12% African American Residents — State Benchmarked 12% of residents are reported as African American or Black, compared to the Maryland average of 13%. In line with the Maryland average for African American residents among facilities reporting this breakdown. |
3% Other Ethnicity Residents — State Benchmarked 3% of residents fall into categories other than White or African American (combined), compared to the Maryland average of 6%. This column aggregates Hispanic, Asian, multiracial, and any other labeled groups that are not classified as White or African American. Reported subgroups in this total: Asian (1%), Hawaiian/Pacific Islander (1%). |
10% Residents Age 65–74 — State Benchmarked 10% of residents are 65–74, compared to the Maryland average of 13%. Fewer younger seniors suggests the resident population skews older, likely requiring higher acuity care and more hands-on support. |
43% Residents Age 75–84 — State Benchmarked 43% of residents are 75–84, compared to the Maryland average of 31%. A high concentration in this mid-range bracket, where residents typically need moderate support with daily activities. |
39% Residents Age 85–94 — State Benchmarked 39% of residents are 85–94, compared to the Maryland average of 44%. This is typically the most common age bracket in assisted living — this facility is in line with the statewide norm. |
8% Residents Age 95+ — State Benchmarked 8% of residents are 95 or older, compared to the Maryland average of 16%. Most residents here have not yet reached the oldest-old bracket, suggesting a younger overall community. |
| Charter Senior Living of Bowie | AL MC RC | Bowie (Laurel Bowie Road) | 52
Facility
52
MD AVG
43
Rank
#221 / 697 | No |
30
Facility
30
MD AVG
43
Rank
#627 / 985 | Studio / 1 Bed / 2 Bed | 26
Facility
26
MD AVG
21
Rank
#77 / 208 | - |
21% Male Residents — State Benchmarked 21% of residents are male, compared to the Maryland average of 31%. This facility caters to a majority female resident pool (79% female), consistent with the broader assisted living trend where women significantly outnumber men. |
79% Female Residents — State Benchmarked 79% of residents are female, compared to the Maryland average of 69%. Women comprise the large majority, consistent with national assisted living demographics where women live longer and enter care facilities at higher rates. |
52% White Residents — State Benchmarked 52% of residents are reported as White, compared to the Maryland average of 81%. A lower White share than the Maryland average — the community may draw a more diverse resident mix relative to other facilities in Maryland. |
46% African American Residents — State Benchmarked 46% of residents are reported as African American or Black, compared to the Maryland average of 13%. A higher African American share than the typical Maryland average — useful context when comparing cultural fit and community composition. |
2% Other Ethnicity Residents — State Benchmarked 2% of residents fall into categories other than White or African American (combined), compared to the Maryland average of 6%. This column aggregates Hispanic, Asian, multiracial, and any other labeled groups that are not classified as White or African American. Reported subgroups in this total: American Indian (2%). | - | - |
83% Residents Age 85–94 — State Benchmarked 83% of residents are 85–94, compared to the Maryland average of 44%. A high concentration of very elderly residents signals a higher-acuity facility with experience caring for advanced age-related needs. |
17% Residents Age 95+ — State Benchmarked 17% of residents are 95 or older, compared to the Maryland average of 16%. In line with the statewide profile for the oldest resident bracket. |
Financial Assistance for
Assisted Living in Maryland
Arbor Terrace at Waugh Chapel is located in Gambrills, Maryland.
Here are the financial assistance programs available to residents in Maryland.
Frequently Asked Questions about Arbor Terrace at Waugh Chapel
What neighborhood is Arbor Terrace at Waugh Chapel in?
Arbor Terrace at Waugh Chapel is in the Waugh Chapel Towne Centre neighborhood of Gambrills.
Is Arbor Terrace at Waugh Chapel in a walkable area?
Arbor Terrace at Waugh Chapel has a walk score of 47. Somewhat walkable. A few nearby services may be reachable on foot, but most trips require transportation.
Does Arbor Terrace at Waugh Chapel have different floorplan options?
Yes — see the floorplan options available at Arbor Terrace at Waugh Chapel on this page.
How many beds does Arbor Terrace at Waugh Chapel have?
Arbor Terrace at Waugh Chapel has 96 beds.
Are there photos of Arbor Terrace at Waugh Chapel?
Yes — there are 11 photos of Arbor Terrace at Waugh Chapel in the photo gallery on this page.
What is the address of Arbor Terrace at Waugh Chapel?
Arbor Terrace at Waugh Chapel is located at 2535 Evergreen Rd, Gambrills, MD 21054.
What is the phone number of Arbor Terrace at Waugh Chapel?
(410) 498-7563 will put you in contact with the team at Arbor Terrace at Waugh Chapel.
Guides for Better Senior Living
Care Cost Calculator: See Prices in Your Area
Assisted Living Explorer
Don’t Wait Too Long: 7 Red Flag Signs Your Parent Needs Assisted Living Now
The True Cost of Assisted Living in 2025 – And How Families Are Paying For It
Understanding Senior Living Costs: Pricing Models, Discounts & Financial Assistance
Updated on
