AristaCare at Parkside
Nursing Home · Union County, NJ

AristaCare at Parkside

Nursing Home · Union County, NJ
Calculator: See prices in your area
AristaCare at Parkside accepts Medicare, Medicaid, and private pay.

Overview of Aristacare at Parkside

Aristacare at Parkside is a premier post-hospital care facility in Linden, NJ, specializing in long-term care, sub-acute care, and rehabilitation. Recently, the center underwent a multimillion-dollar renovation, unveiling a brand-new lobby, state-of-the-art rehab gym, and an upgraded sub-acute unit, making it one of the most modern and welcoming environments for recovery and care in the region.

Dedicated to helping residents achieve their highest level of independence and wellness, Parkside provides 24/7 skilled nursing care, comprehensive therapies, and advanced clinical programs. Its Cardiac Program is designed to support patients recovering from cardiac surgery or illness, while physical, occupational, and speech therapy are available to ensure individualized recovery plans.

Parkside also offers innovative lifestyle and cultural initiatives, including the Nostalgia Park Program for memory care, along with specialized Latino, Indian, and Polish programs that allow residents to celebrate their traditions and cultures.

Beyond skilled nursing and rehabilitation, the community features a small assisted living facility that accepts Medicaid through the MLTSS program, making quality care accessible to more families. Short-term respite services are also available, offering temporary care with the same high standards of comfort, safety, and compassion.

With its recent transformation, specialized cultural and clinical programming, and its reputation as a trusted partner for hospitals and families, Aristacare at Parkside stands as the premier destination for post-hospital care in New Jersey.

Staffing hours breakdown

Info Daily nursing hours per resident by staff type, reported to CMS. Higher is generally better — compare this facility to state and national averages to see where staffing stands.

Hours per resident per day — compared to New Jersey state averages

Staff typeHours / Day / Residentvs state avg
Registered Nurse (RN) Info RNs hold the highest nursing license and can assess residents, interpret test results, and direct care plans. More RN hours per day often signals stronger clinical oversight and faster response to health changes. 21m per day ▼ 49% State avg: 41m per day · National avg: 41m per day
LPN / LVN Info Licensed Practical Nurses (LPNs) or Licensed Vocational Nurses (LVNs) deliver routine hands-on care — medication administration, wound dressing, and monitoring vital signs. They work under RN supervision and make up a large share of daily bedside care. 52m per day ▼ 7% State avg: 56m per day · National avg: 52m per day
Nurse Aide Info Certified Nurse Aides (CNAs) provide the most direct day-to-day assistance: bathing, dressing, feeding, and mobility. Nurse aide hours are typically the largest staffing category and directly affect residents' quality of life. 2h 9m per day ▼ 4% State avg: 2h 14m per day · National avg: 2h 21m per day
Weekend Total Nursing Info Combined nursing hours (RN + LPN + Nurse Aide) per resident per day on weekends. Staffing often drops on weekends — this figure reveals whether the facility maintains adequate coverage outside of weekday hours. 2h 59m per day ▼ 14% State avg: 3h 27m per day · National avg: 3h 26m per day
Physical Therapist Info Hours per resident per day provided by licensed Physical Therapists (PTs) or PT Assistants. PT services help residents recover mobility after injury or illness and are especially important for post-acute (short-stay) rehabilitation. 6m per day ■ Avg State avg: 6m per day · National avg: 4m per day
Weekend RN Info Registered nurse hours specifically on weekends. Facilities sometimes reduce RN presence on Saturdays and Sundays — a low weekend RN figure compared to weekday hours can indicate reduced clinical oversight when most administrative staff are absent. 15m per day ▼ 48% State avg: 29m per day · National avg: 29m per day

Types of Care at AristaCare at Parkside

Nursing Home

Capacity and availability

Avg. Length of Stay
139 days
Bed community size
240-bed community Rank #28 / 562Bed count — State benchmarkedThis home is ranked 28th out of 562 homes in New Jersey. Shows this facility's certified or reported bed count compared to other New Jersey SNFs. Larger communities may offer more amenities, programs, and on-site services for residents and families.Click the rank badge to see the full State ranking.Click here to see the full State ranking.
A large-scale community that may provide a wide range of amenities, services, and structured programs.
Walk Score
Walk Score: 75 / 100 Rank #122 / 640Walk Score — State benchmarkedThis home is ranked 122nd out of 640 homes in New Jersey. Shows how walkable this facility's neighborhood is compared to the average Walk Score across New Jersey SNFs. Higher scores benefit residents, families, and staff.Click the rank badge to see the full State ranking.Click here to see the full State ranking.
Very walkable. Most errands can be accomplished on foot, and many essentials are within a short walk.

About this community

Occupancy

Occupancy rate
5%
Rank #491 / 493Occupancy rate — State benchmarkedThis home is ranked 491st out of 493 homes in New Jersey. Shows this facility's occupancy rate versus the New Jersey average, with its Statewide rank out of 493. Higher occupancy signals strong local demand and financial stability.Click the rank badge to see the full State ranking.Click here to see the full State ranking.
Lower than the New Jersey average: 77%
Occupied beds
11 / 240
Average residents per home in New Jersey 119 per day

Ownership & Operating Entity

Nonprofit OwnershipNo

Type Of Units

Long Term Care
240 units
Total beds
240 units

Staffing

Key information about the people who lead and staff this community.

Leadership

No CNA training program

Therapy & Rehabilitation

3 services
Rehabilitation Services
Respite Care
Short-Term Rehab

Memory & Specialized Care

5 services
No Alzheimer's certification
No dedicated Alzheimer's unit
No mild Alzheimer's level
No moderate Alzheimer's level
No severe Alzheimer's level

Additional Services

1 service
Post-Hospital Care

Amenities & Lifestyle

Post-Hospital Care And Rehabilitation
Clinical Excellence
Quality Experience
Cultural Programs
Specialty Programs
Amenities

Dining & Nutrition

Food DescriptionAristaCare at Parkside delivers the highest quality post-hospital inpatient rehabilitation, long-term care, respite care, and memory care services.

Contact AristaCare at Parkside

Inspection History

In New Jersey, the Department of Health, Health Facilities Evaluation and Licensing conducts mandatory unannounced surveys to ensure facilities provide safe and effective resident care.

Since 2020 · 6 years of data 25 deficiencies 12 inspections

Inspection Scorecard Info This scorecard compares key inspection, citation, and complaint metrics at this facility against the New Jersey state average. Metrics rated ≥15% worse than average are highlighted in red; those ≥15% better are highlighted in green.

Since 2020 vs. New Jersey state average
Overall vs. NJ average 4 Worse Metrics worse than New Jersey average:
• Total deficiencies (39% above)
• Deficiencies per year (40% above)
• Deficiencies per inspection (5% above)
• Total inspections (33% above)
0 Better No metrics in this bucket.
Latest Inspection May 15, 2025 Complaint Investigation

Deficiencies Info Deficiencies are formal regulatory issues recorded during state inspections.

This FacilityNJ Averagevs. NJ Avg
Total deficiencies Info Formal regulatory issues recorded by inspectors across all inspection types. 2518 This facility has 39% more total deficiencies than a typical New Jersey nursing home (25 vs. NJ avg 18).↑ 39% worse
Deficiencies per year Info Average deficiencies per year since 2020. 4.23 This facility has 40% more deficiencies per year than a typical New Jersey nursing home (4.2 vs. NJ avg 3).↑ 40% worse
Deficiencies per inspection Info Average deficiencies per inspection. 2.12 This facility has 5% more deficiencies per inspection than a typical New Jersey nursing home (2.1 vs. NJ avg 2).↑ 5% worse

Inspections Info State inspections evaluate whether the facility meets health and safety standards.

This FacilityNJ Averagevs. NJ Avg
Total inspections Info Combined count of all routine and focused inspections. Excludes complaint investigations. 129 This facility has 33% more total inspections than a typical New Jersey nursing home (12 vs. NJ avg 9).↑ 33% worse

Inspection Reports Summary Info An editor-reviewed summary of the themes and findings across this facility's recent inspection reports.

The most recent inspection on May 15, 2025, identified deficiencies related to inadequate supervision that allowed a cognitively impaired resident to elope from a secured dementia unit. Earlier inspections showed a pattern of deficiencies involving food service accuracy, medication storage and labeling, infection control, resident assessments, and environmental cleanliness. Complaint investigations substantiated issues with meal preferences and resident supervision, but enforcement actions such as fines or license suspensions were not listed in the available reports. The facility implemented corrective actions including increased monitoring and staff training following the elopement incident. The inspection history shows ongoing challenges in several operational areas without a clear pattern of consistent improvement or worsening.

Read the full inspection reports for this facility, including detailed findings and corrective actions.

Show Inspection Reports

Health Inspection History

Inspections since 2020
Total health inspections 4

New Jersey average 4


Last Health inspection on May 2025
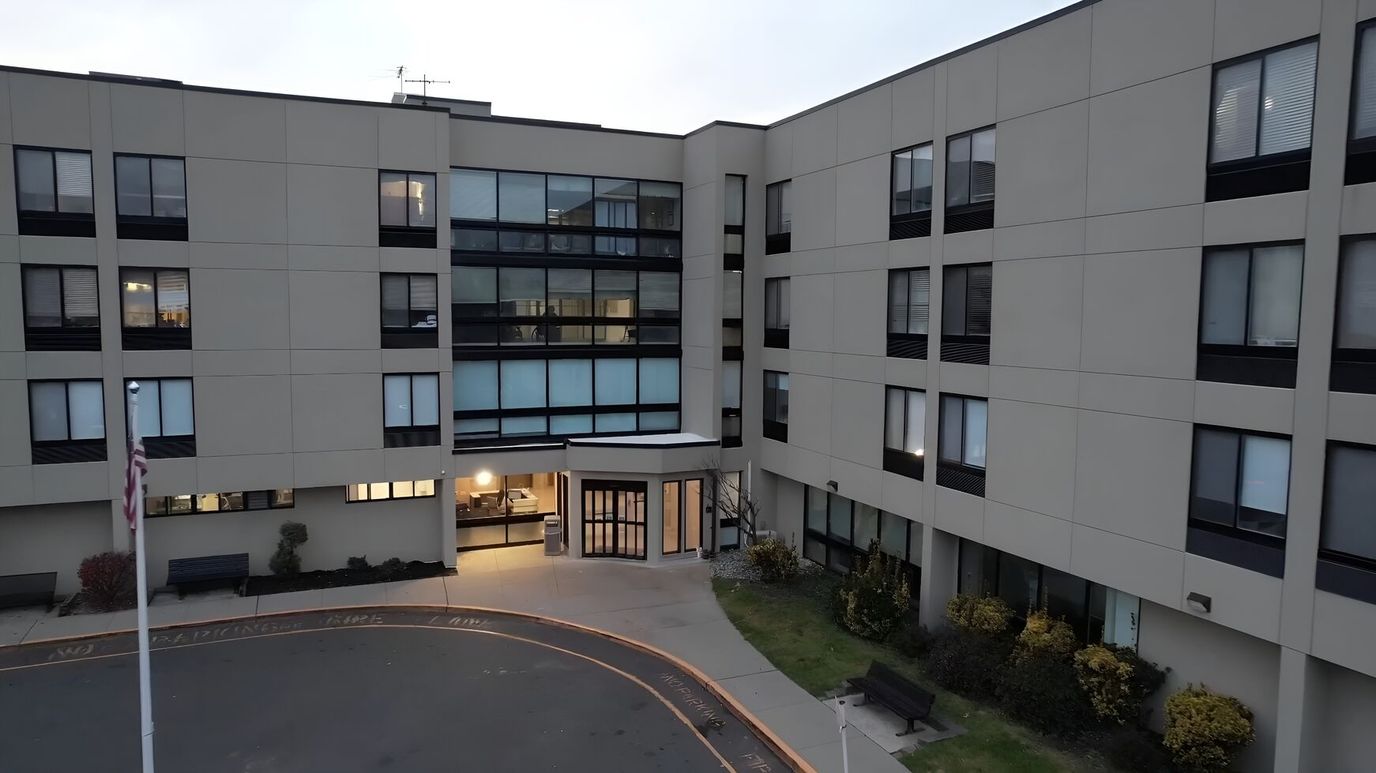
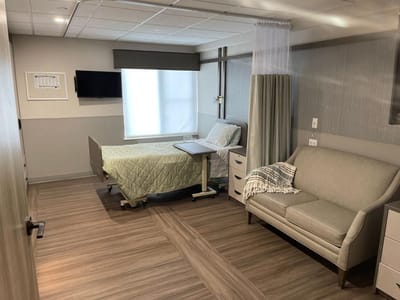
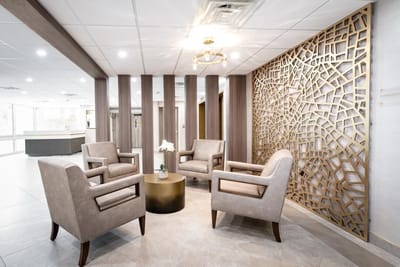
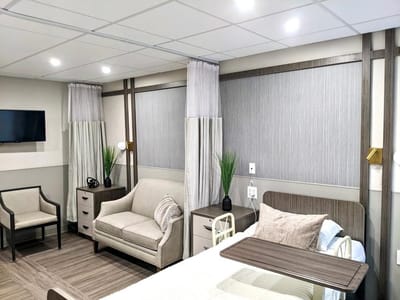
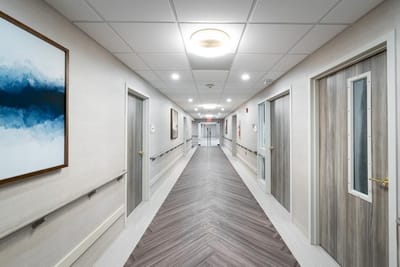
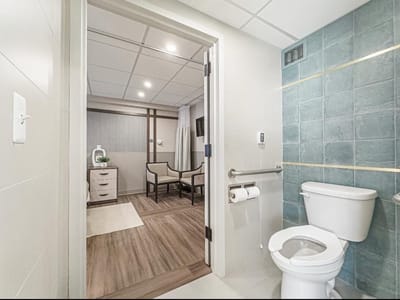
Total health citations
23 Rank #177 / 276Health citations — State benchmarkedThis home is ranked 177th out of 276 homes in New Jersey. Shows this facility's total health deficiency citations benchmarked to the New Jersey State average, with a ranking across all 276 NJ SNFs. Lower citation counts earn a better rank.Click the rank badge to see the full State ranking.Click here to see the full State ranking.

New Jersey average 20.9

Citations per inspection
5.75 Rank #174 / 276Citations per inspection — State benchmarkedThis home is ranked 174th out of 276 homes in New Jersey. Shows average deficiency citations per CMS inspection for this facility versus the New Jersey mean across 276 SNFs with citation data. Lower is better.Click the rank badge to see the full State ranking.Click here to see the full State ranking.

New Jersey average 5.35


Health citations are formal notices following inspections when they fail to comply with safety and care standards.

21 of 23 citations resulted from standard inspections; 1 of 23 resulted from complaint investigations; and 1 of 23 came from combined inspections (standard and complaint).

Breakdown of citation severity (last 6 years)
Critical Health citations
1
43% worse than New Jersey average

New Jersey average: 0.7


Serious Health citations
0
100% better than New Jersey average

New Jersey average: 0.4

1 critical citation New Jersey average: 0.7

0 serious citations New Jersey average: 0.4

21 moderate citations New Jersey average: 19.3

1 minor citation New Jersey average: 0.5
Citations history (last 6 years)
Quality of Care critical citation May 27, 2025
Corrected

Infection Control moderate citation Mar 12, 2025
Corrected

Nutrition moderate citation Mar 12, 2025
Corrected

Nutrition moderate citation Mar 12, 2025
Corrected

Staffing Data

Reporting period: October 1 – December 31, 2025 (Q4 2025). Source: CMS Payroll-Based Journal report.

Total staff 272
Employees 233
Contractors 39
Staff to resident ratio 1.37:1
23% worse than New Jersey average
New Jersey average ratio: 1.79:1 New Jersey average ratio: 1.79:1See full New Jersey ranking
Avg staff/day 118
Average shift 8.1 hours
0% compared with New Jersey average
New Jersey average: 8 hours New Jersey average shift: 8 hoursSee full New Jersey ranking
Total staff hours (quarter) 88,106

Nursing staff breakdown

Q4 2025 · Oct 1 – Dec 31 More info This data comes from the CMS Payroll-Based Journal report covering October 1 – December 31, 2025.
Registered Nurse

Manages medical care and health needs.

RN Staff 22
Average shift length Info Average shift length. Calculated as total hours divided by days worked and average staff per day. 8.2 hours

This role is partially covered by contractors.

Licensed Practical Nurse

Assists with medical care and medications.

LPN Staff 41
Average shift length Info Average shift length. Calculated as total hours divided by days worked and average staff per day. 8.5 hours

This role is partially covered by contractors.

Certified Nursing Assistant

Helps with daily care and mobility.

CNA Staff 128
Average shift length Info Average shift length. Calculated as total hours divided by days worked and average staff per day. 8 hours

This role is partially covered by contractors.

Contractor staffing

Q4 2025 · Oct 1 – Dec 31 More info This data comes from the CMS Payroll-Based Journal report covering October 1 – December 31, 2025.

Total hours from contractors

1.7%

1,476 contractor hours this quarter

Certified Nursing Assistant: 24 Licensed Practical Nurse: 6 Registered Nurse: 6 Clinical Nurse Specialist: 1 Medical Director: 1 Nurse Aide in Training: 1

Staff by category

Q4 2025 · Oct 1 – Dec 31 More info This data comes from the CMS Payroll-Based Journal report covering October 1 – December 31, 2025.
Certified Nursing Assistant1042412841,51992100%8
Licensed Practical Nurse3564115,59992100%8.5
Physical Therapist190198,30592100%8.6
Registered Nurse166225,32292100%8.2
Occupational Therapy Aide110114,14492100%8.8
Other Dietary Services Staff100103,31792100%7.1
Respiratory Therapy Technician7071,9057076%6.9
Physical Therapy Assistant6061,5368997%7.5
Clinical Nurse Specialist2139956368%8.4
Mental Health Service Worker2029126571%8
Speech Language Pathologist2028796874%7.5
Nurse Practitioner1015466166%9
Administrator2025276470%8
Qualified Social Worker2025226368%6.5
Dietitian1014966267%8
Nurse Aide in Training111124904246%8.8
RN Director of Nursing1014806065%8
Physical Therapy Aide1014636166%7.6
Medical Director0111523841%4
128 Certified Nursing Assistant
% of Days 100%
41 Licensed Practical Nurse
% of Days 100%
19 Physical Therapist
% of Days 100%
22 Registered Nurse
% of Days 100%
11 Occupational Therapy Aide
% of Days 100%
10 Other Dietary Services Staff
% of Days 100%
7 Respiratory Therapy Technician
% of Days 76%
6 Physical Therapy Assistant
% of Days 97%
3 Clinical Nurse Specialist
% of Days 68%
2 Mental Health Service Worker
% of Days 71%
2 Speech Language Pathologist
% of Days 74%
1 Nurse Practitioner
% of Days 66%
2 Administrator
% of Days 70%
2 Qualified Social Worker
% of Days 68%
1 Dietitian
% of Days 67%
12 Nurse Aide in Training
% of Days 46%
1 RN Director of Nursing
% of Days 65%
1 Physical Therapy Aide
% of Days 66%
1 Medical Director
% of Days 41%

Penalties and fines

Federal penalties imposed by CMS for regulatory violations, including civil money penalties (fines) and denials of payment for new Medicare/Medicaid admissions.

Source: CMS Penalties Database

No penalties in the past 3 years

No civil money penalties or payment denials were reported in the last 3 years.

Quality of care over time

These measures show how residents usually do over time at this home, based on health outcomes and preventive care.

High-risk clinical events score Info A composite score based on pressure ulcers, falls with injury, weight loss, walking ability decline, and activities of daily living decline. 2.7
61% better than New Jersey average

New Jersey average: 6.8

Functional decline score Info A composite score based on activities of daily living decline, walking ability decline, and incontinence. 4.9
61% better than New Jersey average

New Jersey average: 12.4

Long-stay resident measures
Significantly above average New Jersey avg: 4.5 Info CMS star rating based on long-stay quality measure performance. 5 stars = significantly above average, 1 star = significantly below average.
Need for Help with Daily Activities Increased Info Percent of long-stay residents whose need for help with daily activities has increased 2.9%
71% better than New Jersey average

New Jersey average: 10.1%

Walking Ability Worsened Info Percent of long-stay residents whose ability to move independently worsened 2.0%
82% better than New Jersey average

New Jersey average: 11.0%

Low Risk Residents with Bowel/Bladder Incontinence Info Percent of low risk long-stay residents who lose control of their bowels or bladder 9.8%
39% better than New Jersey average

New Jersey average: 16.0%

Falls with Major Injury Info Percent of long-stay residents experiencing one or more falls with major injury 1.2%
50% better than New Jersey average

New Jersey average: 2.4%

High Risk Residents with Pressure Ulcers Info Percent of long-stay high risk residents with pressure ulcers 4.5%
26% better than New Jersey average

New Jersey average: 6.1%

Urinary Tract Infection Info Percent of long-stay residents with a urinary tract infection 0.3%
69% better than New Jersey average

New Jersey average: 1.0%

Lost Too Much Weight Info Percent of long-stay residents who lose too much weight 2.7%
41% better than New Jersey average

New Jersey average: 4.6%

Depressive Symptoms Info Percent of long-stay residents who have depressive symptoms 12.2%
8% worse than New Jersey average

New Jersey average: 11.3%

Antipsychotic Use Info Percent of long-stay residents who received an antipsychotic medication 13.4%
21% worse than New Jersey average

New Jersey average: 11.1%

Pneumococcal Vaccine Info Percent of long-stay residents assessed and appropriately given the pneumococcal vaccine 99.7%
7% better than New Jersey average

New Jersey average: 93.0%

Influenza Vaccine Info Percent of long-stay residents assessed and appropriately given the seasonal influenza vaccine 97.8%
In line with New Jersey average

New Jersey average: 97.2%

Hospitalizations per 1,000 days Info Number of hospitalizations per 1,000 long-stay resident days. 1.84
12% better than New Jersey average

New Jersey average: 2.08

ED visits per 1,000 days Info Number of outpatient emergency department visits per 1,000 long-stay resident days. 0.50
55% better than New Jersey average

New Jersey average: 1.12

Short-stay resident measures
Above average New Jersey avg: 3.8 Info CMS star rating based on short-stay quality measure performance. 5 stars = much above average, 1 star = much below average.
Pneumococcal Vaccine Info Percent of short-stay residents assessed and appropriately given the pneumococcal vaccine 99.4%
26% better than New Jersey average

New Jersey average: 78.9%

Antipsychotic medication increase Info Percent of short-stay residents who newly received an antipsychotic medication 0.5%
54% better than New Jersey average

New Jersey average: 1.2%

Influenza Vaccine Info Percent of short-stay residents assessed and appropriately given the seasonal influenza vaccine 94.8%
18% better than New Jersey average

New Jersey average: 80.1%

Re-hospitalized after SNF stay Info Percentage of short-stay residents who were re-hospitalized after their nursing home admission. 25.8%
In line with New Jersey average

New Jersey average: 25.4%

Emergency department visits Info Percentage of short-stay residents who had an outpatient emergency department visit. 8.2%
In line with New Jersey average

New Jersey average: 8.2%

Falls with major injury Info Percentage of SNF residents who experience falls with major injury during their stay. 0.6%
22% better than New Jersey average

New Jersey average: 0.8%

Ability to care for self at discharge Info Percentage of residents at or above expected ability to care for themselves at discharge. 62.9%
17% better than New Jersey average

New Jersey average: 53.7%

Successful return to home or community Info Rate of successful return to home or community from a skilled nursing facility. 47.3%
6% worse than New Jersey average

New Jersey average: 50.6%

Breakdown by payment type

Medicare

22% of new residents, usually for short-term rehab.

Typical stay 1 - 2 months

Private pay

45% of new residents, often for short stays.

Typical stay 1 - 2 months

Medicaid

32% of new residents, often for long-term daily care.

Typical stay 10 - 11 months

Facility Characteristics

Source: CMS Long-Term Care Facility Characteristics (Data as of Jan 2026)

Total residents 198
Medicare
34
17.2% of residents
Medicaid
142
71.7% of residents
Private pay or other
22
11.1% of residents
Programs & Services
Residents Group

Residents meet regularly to discuss policies, care quality, and activities

Nurse Aide Training

State-approved Nurse Aide Training and Competency Evaluation Program on-site

Active Resident Council

Organized group of residents that meets regularly to discuss facility policies, quality of life, and activities.

Finances and operations

Privately-owned community
Operated by a partnership between two or more business owners.
Home revenue
$21.6M
Operating loss
-$632.8K
Privately-owned community Operated by a partnership between two or more business owners.
Home revenue
$21.6M Rank #104 / 272Revenue — State benchmarkedThis home is ranked 104th out of 272 homes in New Jersey. Shows this facility's annual revenue compared to the New Jersey SNF average. Higher revenue generally means more resources for staffing and capital — read alongside Payroll %.Click the rank badge to see the full State ranking.Click here to see the full State ranking.
Operating loss
-$632.8K
Payroll costs Info The portion of the home's budget spent on staff, including nurses, caregivers, and other employees who support care and operations. Rank #86 / 272Payroll — State benchmarkedThis home is ranked 86th out of 272 homes in New Jersey. Shows total annual staff payroll benchmarked to the New Jersey average. Higher payroll investment relative to peers often signals better staffing and less reliance on cheaper contract labor.Click the rank badge to see the full State ranking.Click here to see the full State ranking.
$11.4M
53% of revenue Rank #109 / 272Payroll % — State benchmarkedThis home is ranked 109th out of 272 homes in New Jersey. Shows payroll as a percentage of revenue versus the New Jersey average. Well-run New Jersey SNFs typically land around 55–65% — the top third Statewide. Below 25% may signal understaffing or heavy agency use — read with Staffing ratings.Click the rank badge to see the full State ranking.Click here to see the full State ranking.
Other operating costs Info All remaining costs needed to run the home, such as food, utilities, building maintenance, supplies and administrative expenses.
$10.8M
Total costs $22.2M

What does this home offer?

Housing options icon

Housing Options: Private / Semi-Private Rooms

Building type icon
Building type icon

Building Type: Mid-rise

Dining services icon

Dining Services

Beauty services icon

Beauty Services

Housekeeping icon
Housekeeping icon

Housekeeping Services

Social and recreational activities icon

Social and Recreational Activities

On-site medical care and health services icon

On-site Medical Care and Health Services

Who this home usually serves

TYPE OF STAY

Mix of rehab and long-term care

This home supports both short-term rehab and long-term care, with residents staying for a wide range of durations.

Managed by Moshe Rosenblatt

Administrator

Moshe Rosenblatt serves as the Administrator at AristaCare at Parkside, leading the professional care team with dedication and expertise. He oversees the community’s operations to ensure a high standard of quality and compassionate care for all residents.

Places of interest near AristaCare at Parkside

Address 0.5 miles from city center Info Estimated distance in miles from Linden's city center to AristaCare at Parkside's address, calculated via Google Maps.

Calculate Travel Distance to AristaCare at Parkside

Add your location

Address

Compare Nursing Home around Union County

The information below is reported by the New Jersey Department of Health, Health Facilities Evaluation and Licensing.

Filter by care type
AristaCare at Parkside
NH

Nursing Home Licensed facility providing 24/7 skilled nursing care for residents with complex, ongoing medical needs. Staffed by RNs, LPNs, and CNAs. Inspected and star-rated annually by CMS. Accepts Medicare (short-term rehab) and Medicaid (long-term care).

AL

Assisted Living A licensed, long-term care setting for seniors or individuals with disabilities who need help with daily activities — like bathing, dressing, and medication management — but not 24-hour skilled nursing. Offers housing, meals, and around-the-clock support while aiming to maximize resident independence.

Linden -240 75Private / Semi-Private Rooms
Jewish Home Family
NH

Nursing Home Licensed facility providing 24/7 skilled nursing care for residents with complex, ongoing medical needs. Staffed by RNs, LPNs, and CNAs. Inspected and star-rated annually by CMS. Accepts Medicare (short-term rehab) and Medicaid (long-term care).

AL

Assisted Living A licensed, long-term care setting for seniors or individuals with disabilities who need help with daily activities — like bathing, dressing, and medication management — but not 24-hour skilled nursing. Offers housing, meals, and around-the-clock support while aiming to maximize resident independence.

HC

Home Care Professional care delivered in the person's own home — from companionship and errands to skilled nursing and therapy. Allows seniors to age in place. Medicare covers skilled home health when medically necessary.

MC

Memory Care Secured, specialized care for people living with Alzheimer's or dementia. Staff trained in cognitive impairment, with higher staff-to-resident ratios and an environment designed to reduce confusion and wandering risk.

RC

Respite Care Short-term temporary care — days to weeks — to give family caregivers a break. Full care provided during the stay. Often used after hospitalization or to trial a facility before a permanent placement decision.

Rockleigh -196 17Private / Semi-Private Rooms

Frequently Asked Questions about AristaCare at Parkside

Is AristaCare at Parkside in a walkable area?

AristaCare at Parkside has a walk score of 75. Very walkable. Most errands can be accomplished on foot, and many essentials are within a short walk.

What is the occupancy rate at AristaCare at Parkside?

AristaCare at Parkside's occupancy is 5%.

Does AristaCare at Parkside operate as a for-profit or non-profit?

AristaCare at Parkside is registered as a for-profit in NJ.

Who is the administrator of AristaCare at Parkside?

field_administrator is the administrator of AristaCare at Parkside.

How many beds does AristaCare at Parkside have?

AristaCare at Parkside has 240 beds.

What is the address of AristaCare at Parkside?

AristaCare at Parkside is located at 400 W Stimpson Ave, Linden, NJ 07036, United States.

What is the phone number of AristaCare at Parkside?

(908) 862-3399 will put you in contact with the team at AristaCare at Parkside.

Guides for Better Senior Living

Care Cost Calculator: See Prices in Your Area

Nursing Home Data Explorer

Don’t Wait Too Long: 7 Red Flag Signs Your Parent Needs Assisted Living Now

The True Cost of Assisted Living in 2025 – And How Families Are Paying For It

Understanding Senior Living Costs: Pricing Models, Discounts & Financial Assistance

Explore Open Rooms
1 Contact details
2 What type of senior care service are you looking for?
3 What budget do you have in mind for senior care?
4 How soon do you need to find care?
5 Additional details

Thank you for your interest!

Our team will be in touch shortly to help with next steps.