Aspire Adult Family Home
Nursing Home & Assisted Living · Lynnwood, WA
CMS overall rating Info CMS (the Centers for Medicare & Medicaid Services) is the federal agency that rates nursing home quality. Its Overall Rating runs from 1 to 5 stars, combining health inspections, staffing, and quality measures, with inspections weighted most heavily.

Aspire Adult Family Home

Nursing Home & Assisted Living · Lynnwood, WA
CMS overall rating Info CMS (the Centers for Medicare & Medicaid Services) is the federal agency that rates nursing home quality. Its Overall Rating runs from 1 to 5 stars, combining health inspections, staffing, and quality measures, with inspections weighted most heavily.
Calculator: See prices in your area
Aspire Adult Family Home accepts Medicare, Medicaid, and private pay.

Overview of Aspire Adult Family Home

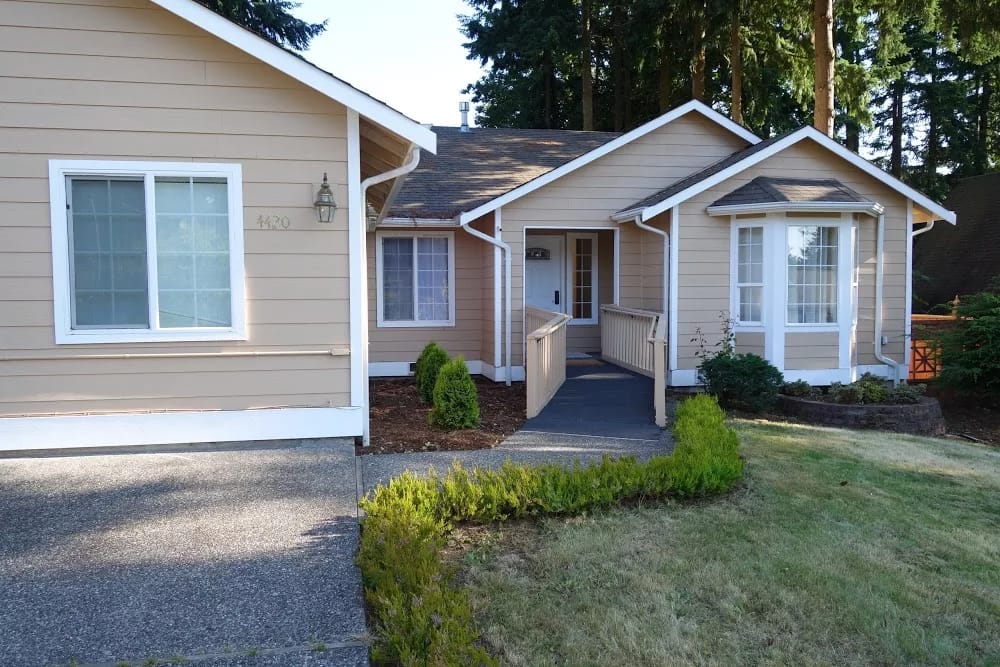
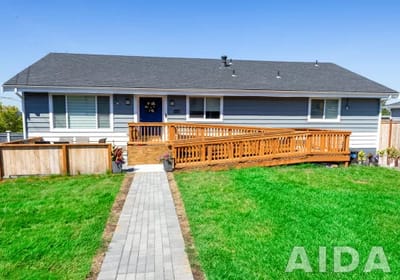
Situated in Lynnwood, Washington, Aspire Adult Family Home is a dedicated senior living community that provides exceptional memory care and services within their residential setting. With a commitment to personalized care, this community offers a variety of floor plan options, including additions like kitchenettes and bathrooms, ensuring tailored living spaces for residents. Safety is a top priority at Aspire Adult Family Home, where residents benefit from essential safety features such as fire and medical alert systems, ensuring prompt assistance during emergencies. Embracing the spirit of independence, the community celebrates and encourages the autonomy of its residents, fostering an environment where individuality thrives.
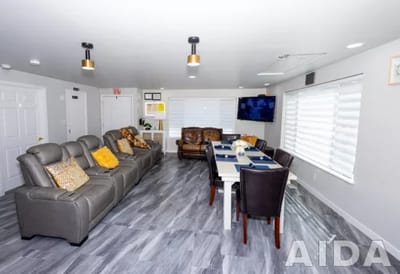
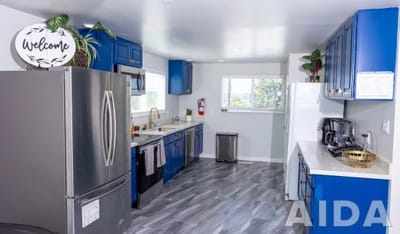
The culinary team at Aspire Adult Family Home prides itself on crafting nutritious and memorable meals from fresh produce, promoting residents’ optimal health and wellness. Residents enjoy many modern amenities, including outdoor and indoor common areas, chef-prepared meals, an on-site beautician, engaging activities, and devotional services—creating a comfortable and nurturing environment reminiscent of home. The community boasts a fully trained, friendly, and accessible staff dedicated to ensuring residents’ enjoyment and comfort during their stay. With a structured program tailored to focus on memory care, Aspire Adult Family Home endeavors to maintain and enhance the quality of life for its residents, emphasizing specialized care and support for their unique needs. At Aspire Adult Family Home, residents experience a supportive environment where personalized care, modern comforts, and a structured program enrich their lives, ensuring a fulfilling and nurturing senior living experience.

(206) 429-5256

Quality ratings

Measured by Centers for Medicare & Medicaid Services (CMS)

Overall rating Info The Overall CMS Rating combines results from health inspections, staffing levels and quality measures. Health inspections carry the most weight. Staffing and quality scores can increase or decrease the final rating based on performance compared to state and national standards.
▼ 69.0% Below WA avg. ▼ 69.0% Below WA avg.WA average: 3.2Click the badge to see the full State ranking.Click here to see the full State ranking.
Health Inspection Info Based on the results of the facility's three most recent standard inspections and any complaint investigations. CMS reviews the number, scope, and severity of deficiencies, with more recent findings weighted more heavily.
▼ 64.5% Below WA avg. ▼ 64.5% Below WA avg.WA average: 2.8Click the badge to see the full State ranking.Click here to see the full State ranking.
Staffing Info Measures average nursing staff hours per resident per day, including Registered Nurses (RNs) and total nursing staff. Ratings are adjusted based on the level of care residents require and are compared to state and national benchmarks.
▲ 16.8% Above WA avg. ▲ 16.8% Above WA avg.WA average: 3.4Click the badge to see the full State ranking.Click here to see the full State ranking.
Quality Measures Info Based on clinical and physical health indicators reported to CMS, such as hospital readmissions, falls, pressure ulcers, and improvements in mobility. These measures reflect how well residents' health needs are being managed.
▼ 23.7% Below WA avg. ▼ 23.7% Below WA avg.WA average: 3.9Click the badge to see the full State ranking.Click here to see the full State ranking.

Staffing hours breakdown

Info Daily nursing hours per resident by staff type, reported to CMS. Higher is generally better — compare this facility to state and national averages to see where staffing stands.

Hours per resident per day — compared to Washington state averages

Total nursing care / resident Info This home is ranked 61st out of 90 homes in Washington for nurse hours. Total adjusted nursing hours per resident per day, combining RN, LPN, and aide time. CMS adjusts this for case-mix so facilities can be fairly compared.
3h 46m per day
Rank #61 / 90Nurse hours — State benchmarkedThis home is ranked 61st out of 90 homes in Washington. Shows adjusted nurse hours per resident per day benchmarked to the Washington average, with a ranking across 90 Washington facilities. More hours mean more direct care. The national average is about 3.5 hrs; below 3.0 is a red flag.Ranking totals vary by category as each rank only includes facilities that report data for that metric. Homes missing that data point aren't included in the ranking.Click the rank badge to see the full State ranking.Click here to see the full State ranking.
This facility Washington avg (4h 13m per day)
vs Washington avg
-11%

5 of 6 metrics below state avg

Staff typeHours / Day / Residentvs state avg
Registered Nurse (RN) Info RNs hold the highest nursing license and can assess residents, interpret test results, and direct care plans. More RN hours per day often signals stronger clinical oversight and faster response to health changes. 50m per day ▼ 7% State avg: 54m per day · National avg: 41m per day
LPN / LVN Info Licensed Practical Nurses (LPNs) or Licensed Vocational Nurses (LVNs) deliver routine hands-on care — medication administration, wound dressing, and monitoring vital signs. They work under RN supervision and make up a large share of daily bedside care. 22m per day ▼ 53% State avg: 48m per day · National avg: 52m per day
Nurse Aide Info Certified Nurse Aides (CNAs) provide the most direct day-to-day assistance: bathing, dressing, feeding, and mobility. Nurse aide hours are typically the largest staffing category and directly affect residents' quality of life. 2h 11m per day ▼ 18% State avg: 2h 41m per day · National avg: 2h 20m per day
Weekend Total Nursing Info Combined nursing hours (RN + LPN + Nurse Aide) per resident per day on weekends. Staffing often drops on weekends — this figure reveals whether the facility maintains adequate coverage outside of weekday hours. 2h 59m per day ▼ 24% State avg: 3h 57m per day · National avg: 3h 27m per day
Physical Therapist Info Hours per resident per day provided by licensed Physical Therapists (PTs) or PT Assistants. PT services help residents recover mobility after injury or illness and are especially important for post-acute (short-stay) rehabilitation. 2m per day ▼ 67% State avg: 6m per day · National avg: 4m per day
Weekend RN Info Registered nurse hours specifically on weekends. Facilities sometimes reduce RN presence on Saturdays and Sundays — a low weekend RN figure compared to weekday hours can indicate reduced clinical oversight when most administrative staff are absent. 39m per day ■ Avg State avg: 39m per day · National avg: 29m per day

Capacity and availability

This home usually has availability

Higher occupancy than the Washington average: 72.5%
Occupancy rate
76.2% Rank #145 / 310Occupancy rate — State benchmarkedThis home is ranked 145th out of 310 homes in Washington. Shows this facility's occupancy rate versus the Washington average, with its Statewide rank out of 310. Higher occupancy signals strong local demand and financial stability.Ranking totals vary by category as each rank only includes facilities that report data for that metric. Homes missing that data point aren't included in the ranking.Click the rank badge to see the full State ranking.Click here to see the full State ranking.
Avg. Length of Stay
126 days
Bed community size
96-bed community Rank #117 / 366Bed count — State benchmarkedThis home is ranked 117th out of 366 homes in Washington. Shows this facility's certified or reported bed count compared to other Washington facilities. Larger communities may offer more amenities, programs, and on-site services for residents and families.Ranking totals vary by category as each rank only includes facilities that report data for that metric. Homes missing that data point aren't included in the ranking.Click the rank badge to see the full State ranking.Click here to see the full State ranking.
A larger shared setting that may offer more common spaces and organized community services.
Walk Score
Walk Score: 59 / 100 Rank #261 / 628Walk Score — State benchmarkedThis home is ranked 261st out of 628 homes in Washington. Shows how walkable this facility's neighborhood is compared to the average Walk Score across Washington facilities. Higher scores benefit residents, families, and staff.Ranking totals vary by category as each rank only includes facilities that report data for that metric. Homes missing that data point aren't included in the ranking.Click the rank badge to see the full State ranking.Click here to see the full State ranking.
Moderately walkable. Some errands can be accomplished on foot, with a mix of nearby amenities.

About this community

Contact Aspire Adult Family Home

Staffing Data

Reporting period: October 1 – December 31, 2025 (Q4 2025). Source: CMS Payroll-Based Journal report.

Total staff 116
Employees 98
Contractors 18
Staff to resident ratio 1.61 : 1
13% fewer staff per resident than Washington average
Washington average ratio: 1.86 : 1 Washington average ratio: 1.86 : 1See full Washington ranking
Avg staff/day 40
Average shift 7.7 hours
5% worse than Washington average
Washington average: 8.1 hours Washington average shift: 8.1 hoursSee full Washington ranking
Total staff hours (quarter) 28,382

Nursing staff breakdown

Q4 2025 · Oct 1 – Dec 31 More info This data comes from the CMS Payroll-Based Journal report covering October 1 – December 31, 2025.
Registered Nurse

Manages medical care and health needs.

RN Staff Info 31 total: 19 full-time employees and 12 contractors. 31
Average shift length Info Average shift length. Calculated as total hours divided by days worked and average staff per day. 9.5 hours
Licensed Practical Nurse

Assists with medical care and medications.

LPN Staff Info 17 total: 12 full-time employees and 5 contractors. 17
Average shift length Info Average shift length. Calculated as total hours divided by days worked and average staff per day. 9 hours
Certified Nursing Assistant

Helps with daily care and mobility.

CNA Staff Info 40 total: 39 full-time employees and 1 contractor. 40
Average shift length Info Average shift length. Calculated as total hours divided by days worked and average staff per day. 7.4 hours

Contractor staffing

Q4 2025 · Oct 1 – Dec 31 More info This data comes from the CMS Payroll-Based Journal report covering October 1 – December 31, 2025.

Total hours from contractors

1.1%

325 contractor hours this quarter

Registered Nurse: 12 Licensed Practical Nurse: 5 Certified Nursing Assistant: 1

Staff by category

Q4 2025 · Oct 1 – Dec 31 More info This data comes from the CMS Payroll-Based Journal report covering October 1 – December 31, 2025.
Certified Nursing Assistant3914014,98892100%7.4
Registered Nurse1912315,05392100%9.5
Licensed Practical Nurse125172,60492100%9
Physical Therapy Aide3038507480%6.6
Other Dietary Services Staff4048058693%6.5
Administrator2025126470%8
Qualified Social Worker1015126470%8
Speech Language Pathologist3035066975%7
Nurse Practitioner2025046368%8
Mental Health Service Worker1014645459%8.6
Dietitian1014436267%7.1
Nurse Aide in Training5054195054%6.5
Clinical Nurse Specialist1013675257%7.1
Respiratory Therapy Technician3032135155%3.9
Physical Therapy Assistant2021426267%2.3
40 Certified Nursing Assistant
% of Days 100%
31 Registered Nurse
% of Days 100%
17 Licensed Practical Nurse
% of Days 100%
3 Physical Therapy Aide
% of Days 80%
4 Other Dietary Services Staff
% of Days 93%
2 Administrator
% of Days 70%
1 Qualified Social Worker
% of Days 70%
3 Speech Language Pathologist
% of Days 75%
2 Nurse Practitioner
% of Days 68%
1 Mental Health Service Worker
% of Days 59%
1 Dietitian
% of Days 67%
5 Nurse Aide in Training
% of Days 54%
1 Clinical Nurse Specialist
% of Days 57%
3 Respiratory Therapy Technician
% of Days 55%
2 Physical Therapy Assistant
% of Days 67%

Penalties and fines

Includes penalties issued in 2023-2024

Federal penalties imposed by CMS for regulatory violations, including civil money penalties (fines) and denials of payment for new Medicare/Medicaid admissions.

Source: CMS Penalties Database (Data as of Jan 2026)

Total fines amount $392K Rank #92 / 92Federal fines — State benchmarkedThis home is ranked 92nd out of 92 homes in Washington. Shows this facility's cumulative CMS federal fine dollars versus the Washington average among facilities with fines, and where it ranks among 92 facilities in the pool. Lower total dollars mean a better rank.Ranking totals vary by category as each rank only includes facilities that report data for that metric. Homes missing that data point aren't included in the ranking.Click the rank badge to see the full State ranking.Click here to see the full State ranking.
380% higher than Washington average

Washington average: $82K

Number of fines 6
225% more fines than Washington average

Washington average: 1.8

Payment Denials Info Serious action where Medicare and/or Medicaid temporarily stops payments for new residents until issues are fixed. 0
100% fewer payment denials than Washington average

Washington average: 0.3

Fines amount comparison
This facility $392K
Washington average $82K
Penalty History

Penalties are imposed by CMS for violations of federal nursing home regulations.

5 penalties in the past 3 years

Multiple penalties were reported in the last 3 years.

Civil Money Penalty Info Fines imposed for noncompliance, which can be assessed per day or per instance of violation. Jul 31, 2024
$15K
Civil Money Penalty Info Fines imposed for noncompliance, which can be assessed per day or per instance of violation. May 2, 2024
$95K
Civil Money Penalty Info Fines imposed for noncompliance, which can be assessed per day or per instance of violation. Feb 14, 2024
$55K
Civil Money Penalty Info Fines imposed for noncompliance, which can be assessed per day or per instance of violation. Sep 28, 2023
$145K

Last updated: Jan 2026

Quality of care over time

These measures show how residents usually do over time at this home, based on health outcomes and preventive care.

High-risk clinical events score Info A composite score based on pressure ulcers, falls with injury, weight loss, walking ability decline, and activities of daily living decline. 12.2
21% worse than Washington average

Washington average: 10.0

Functional decline score Info A composite score based on activities of daily living decline, walking ability decline, and incontinence. 21.9
5% worse than Washington average

Washington average: 20.9

Long-stay resident measures
Need for Help with Daily Activities Increased Info Percent of long-stay residents whose need for help with daily activities has increased 13.2%
20% better than Washington average

Washington average: 16.4%

Walking Ability Worsened Info Percent of long-stay residents whose ability to move independently worsened 34.9%
60% worse than Washington average

Washington average: 21.8%

Low Risk Residents with Bowel/Bladder Incontinence Info Percent of low risk long-stay residents who lose control of their bowels or bladder 17.7%
27% better than Washington average

Washington average: 24.3%

Falls with Major Injury Info Percent of long-stay residents experiencing one or more falls with major injury 2.7%
In line with Washington average

Washington average: 2.6%

High Risk Residents with Pressure Ulcers Info Percent of long-stay high risk residents with pressure ulcers 4.7%
5% better than Washington average

Washington average: 4.9%

Urinary Tract Infection Info Percent of long-stay residents with a urinary tract infection 2.0%
12% worse than Washington average

Washington average: 1.7%

Lost Too Much Weight Info Percent of long-stay residents who lose too much weight 5.4%
8% better than Washington average

Washington average: 5.8%

Depressive Symptoms Info Percent of long-stay residents who have depressive symptoms 9.7%
40% better than Washington average

Washington average: 16.2%

Antipsychotic Use Info Percent of long-stay residents who received an antipsychotic medication 21.9%
51% worse than Washington average

Washington average: 14.5%

Pneumococcal Vaccine Info Percent of long-stay residents assessed and appropriately given the pneumococcal vaccine 99.6%
In line with Washington average

Washington average: 96.2%

Influenza Vaccine Info Percent of long-stay residents assessed and appropriately given the seasonal influenza vaccine 94.4%
In line with Washington average

Washington average: 93.8%

Short-stay resident measures
Pneumococcal Vaccine Info Percent of short-stay residents assessed and appropriately given the pneumococcal vaccine 97.3%
10% better than Washington average

Washington average: 88.1%

Antipsychotic medication increase Info Percent of short-stay residents who newly received an antipsychotic medication 3.9%
171% worse than Washington average

Washington average: 1.4%

Influenza Vaccine Info Percent of short-stay residents assessed and appropriately given the seasonal influenza vaccine 75.0%
9% worse than Washington average

Washington average: 82.0%

Breakdown by payment type

Medicare

40% of new residents, usually for short-term rehab.

Typical stay 1 - 2 months

Private pay

49% of new residents, often for short stays.

Typical stay 19 days

Medicaid

11% of new residents, often for long-term daily care.

Typical stay 3 years

Facility Characteristics

Source: CMS Long-Term Care Facility Characteristics (Data as of Jan 2026)

Total residents 72
Medicare
1
1.4% of residents
Medicaid
54
75% of residents
Private pay or other
17
23.6% of residents
Programs & Services
Residents Group

Residents meet regularly to discuss policies, care quality, and activities

Active Resident Council

Organized group of residents that meets regularly to discuss facility policies, quality of life, and activities.

Finances and operations

Based on CMS SNF Cost Report for fiscal year ending in 12/2023.

Privately-owned community
Operated by a single business entity.
Net patient revenue Info Net patient revenue — what the home actually collects for resident care, after contractual allowances, bad debt and discounts are subtracted from its gross charges (CMS cost report, Worksheet G-3). It covers resident care only; money the home earns from other sources is shown separately as "Other income."
$11.0M
Net patient income Info Net patient income: net patient revenue minus the home's total operating expenses. A positive figure means it earns more from resident care than it spends to deliver it; a negative figure means the opposite. It excludes non-operating "other income."
-$833.2K
Privately-owned community Operated by a single business entity.
Net patient revenue Info Net patient revenue — what the home actually collects for resident care, after contractual allowances, bad debt and discounts are subtracted from its gross charges (CMS cost report, Worksheet G-3). It covers resident care only; money the home earns from other sources is shown separately as "Other income."
$11.0M Rank #65 / 94Revenue — State benchmarkedThis home is ranked 65th out of 94 homes in Washington. Shows this facility's annual revenue compared to the Washington average. Higher revenue generally means more resources for staffing and capital — read alongside Payroll %.Ranking totals vary by category as each rank only includes facilities that report data for that metric. Homes missing that data point aren't included in the ranking.Click the rank badge to see the full State ranking.Click here to see the full State ranking.
Net patient income Info Net patient income: net patient revenue minus the home's total operating expenses. A positive figure means it earns more from resident care than it spends to deliver it; a negative figure means the opposite. It excludes non-operating "other income."
-$833.2K
Other income Info Money the home earns outside of resident care — such as investments, grants, rentals and other non-operating sources (CMS cost report, Worksheet G-3). It is tracked separately from net patient revenue: it is not part of that figure, and it is not included in net patient income.
-$44.1K
Payroll costs Info Staff salaries plus wage-related costs — benefits such as payroll taxes, health insurance and retirement — from the home's own accounting records (CMS cost report, Worksheet A). Contract or agency labor is counted separately, under other operating costs. Rank #65 / 94Payroll — State benchmarkedThis home is ranked 65th out of 94 homes in Washington. Shows total annual staff payroll benchmarked to the Washington average. Higher payroll investment relative to peers often signals better staffing and less reliance on cheaper contract labor.Ranking totals vary by category as each rank only includes facilities that report data for that metric. Homes missing that data point aren't included in the ranking.Click the rank badge to see the full State ranking.Click here to see the full State ranking.
$5.5M 50.2% of net patient revenue Info Payroll as a share of revenue: staff salaries and wage-related benefits divided by net patient revenue. A higher figure means more of each revenue dollar goes to staff pay. Rank #54 / 94Payroll % — State benchmarkedThis home is ranked 54th out of 94 homes in Washington. Shows payroll as a percentage of revenue versus the Washington average. Well-run Washington facilities typically land around 53–61% — the top third Statewide. Below 25% may signal understaffing or heavy agency use — read with Staffing ratings.Ranking totals vary by category as each rank only includes facilities that report data for that metric. Homes missing that data point aren't included in the ranking.Click the rank badge to see the full State ranking.Click here to see the full State ranking.
Other operating costs Info Everything it costs to run the home apart from payroll — food, utilities, supplies, maintenance, contract labor and administration. Calculated as total operating expense minus payroll (staff salaries and wage-related benefits).
$6.3M
Total costs Info The home's total operating expense for the year — all the costs of running it, salaries included (CMS cost report, Worksheet G-3).
$11.9M

Who this home usually serves

TYPE OF STAY

Mix of rehab and long-term care

This home supports both short-term rehab and long-term care, with residents staying for a wide range of durations.

New residents most often arrive under private pay (49% of admissions), and a typical private pay stay runs around 19 days.

Admissions
174 total

Coverage residents most often arrive under.

Medicare 40%
Private pay 49%
Medicaid 11%
Discharges
212 total

Coverage residents most often leave under.

Medicare 25%
Private pay 34%
Medicaid 40%

Places of interest near Aspire Adult Family Home

Address 1.5 miles from city center Info Estimated distance in miles from Lynnwood's city center to Aspire Adult Family Home's address, calculated via Google Maps. — 2.99 miles to nearest hospital (Swedish Edmonds Campus)

Calculate Travel Distance to Aspire Adult Family Home

Add your location

Address

Financial Assistance for
Nursing Home in Washington

Aspire Adult Family Home is located in Lynnwood, Washington.
Here are the financial assistance programs available to residents in Washington.

Get Financial aid guidance

Community Options Program Entry System (COPES)

WA Medicaid COPES

Age 65+ or disabled
General Washington resident, Medicaid-eligible, nursing home-level care need.
Income Limits (2025) ~$2,829/month 300% FBR, individual
Asset Limits $2,000 (individual), $3,000 (couple).
WA

High demand in urban areas (e.g., Seattle).

Benefits
Personal care (5-7 hours/day) Respite (240 hours/year) Adult day care ($70/day) Home modifications ($1,500 avg.)

Washington Family Caregiver Support Program

WA NFCSP

Age Caregiver of someone 60+ (or with dementia)
General Washington resident.
Income Limits No strict limit; prioritizes low-income.
Asset Limits Not applicable.
WA

High urban demand; rural outreach.

Benefits
In-home respite (4-6 hours/day) Adult day care (~$70/day) Short-term facility care (up to 5 days)

Community First Choice (CFC)

Washington Community First Choice

Age 65+ (or disabled 18+)
General WA resident, Medicaid-eligible, need help with 2+ ADLs/IADLs.
Income Limits (2025) ~$2,829/month; QIT optional.
Asset Limits $2,000 (individual), $3,000 (couple).
WA

Broader than COPES; serves ~20,000; self-directed option.

Benefits
Personal care (4-6 hours/day) Respite (~240 hours/year) Assistive devices Training Transportation

Older Americans Act (OAA) Services

Washington OAA Services

Age 60+
General WA resident; no income/asset limits.
Income Limits (2025) None; donations encouraged.
Asset Limits Not assessed.
WA

13 AAAs; includes Meals on Wheels; rural focus.

Benefits
Meals (~$5-$7/meal) Transportation Homemaker services (~4 hours/week) Respite (~5 days/year) Legal aid

Medicare Savings Program (MSP)

Washington Medicare Savings Program

Age 65+ or disabled
General WA resident, Medicare Part A/B.
Income Limits (2025) ~$2,510/month (QMB), ~$3,380/month (SLMB), ~$3,598/month (QI)—individual.
Asset Limits $9,430 (individual), $14,130 (couple).
WA

Includes Extra Help for Part D; no waitlist.

Benefits
Covers Part B premiums ($174.70/month) Deductibles ($240/year) Copays (~20%)

VA Aid and Attendance (A&A) and Housebound Benefits

Washington VA Aid and Attendance/Housebound

Age 65+ or disabled veteran/spouse
General WA resident, wartime service, ADL help (A&A) or homebound.
Income Limits (2025) Net income < ~$1,984/month (veteran with dependent, A&A); pension offsets income.
Asset Limits ~$155,356 net worth
WA

High veteran use; supports rural/urban needs.

Benefits
Cash (~$1,433-$2,642/month veteran, ~$951-$1,318 spouse) for care costs

Senior Citizens Property Tax Exemption

Washington Senior Property Tax Exemption

Age 61+ or disabled retiree
General WA resident, homeowner, income-based.
Income Limits (2025) ~$45,000-$70,000/year varies by county, e.g., King: $70,000
Asset Limits Not assessed; home value cap varies ~$250,000-$400,000
WA

Saves ~$500-$1,500/year; offered statewide.

Benefits
Tax exemption (~$500-$1,500/year depending on county)

Senior Farmers’ Market Nutrition Program (SFMNP)

Washington SFMNP

Age 60+
General WA resident, low-income.
Income Limits (2025) ~$2,322/month 185% FPL
Asset Limits Not assessed.
WA

Vouchers (~$80/season); serves ~20,000 via AAAs.

Benefits
Vouchers (~$80/season) for produce at farmers’ markets

Frequently Asked Questions about Aspire Adult Family Home

Is Aspire Adult Family Home in a walkable area?

Aspire Adult Family Home has a walk score of 59. Moderately walkable. Some errands can be accomplished on foot, with a mix of nearby amenities.

What is the occupancy rate at Aspire Adult Family Home?

Aspire Adult Family Home's occupancy is 76.2%.

Are there photos of Aspire Adult Family Home?

Yes — there are 4 photos of Aspire Adult Family Home in the photo gallery on this page.

What is the phone number of Aspire Adult Family Home?

(206) 429-5256 will put you in contact with the team at Aspire Adult Family Home.

Is Aspire Adult Family Home Medicare or Medicaid certified?

Yes — Aspire Adult Family Home is a CMS-certified provider of Medicare and Medicaid.

Guides for Better Senior Living

Care Cost Calculator: See Prices in Your Area

Nursing Home Data Explorer

Don’t Wait Too Long: 7 Red Flag Signs Your Parent Needs Assisted Living Now

The True Cost of Assisted Living in 2025 – And How Families Are Paying For It

Understanding Senior Living Costs: Pricing Models, Discounts & Financial Assistance