


Total staff
372
Employees
115
Contractors
257
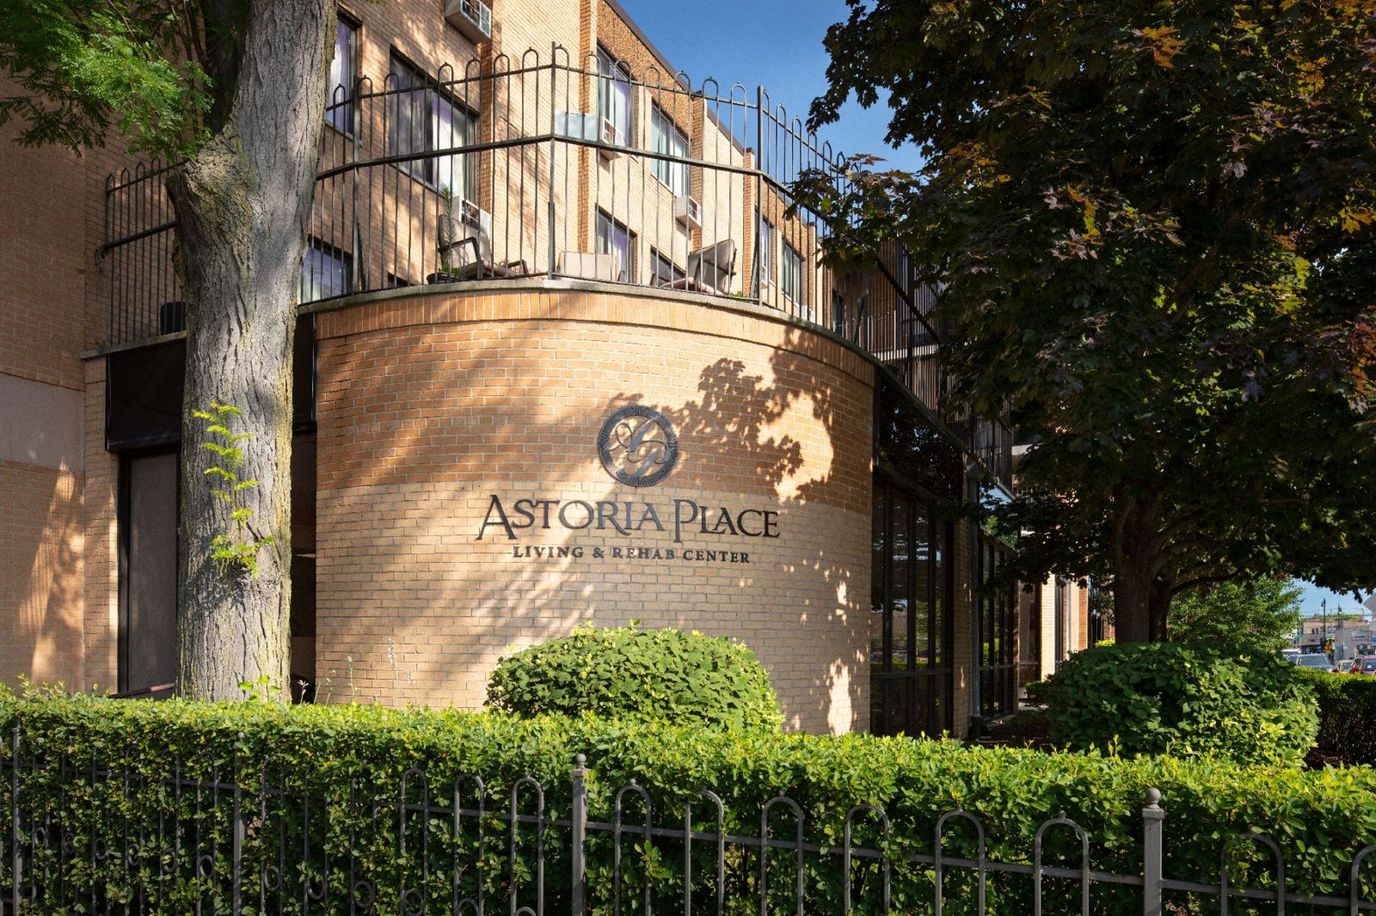
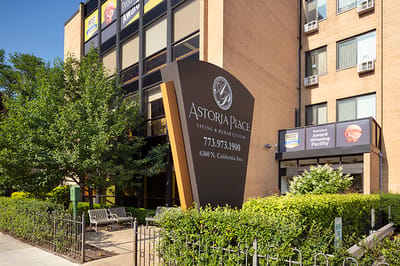


Patricia Davis owns Astoria Place, a 164-bed nursing home at 6300 North California Avenue in Chicago’s West Ridge neighborhood. Administrator Ezra directs operations. The facility serves Medicare, Medicaid, and private-pay residents with an average length of stay of 124 days. Occupancy reaches 90.1%, substantially exceeding the Illinois average of 69.3%. Newsweek named Astoria Place among America’s Best Nursing Homes 2026 and awarded a Gold Seal of Approval for Best Nursing Home 2024.
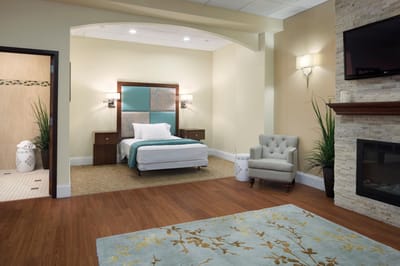
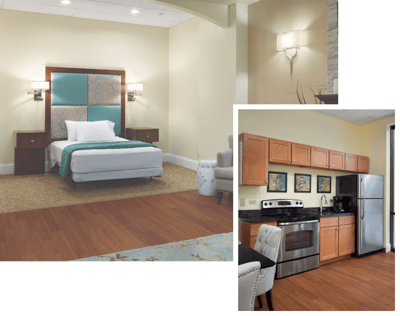
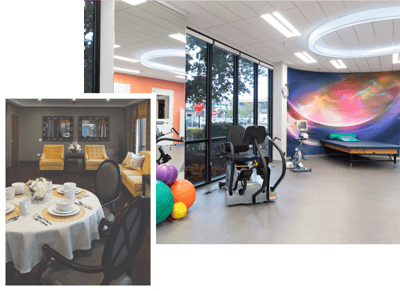
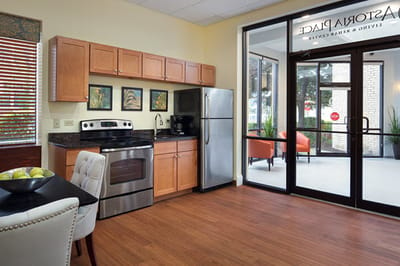
The facility provides rehabilitation services, respite care, memory care, and 24-hour staffing. Specialized programs include healthcare services, short-term rehabilitation, enrichment activities with concierge service, and Russian and Cantonese language programming. Amenities include a library, family dining room, beauty salon, hospitality rooms, personal storage, and cable television. Services encompass wound care, pain management, neuromuscular therapy, and strength-building programs.
The location ranks 28th statewide for walkability (score 92), permitting daily errands without a car. Ascension Saint Joseph hospital sits 5.36 miles away.
CMS ratings stand at 3 stars overall (19.0% above state), 3 stars for health inspection (8.1% above state), and 4 stars for Quality Measures (42.1% above state); an exceptional outcome.
Staffing rates 3 stars despite complexity in composition: total nursing hours average 2 hours 22 minutes daily (23% below state average), yet registered nurse hours reach 57 minutes daily, 30% above state, with weekend RN coverage at 1 hour daily (76% above state). The 372-person workforce includes 257 contractors (69.1% contractor use).
Functional decline of 12.2 runs 35% better than peers. Walking ability worsens in 6.2% of long-stay residents (66% better). Pressure ulcers affect 3.6% (32% better); urinary tract infections occur in 0.6% (69% better).
Yet depressive symptoms present in 94.8% of long-stay residents; 97% above state average. Hospitalizations run 42% lower than peers, and ED visits run 35% lower.
Short-stay discharge outcomes show strength: 57.9% return successfully to home (14% better), and 67.4% achieve expected self-care ability at discharge (25% better). Falls with major injury remain at 0.0%.
A $7,000 federal penalty was assessed March 27, 2025.
Financial data shows operating loss of $1.7 million with payroll at 33.8% of revenue, which is substantially below well-run benchmarks of 54–67%.
Astoria Place combines strong rehabilitation outcomes and excellent walkability with severe long-stay depression prevalence and ongoing financial deficits.
| Staff type | Hours / Day / Resident | vs state avg |
|---|---|---|
|
Registered Nurse (RN)
| 57m per day | ▲ 31% State avg: 44m per day · National avg: 41m per day |
|
LPN / LVN
| 26m per day | ▼ 32% State avg: 38m per day · National avg: 52m per day |
|
Nurse Aide
| 1h 53m per day | ▼ 12% State avg: 2h 8m per day · National avg: 2h 21m per day |
|
Weekend Total Nursing
| 3h 11m per day | ▲ 3% State avg: 3h 5m per day · National avg: 3h 26m per day |
|
Physical Therapist
| 2m per day | ▼ 28% State avg: 3m per day · National avg: 4m per day |
|
Weekend RN
| 1h 1m per day | ▲ 80% State avg: 34m per day · National avg: 29m per day |
Reporting period: October 1 – December 31, 2025 (Q4 2025). Source: CMS Payroll-Based Journal report.
Manages medical care and health needs.
Assists with medical care and medications.
Helps with daily care and mobility.
Total hours from contractors
7,475 contractor hours this quarter
| Certified Nursing Assistant | 65 | 176 | 241 | 25,825 | 92 | 100% | 7.2 |
| Registered Nurse | 17 | 50 | 67 | 9,311 | 92 | 100% | 8.3 |
| Licensed Practical Nurse | 12 | 11 | 23 | 5,727 | 92 | 100% | 8.5 |
| Clinical Nurse Specialist | 7 | 0 | 7 | 3,325 | 91 | 99% | 5.9 |
| Other Dietary Services Staff | 5 | 0 | 5 | 2,244 | 92 | 100% | 7.8 |
| Dental Services Staff | 4 | 0 | 4 | 899 | 90 | 98% | 5.5 |
| Nurse Practitioner | 1 | 0 | 1 | 510 | 90 | 98% | 5.7 |
| Dietitian | 1 | 0 | 1 | 502 | 89 | 97% | 5.6 |
| Respiratory Therapy Technician | 0 | 5 | 5 | 494 | 67 | 73% | 7.4 |
| Administrator | 1 | 0 | 1 | 494 | 88 | 96% | 5.6 |
| Mental Health Service Worker | 1 | 0 | 1 | 490 | 87 | 95% | 5.6 |
| Physical Therapy Aide | 0 | 1 | 1 | 394 | 60 | 65% | 6.6 |
| Speech Language Pathologist | 0 | 2 | 2 | 388 | 56 | 61% | 6.9 |
| Qualified Social Worker | 0 | 4 | 4 | 368 | 49 | 53% | 7.4 |
| RN Director of Nursing | 1 | 0 | 1 | 192 | 54 | 59% | 3.6 |
| Physical Therapy Assistant | 0 | 8 | 8 | 185 | 41 | 45% | 4.5 |
Includes penalties issued in 2025
Federal penalties imposed by CMS for regulatory violations, including civil money penalties (fines) and denials of payment for new Medicare/Medicaid admissions.
Source: CMS Penalties Database (Data as of Jan 2026)
Illinois average: $143K
Illinois average: 3.0
Illinois average: 1.1
Penalties are imposed by CMS for violations of federal nursing home regulations.
1 penalty in the past 3 years
Mar 27, 2025 · $7K
Last updated: Jan 2026
These measures show how residents usually do over time at this home, based on health outcomes and preventive care.
Illinois average: 9.7
Illinois average: 18.6
Illinois average: 15.5%
Illinois average: 18.4%
Illinois average: 21.6%
Illinois average: 3.4%
Illinois average: 5.3%
Illinois average: 1.8%
Illinois average: 6.5%
Illinois average: 48.1%
Illinois average: 20.2%
Illinois average: 89.2%
Illinois average: 91.6%
Illinois average: 2.05
Illinois average: 2.25
Illinois average: 68.3%
Illinois average: 2.3%
Illinois average: 63.0%
Illinois average: 26.2%
Illinois average: 14.0%
Illinois average: 0.8%
Illinois average: 53.7%
Illinois average: 50.6%
Quality measures are calculated from Minimum Data Set (MDS) assessments. For most measures, lower percentages indicate better care quality.
18% of new residents, usually for short-term rehab.
67% of new residents, often for short stays.
15% of new residents, often for long-term daily care.
Source: CMS Long-Term Care Facility Characteristics (Data as of Jan 2026)
Residents meet regularly to discuss policies, care quality, and activities
Organized group of residents that meets regularly to discuss facility policies, quality of life, and activities.
Data sourced from CMS Long-Term Care Facility Characteristics quarterly report. Payer mix reflects the current resident census by primary payment source.
Historical financial and operational data for Astoria Place from 2011–2023, based on CMS SNF Cost Reports.
Key figures below are for fiscal year ending in 12/2023.
Based on CMS SNF Cost Report for fiscal year ending in 12/2023.
Residents typically stay for brief periods, with frequent admissions and discharges throughout the year.
Most new residents arrive under private pay (67% of admissions), and a typical private pay stay runs around 4 - 5 months.
Coverage residents most often arrive under.
Coverage residents most often leave under.
![]() 8.5 miles from city center
8.5 miles from city center
![]() Estimated distance in miles from Chicago's city center to Astoria Place's address, calculated via Google Maps.
— 5.36 miles to nearest hospital (Ascension Saint Joseph - Chicago)
Estimated distance in miles from Chicago's city center to Astoria Place's address, calculated via Google Maps.
— 5.36 miles to nearest hospital (Ascension Saint Joseph - Chicago)
Add your location
Info below is compiled from CMS reports & the IL Dept. of Public Health (IDPH), senior community websites & trusted data sources such as Walk Score & BBB.
Communities are listed from highest to lowest based on our ranking methodology.
| Mercy Circle Senior Living | NH AL IL MC SNF | Chicago (Mount Greenwood) | 43
Facility
43
IL AVG
85
Rank
#330 / 419 | - | - | 4.57
Facility
4.57
IL AVG
3.10
Rank
#24 / 155 | -8% | +47% | $0
Facility
$0
IL AVG
$151.3k
Rank
#1 / 155 | 16
Facility
16
IL AVG
36.8
Rank
#24 / 155 | 4.0
Facility
4.0
IL AVG
3.7
Rank
#105 / 155 | - | 22 | - |
44
Facility
44
IL AVG
51
Rank
#392 / 648 | Sisters Of Mercy Of The Americas West Midwest Community Inc | $10.3MFiscal year ending 06/2024
Facility
$10.3MFiscal year ending 06/2024
IL AVG
$12.2M
Rank
#95 / 154 | $5.1MFiscal year ending 06/2024
Facility
$5.1MFiscal year ending 06/2024
IL AVG
$4.8M
Rank
#112 / 154 | 49.8%Fiscal year ending 06/2024
Facility
49.8%Fiscal year ending 06/2024
IL AVG
44.3%
Rank
#105 / 154 | 146174 | ||||
| The Selfhelp Home Senior Living Community | NH AL IL RC SNF | Chicago (Uptown) | 72
Facility
72
IL AVG
85
Rank
#204 / 419 |
81.9%
Facility
81.9%
IL AVG
73
Rank
#63 / 157 | +12% | 5.56
Facility
5.56
IL AVG
3.10
Rank
#8 / 155 | +44% | +79% | $0
Facility
$0
IL AVG
$151.3k
Rank
#1 / 155 | 21
Facility
21
IL AVG
36.8
Rank
#41 / 155 | 5.3
Facility
5.3
IL AVG
3.7
Rank
#138 / 155 | 1 | 59 | A+ |
92
Facility
92
IL AVG
51
Rank
#28 / 648 | Marvin Rubin | $9.3MFiscal year ending 09/2023
Facility
$9.3MFiscal year ending 09/2023
IL AVG
$12.2M
Rank
#76 / 154 | $7.0MFiscal year ending 09/2023
Facility
$7.0MFiscal year ending 09/2023
IL AVG
$4.8M
Rank
#72 / 154 | 75.3%Fiscal year ending 09/2023
Facility
75.3%Fiscal year ending 09/2023
IL AVG
44.3%
Rank
#59 / 154 | 146009 | ||||
| The Clare | NH AL IL MC SNF | Chicago (Rush & Division) | 49
Facility
49
IL AVG
85
Rank
#294 / 419 |
92.2%
Facility
92.2%
IL AVG
73
Rank
#23 / 157 | +26% | 3.69
Facility
3.69
IL AVG
3.10
Rank
#48 / 155 | +61% | +19% | $0
Facility
$0
IL AVG
$151.3k
Rank
#1 / 155 | 13
Facility
13
IL AVG
36.8
Rank
#19 / 155 | 2.6
Facility
2.6
IL AVG
3.7
Rank
#25 / 155 | 1 | 45 | A+ |
100
Facility
100
IL AVG
51
Rank
#1 / 648 | County Of Fulton | $4.4MFiscal year ending 11/2023
Facility
$4.4MFiscal year ending 11/2023
IL AVG
$12.2M
Rank
#147 / 154 | $3.6MFiscal year ending 11/2023
Facility
$3.6MFiscal year ending 11/2023
IL AVG
$4.8M
Rank
#146 / 154 | 81.8%Fiscal year ending 11/2023
Facility
81.8%Fiscal year ending 11/2023
IL AVG
44.3%
Rank
#14 / 154 | 146151 | ||||
| Asbury Gardens | NH HOS MC PC SNF | North Aurora (Airport Road) | 75
Facility
75
IL AVG
85
Rank
#193 / 419 |
76.5%
Facility
76.5%
IL AVG
73
Rank
#78 / 157 | +5% | 4.00
Facility
4.00
IL AVG
3.10
Rank
#41 / 155 | +6% | +29% | $6.4k
Facility
$6.4k
IL AVG
$151.3k
Rank
#66 / 155 | 21
Facility
21
IL AVG
36.8
Rank
#41 / 155 | 3.5
Facility
3.5
IL AVG
3.7
Rank
#72 / 155 | - | 57 | A+ |
38
Facility
38
IL AVG
51
Rank
#434 / 648 | Abraham Diamond | $6.7MFiscal year ending 12/2023
Facility
$6.7MFiscal year ending 12/2023
IL AVG
$12.2M
Rank
#137 / 154 | $3.8MFiscal year ending 12/2023
Facility
$3.8MFiscal year ending 12/2023
IL AVG
$4.8M
Rank
#128 / 154 | 56.5%Fiscal year ending 12/2023
Facility
56.5%Fiscal year ending 12/2023
IL AVG
44.3%
Rank
#28 / 154 | 146170 | ||||
| Astoria Place | NH MC RC SNF | Chicago (West Ridge) | 164
Facility
164
IL AVG
85
Rank
#40 / 419 |
91.0%
Facility
91.0%
IL AVG
73
Rank
#25 / 157 | +25% | 2.37
Facility
2.37
IL AVG
3.10
Rank
#128 / 155 | +27% | -23% | $4.8k
Facility
$4.8k
IL AVG
$151.3k
Rank
#65 / 155 | 31
Facility
31
IL AVG
36.8
Rank
#81 / 155 | 3.1
Facility
3.1
IL AVG
3.7
Rank
#49 / 155 | 2 | 149 | - |
92
Facility
92
IL AVG
51
Rank
#28 / 648 | Patricia Davis | $15.5MFiscal year ending 12/2023
Facility
$15.5MFiscal year ending 12/2023
IL AVG
$12.2M
Rank
#43 / 154 | $5.9MFiscal year ending 12/2023
Facility
$5.9MFiscal year ending 12/2023
IL AVG
$4.8M
Rank
#70 / 154 | 38.2%Fiscal year ending 12/2023
Facility
38.2%Fiscal year ending 12/2023
IL AVG
44.3%
Rank
#137 / 154 | 145634 |
Astoria Place is located in Chicago, Illinois.
Here are the financial assistance programs available to residents in Illinois.
Astoria Place is in the West Ridge neighborhood.
Astoria Place has a walk score of 92. Walker's paradise. Daily errands do not require a car, with many shops and services nearby.
Astoria Place's occupancy is 90.1%.
No, Astoria Place has a no-pet policy.
Astoria Place is registered as a for-profit.
Yes — there are 15 photos of Astoria Place in the photo gallery on this page.
Astoria Place is located at 6300 N. California Avenue, Chicago, IL 60659.
Care Cost Calculator: See Prices in Your Area
Nursing Home Data Explorer
Don’t Wait Too Long: 7 Red Flag Signs Your Parent Needs Assisted Living Now
The True Cost of Assisted Living in 2025 – And How Families Are Paying For It
Understanding Senior Living Costs: Pricing Models, Discounts & Financial Assistance


