• Home
  • Nursing Home in Florida
Astoria Senior Living
Nursing Home, Assisted Living, Nursing Care & Respite Care · Winter Haven, FL
CMS overall rating Info CMS (the Centers for Medicare & Medicaid Services) is the federal agency that rates nursing home quality. Its Overall Rating runs from 1 to 5 stars, combining health inspections, staffing, and quality measures, with inspections weighted most heavily.

Astoria Senior Living

Nursing Home, Assisted Living, Nursing Care & Respite Care · Winter Haven, FL
CMS overall rating Info CMS (the Centers for Medicare & Medicaid Services) is the federal agency that rates nursing home quality. Its Overall Rating runs from 1 to 5 stars, combining health inspections, staffing, and quality measures, with inspections weighted most heavily.
Calculator: See prices in your area
Astoria Senior Living accepts Veteran Affairs Benefits, Medicare, and private pay.

Overview of Astoria Senior Living

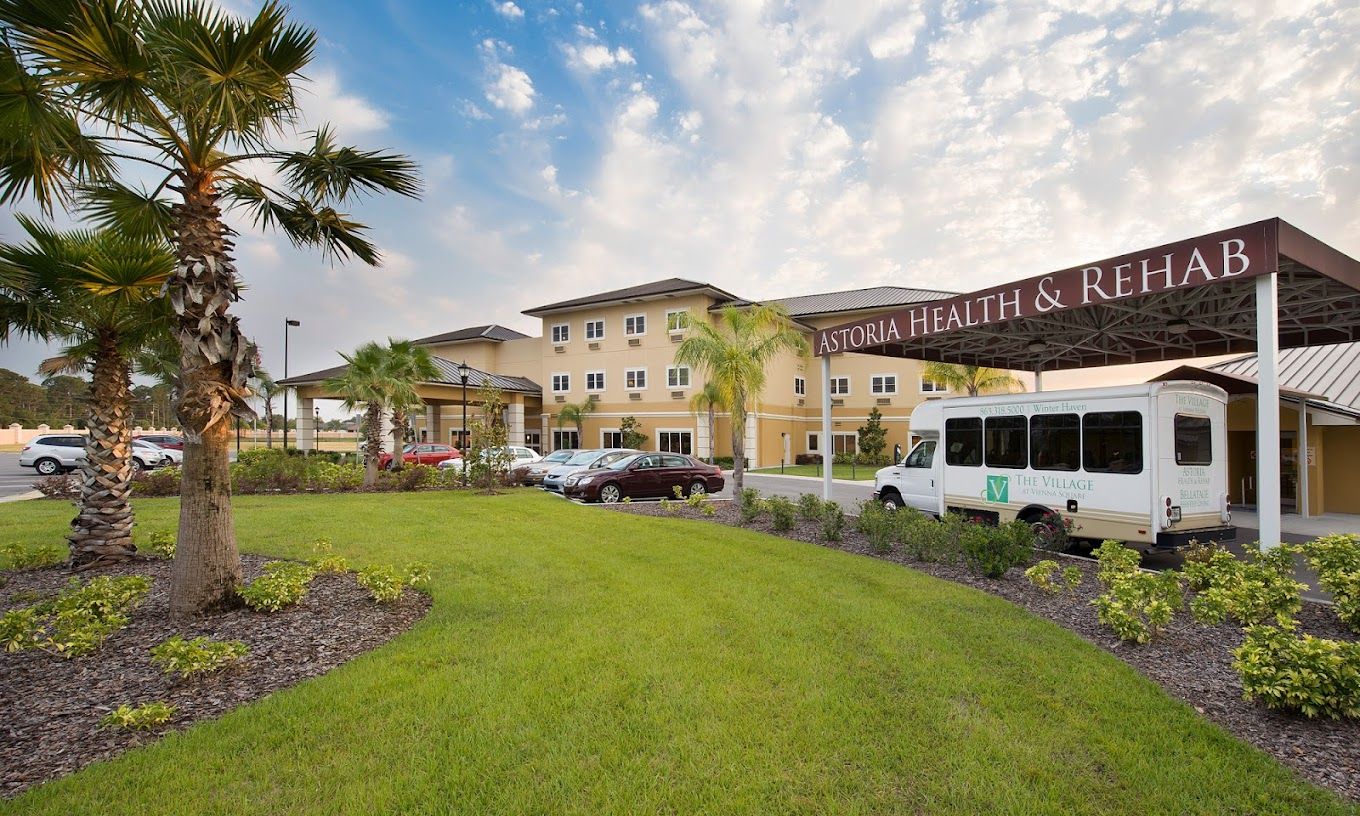
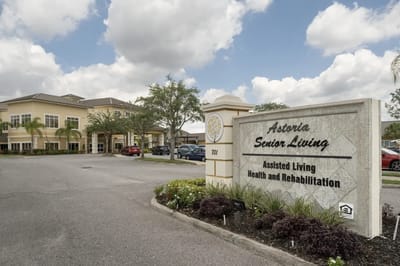
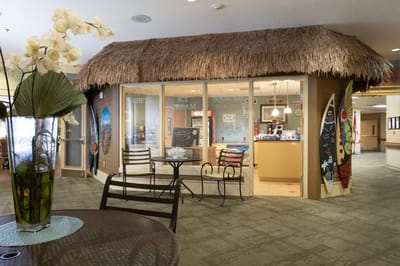
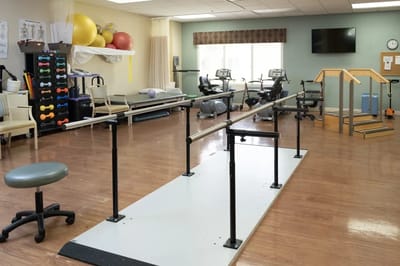
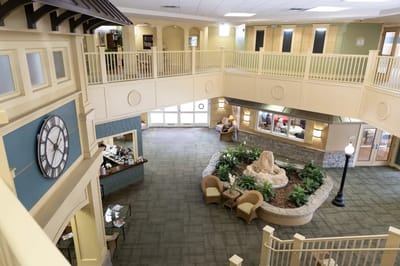
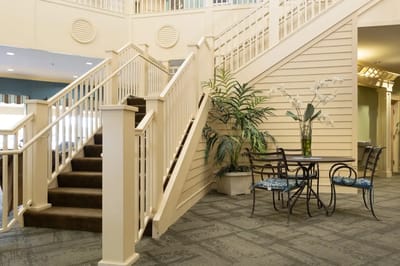
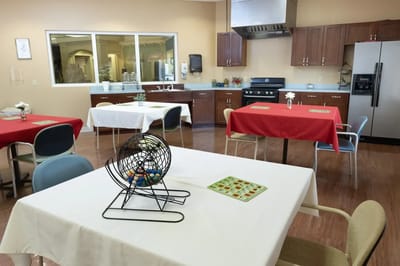
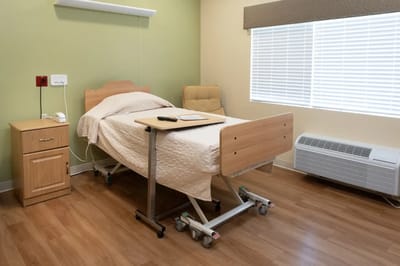
Set in the beautiful Overlook Drive, Winter Haven, FL, Astoria Senior Living is an astounding senior living community providing assisted living, skilled nursing, and rehabilitation. Residents retain their independence while receiving top-tier care and support for their special needs and aspirations 24/7. The community empowers residents to flourish with personalized care services that match the lifestyle of their dreams.

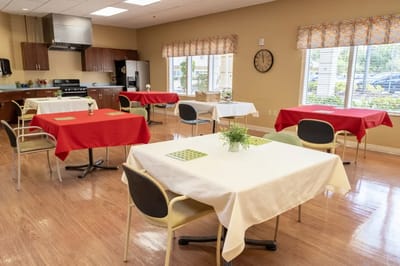
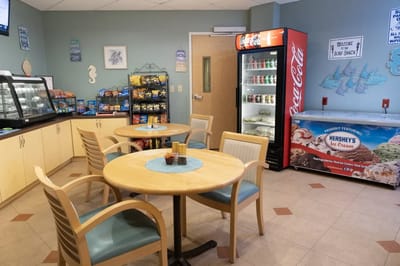
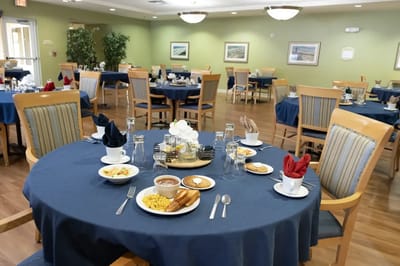
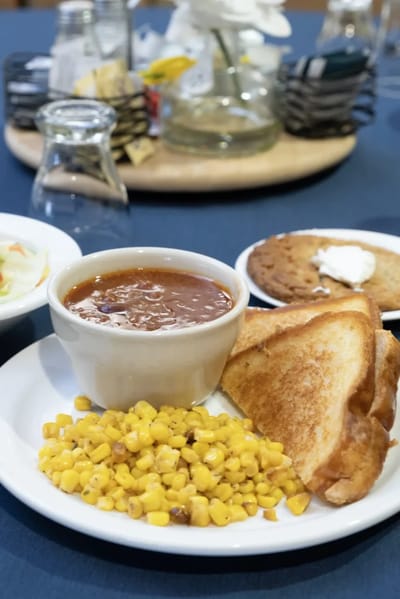
Have fun and do the things you love with a carefully curated calendar of fun activities and programs, highlighting residents’ interests and strengths. Residents also enjoy mealtimes with diverse dining options catering to dietary needs and tastes. Thrive and live life to the fullest with a trusted community promoting a vibrant and welcoming environment.

Quality ratings

Measured by Centers for Medicare & Medicaid Services (CMS)

Overall rating Info The Overall CMS Rating combines results from health inspections, staffing levels and quality measures. Health inspections carry the most weight. Staffing and quality scores can increase or decrease the final rating based on performance compared to state and national standards.
Health Inspection Info Based on the results of the facility's three most recent standard inspections and any complaint investigations. CMS reviews the number, scope, and severity of deficiencies, with more recent findings weighted more heavily.
Staffing Info Measures average nursing staff hours per resident per day, including Registered Nurses (RNs) and total nursing staff. Ratings are adjusted based on the level of care residents require and are compared to state and national benchmarks.
Quality Measures Info Based on clinical and physical health indicators reported to CMS, such as hospital readmissions, falls, pressure ulcers, and improvements in mobility. These measures reflect how well residents' health needs are being managed.

Staffing hours breakdown

Info Daily nursing hours per resident by staff type, reported to CMS. Higher is generally better — compare this facility to state and national averages to see where staffing stands.

Hours per resident per day — compared to state averages

Total nursing care / resident Info Total adjusted nursing hours per resident per day, combining RN, LPN, and aide time. CMS adjusts this for case-mix so facilities can be fairly compared.
3h 50m per day
Rank #145 / 253Nurse hours — State benchmarkedThis home is ranked 145th out of 253 homes in Florida. Shows adjusted nurse hours per resident per day benchmarked to the Florida average, with a ranking across 253 Florida facilities. More hours mean more direct care. The national average is about 3.5 hrs; below 3.0 is a red flag.Rankings are based only on facilities in Florida that report data for that category. Facilities without available data are excluded from the ranking.Click the rank badge to see the full State ranking.Click here to see the full State ranking.
vs avg
Staff typeHours / Day / Residentvs state avg
Registered Nurse (RN) Info RNs hold the highest nursing license and can assess residents, interpret test results, and direct care plans. More RN hours per day often signals stronger clinical oversight and faster response to health changes. 36m per day
LPN / LVN Info Licensed Practical Nurses (LPNs) or Licensed Vocational Nurses (LVNs) deliver routine hands-on care — medication administration, wound dressing, and monitoring vital signs. They work under RN supervision and make up a large share of daily bedside care. 1h 9m per day
Nurse Aide Info Certified Nurse Aides (CNAs) provide the most direct day-to-day assistance: bathing, dressing, feeding, and mobility. Nurse aide hours are typically the largest staffing category and directly affect residents' quality of life. 2h 34m per day
Weekend Total Nursing Info Combined nursing hours (RN + LPN + Nurse Aide) per resident per day on weekends. Staffing often drops on weekends — this figure reveals whether the facility maintains adequate coverage outside of weekday hours. 3h 56m per day
Physical Therapist Info Hours per resident per day provided by licensed Physical Therapists (PTs) or PT Assistants. PT services help residents recover mobility after injury or illness and are especially important for post-acute (short-stay) rehabilitation. 2m per day
Weekend RN Info Registered nurse hours specifically on weekends. Facilities sometimes reduce RN presence on Saturdays and Sundays — a low weekend RN figure compared to weekday hours can indicate reduced clinical oversight when most administrative staff are absent. 25m per day

Capacity and availability

Avg. Length of Stay
125 days
Bed community size
45-bed community Rank #795 / 1074Bed count — State benchmarkedThis home is ranked 795th out of 1074 homes in Florida. Shows this facility's certified or reported bed count compared to other Florida facilities. Larger communities may offer more amenities, programs, and on-site services for residents and families.Rankings are based only on facilities in Florida that report data for that category. Facilities without available data are excluded from the ranking.Click the rank badge to see the full State ranking.Click here to see the full State ranking.
A moderately sized community that may balance personal attention with shared amenities and social activities.
Walk Score
Walk Score: 14 / 100 Rank #1185 / 1486Walk Score — State benchmarkedThis home is ranked 1185th out of 1486 homes in Florida. Shows how walkable this facility's neighborhood is compared to the average Walk Score across Florida facilities. Higher scores benefit residents, families, and staff.Rankings are based only on facilities in Florida that report data for that category. Facilities without available data are excluded from the ranking.Click the rank badge to see the full State ranking.Click here to see the full State ranking.
Car-dependent. Most errands require a car, with limited nearby walkable options.

About this community

Occupancy

Occupancy rate
87%
Rank #158 / 258Occupancy rate — State benchmarkedThis home is ranked 158th out of 258 homes in Florida. Shows this facility's occupancy rate versus the Florida average, with its Statewide rank out of 258. Higher occupancy signals strong local demand and financial stability.Rankings are based only on facilities in Florida that report data for that category. Facilities without available data are excluded from the ranking.Click the rank badge to see the full State ranking.Click here to see the full State ranking.
Similar to the Florida average: 84.3%
Occupied beds
39 / 45
Average occupied beds in Florida homes 108 beds

License Details

Facility TypeAssisted Living Facility
StatusLicensed
IssuanceJanuary 19, 2025
ExpirationJanuary 18, 2027
CountyPolk
License Number11898

Ownership & Operating Entity

Astoria Senior Living is legally operated by Lake Wales Health Care Operations Company, Llc, and administered by Dena Rene Goldberg.

Management CompanyTENDER LOVING CARE MANAGEMENT INC
Profit StatusFor-profit

Type Of Units

Private
45 units
Total beds
45 units

Staffing

Key information about the people who lead and staff this community.

Languages Spoken

Creole English Spanish

Therapy & Rehabilitation

2 services
Rehabilitation Services
Respite Care

Staffing & Medical

1 service
24-Hour Staffing

Amenities & Lifestyle

Health Care Supervision And Medication Administration
Daily Chef-Prepared Meals And Restaurant Style-Dining
On-Site Nurse And 24/7 Professional Staff
Personal Care As Needed
Bathing And Dressing Assistance
Specialized Programming
Including Evenings And Weekends
Personal Transportation
Laundry
Housekeeping And Maintenance Service
Regular Safety Checks
Family Events And Support Programs
Special Services Include Trial Or Respite Stays
And Guest Dining
Specific ProgramsGallery & Tours

Contact Astoria Senior Living

Inspection History

In Florida, the Agency for Health Care Administration (AHCA) is the primary authority that conducts unannounced inspections and completes official health quality reports for all healthcare facilities.

Since 2012 · 14 years of data 18 citations 16 inspections
Inspection Score Info A composite 0–100 score combining this facility's inspections, citations, complaints, and enforcement actions relative to the Florida state average. The score below shows how many points this facility sits above or below the typical Florida assisted living residence score (the benchmark); higher is better.

10 points above the Florida average for assisted living residences (83/100)

Rank #203 / 876 in Florida Inspection Score — State benchmarked This home is ranked 203rd out of 876 homes in Florida. Shows this facility's inspection score compared to the Florida average among 876 comparable communities in the ranking pool. Rankings are based only on facilities in Florida that report data for that category. Facilities without available data are excluded from the ranking. Inspection score: 93 out of 100. Letter grade A. 10 points above the Florida average for assisted living residences (83/100)

Inspection Scorecard Info This scorecard compares key inspection, citation, and complaint metrics at this facility against the Florida state average. Metrics rated ≥15% worse than average are highlighted in red; those ≥15% better are highlighted in green.

Since 2012 vs. Florida state average
Overall vs. FL average 1 Worse Metrics worse than Florida average:
• Inspection citation rate (21% above)
5 Better Metrics better than Florida average:
• Total citations (45% below)
• Citations per year (46% below)
• Citations per inspection (15% below)
• Total inspections (38% below)
• Inspections with citations (25% below)
Latest Inspection September 29, 2025 Complaint Investigation

Citations Info Citations are formal regulatory issues recorded during state inspections.

This FacilityFL Averagevs. FL Avg
Total citations Info Formal regulatory issues recorded by inspectors across all inspection types. 1833 This facility has 45% fewer total citations than a typical Florida assisted living residence (18 vs. FL avg 33).↓ 45% better Rank #263 / 919 Total citations — State benchmarked This home is ranked 263rd out of 919 homes in Florida. Shows this facility's total citations compared to the Florida average among 919 comparable communities in the ranking pool. Rankings are based only on facilities in Florida that report data for that category. Facilities without available data are excluded from the ranking.
Citations per year Info Average citations per year since 2012. 1.32.4 This facility has 46% fewer citations per year than a typical Florida assisted living residence (1.3 vs. FL avg 2.4).↓ 46% better
Citations per inspection Info Average citations per inspection. 1.11.3 This facility has 15% fewer citations per inspection than a typical Florida assisted living residence (1.1 vs. FL avg 1.3).↓ 15% better Rank #331 / 919 Citations per inspection — State benchmarked This home is ranked 331st out of 919 homes in Florida. Shows this facility's citations per inspection compared to the Florida average among 919 comparable communities in the ranking pool. Rankings are based only on facilities in Florida that report data for that category. Facilities without available data are excluded from the ranking.

Inspections Info State inspections evaluate whether the facility meets health and safety standards.

This FacilityFL Averagevs. FL Avg
Total inspections Info Combined count of all routine and focused inspections. Excludes complaint investigations. 1626 This facility has 38% fewer total inspections than a typical Florida assisted living residence (16 vs. FL avg 26).↓ 38% better
Inspections with citations Info Inspections that resulted in at least one regulatory citation. 1216 This facility has 25% fewer inspections with citations than a typical Florida assisted living residence (12 vs. FL avg 16).↓ 25% better
Inspection citation rate Info Percentage of inspections that resulted in at least one citation. 75%62% This facility has 13 percentage points higher inspection citation rate than a typical Florida assisted living residence (75% vs. FL avg 62%).↑ 13% worse Rank #762 / 919 Inspection citation rate — State benchmarked This home is ranked 762nd out of 919 homes in Florida. Shows this facility's % of inspections with citations compared to the Florida average among 919 comparable communities in the ranking pool. Rankings are based only on facilities in Florida that report data for that category. Facilities without available data are excluded from the ranking.

Inspection Reports Summary Info An editor-reviewed summary of the themes and findings across this facility's recent inspection reports.

  • September 29, 2025 complaint inspection found no deficiencies and no complaints substantiated.
  • December 19, 2024 routine inspection cited three deficiencies for staffing standards and staff training.
  • Past inspections repeatedly cited deficiencies in staff training and staffing standards from 2012 through 2024.

Health Inspection History

Inspections since 2020
Total health inspections 4

State average N/A


Last Health inspection on Mar 2024

Total health citations
28 Rank #198 / 252Health citations — State benchmarkedThis home is ranked 198th out of 252 homes in Florida. Shows this facility's total health deficiency citations benchmarked to the Florida State average, with a ranking across all 252 FL facilities. Lower citation counts earn a better rank.Rankings are based only on facilities in Florida that report data for that category. Facilities without available data are excluded from the ranking.Click the rank badge to see the full State ranking.Click here to see the full State ranking.

State average N/A

Citations per inspection
7 Rank #221 / 252Citations per inspection — State benchmarkedThis home is ranked 221st out of 252 homes in Florida. Shows average deficiency citations per CMS inspection for this facility versus the Florida mean across 252 facilities with citation data. Lower is better.Rankings are based only on facilities in Florida that report data for that category. Facilities without available data are excluded from the ranking.Click the rank badge to see the full State ranking.Click here to see the full State ranking.

State average N/A


Health citations are formal notices following inspections when they fail to comply with safety and care standards.

26 of 28 citations resulted from standard inspections; and 2 of 28 resulted from complaint investigations.

Breakdown of citation severity (last 6 years)
Critical health citations
0
In line with State average

State average: N/A


Serious health citations
0
In line with State average

State average: N/A

0 critical citations State average: N/A

0 serious citations State average: N/A

28 moderate citations State average: N/A

0 minor citations State average: N/A
Citations history (last 6 years)
Infection Control moderate citation Mar 26, 2024
Corrected

Nutrition moderate citation Mar 26, 2024
Corrected

Pharmacy moderate citation Mar 26, 2024
Corrected

Pharmacy moderate citation Mar 26, 2024
Corrected

Staffing Data

Reporting period: October 1 – December 31, 2025 (Q4 2025). Source: CMS Payroll-Based Journal report.

Total staff 195
Employees 167
Contractors 28
Staff to resident ratio 1.51 : 1
0% compared with State average

State average ratio: 0 : 0

Avg staff/day 82
Average shift 7.7 hours
0% compared with State average

State average: 0 hours

Total staff hours (quarter) 57,979

Nursing staff breakdown

Q4 2025 · Oct 1 – Dec 31 More info This data comes from the CMS Payroll-Based Journal report covering October 1 – December 31, 2025.
Registered Nurse

Manages medical care and health needs.

RN Staff Info All 19 RN Staff are full-time employees. No contractors work on this role. 19
Average shift length Info Average shift length. Calculated as total hours divided by days worked and average staff per day. 7.5 hours
Licensed Practical Nurse

Assists with medical care and medications.

LPN Staff Info All 35 LPN Staff are full-time employees. No contractors work on this role. 35
Average shift length Info Average shift length. Calculated as total hours divided by days worked and average staff per day. 8.1 hours
Certified Nursing Assistant

Helps with daily care and mobility.

CNA Staff Info All 92 CNA Staff are full-time employees. No contractors work on this role. 92
Average shift length Info Average shift length. Calculated as total hours divided by days worked and average staff per day. 7.7 hours

Contractor staffing

Q4 2025 · Oct 1 – Dec 31 More info This data comes from the CMS Payroll-Based Journal report covering October 1 – December 31, 2025.

Total hours from contractors

7.4%

4,272 contractor hours this quarter

Speech Language Pathologist: 11 Physical Therapy Aide: 6 Physical Therapy Assistant: 6 Qualified Social Worker: 3 Respiratory Therapy Technician: 2

Staff by category

Q4 2025 · Oct 1 – Dec 31 More info This data comes from the CMS Payroll-Based Journal report covering October 1 – December 31, 2025.
Certified Nursing Assistant9209229,73792100%7.7
Licensed Practical Nurse3503511,36892100%8.1
Registered Nurse190195,34792100%7.5
RN Director of Nursing4041,9908087%7.6
Physical Therapy Aide0661,5588390%7.6
Other Dietary Services Staff4041,4338289%7.5
Speech Language Pathologist011111,4168390%6.2
Mental Health Service Worker5051,2096773%7.9
Clinical Nurse Specialist5051,1976874%7.9
Qualified Social Worker0335586773%7.2
Dental Services Staff1015146267%8.3
Nurse Practitioner1014725964%8
Administrator1014405560%8
Physical Therapy Assistant0664186571%4.7
Respiratory Therapy Technician0223227177%4.1
92 Certified Nursing Assistant
% of Days 100%
35 Licensed Practical Nurse
% of Days 100%
19 Registered Nurse
% of Days 100%
4 RN Director of Nursing
% of Days 87%
6 Physical Therapy Aide
% of Days 90%
4 Other Dietary Services Staff
% of Days 89%
11 Speech Language Pathologist
% of Days 90%
5 Mental Health Service Worker
% of Days 73%
5 Clinical Nurse Specialist
% of Days 74%
3 Qualified Social Worker
% of Days 73%
1 Dental Services Staff
% of Days 67%
1 Nurse Practitioner
% of Days 64%
1 Administrator
% of Days 60%
6 Physical Therapy Assistant
% of Days 71%
2 Respiratory Therapy Technician
% of Days 77%

Penalties and fines

Federal penalties imposed by CMS for regulatory violations, including civil money penalties (fines) and denials of payment for new Medicare/Medicaid admissions.

Source: CMS Penalties Database

No penalties in the past 3 years

No civil money penalties or payment denials were reported in the last 3 years.

Quality of care over time

These measures show how residents usually do over time at this home, based on health outcomes and preventive care.

High-risk clinical events score Info A composite score based on pressure ulcers, falls with injury, weight loss, walking ability decline, and activities of daily living decline. 6.4
13% better than State average

State average: 7.4

Functional decline score Info A composite score based on activities of daily living decline, walking ability decline, and incontinence. 15.5
25% worse than State average

State average: 12.4

Long-stay resident measures
Need for Help with Daily Activities Increased Info Percent of long-stay residents whose need for help with daily activities has increased 6.1%
42% better than State average

State average: 10.5%

Walking Ability Worsened Info Percent of long-stay residents whose ability to move independently worsened 15.4%
19% worse than State average

State average: 12.9%

Low Risk Residents with Bowel/Bladder Incontinence Info Percent of low risk long-stay residents who lose control of their bowels or bladder 25.0%
85% worse than State average

State average: 13.5%

Falls with Major Injury Info Percent of long-stay residents experiencing one or more falls with major injury 1.7%
34% better than State average

State average: 2.6%

High Risk Residents with Pressure Ulcers Info Percent of long-stay high risk residents with pressure ulcers 4.1%
23% better than State average

State average: 5.4%

Urinary Tract Infection Info Percent of long-stay residents with a urinary tract infection 0.3%
67% better than State average

State average: 0.9%

Lost Too Much Weight Info Percent of long-stay residents who lose too much weight 4.8%
19% better than State average

State average: 6.0%

Depressive Symptoms Info Percent of long-stay residents who have depressive symptoms 0.9%
72% better than State average

State average: 3.3%

Antipsychotic Use Info Percent of long-stay residents who received an antipsychotic medication 4.8%
40% better than State average

State average: 8.0%

Pneumococcal Vaccine Info Percent of long-stay residents assessed and appropriately given the pneumococcal vaccine 96.2%
In line with State average

State average: 97.7%

Influenza Vaccine Info Percent of long-stay residents assessed and appropriately given the seasonal influenza vaccine 94.6%
5% worse than State average

State average: 99.2%

Short-stay resident measures
Pneumococcal Vaccine Info Percent of short-stay residents assessed and appropriately given the pneumococcal vaccine 92.8%
In line with State average

State average: 94.0%

Antipsychotic medication increase Info Percent of short-stay residents who newly received an antipsychotic medication 0.9%
38% better than State average

State average: 1.5%

Influenza Vaccine Info Percent of short-stay residents assessed and appropriately given the seasonal influenza vaccine 71.3%
25% worse than State average

State average: 94.7%

Breakdown by payment type

Medicare

45% of new residents, usually for short-term rehab.

Typical stay 26 days

Private pay

55% of new residents, often for short stays.

Typical stay 2 - 3 months

Facility Characteristics

Source: CMS Long-Term Care Facility Characteristics (Data as of Jan 2026)

Total residents 129
Medicare
31
24% of residents
Medicaid
78
60.5% of residents
Private pay or other
20
15.5% of residents
Programs & Services
Residents Group

Residents meet regularly to discuss policies, care quality, and activities

Active Resident Council

Organized group of residents that meets regularly to discuss facility policies, quality of life, and activities.

Finances and operations

Based on CMS SNF Cost Report for fiscal year ending in 12/2023.

For-profit
Corporation
Net patient revenue Info Net patient revenue — what the home actually collects for resident care, after contractual allowances, bad debt and discounts are subtracted from its gross charges (CMS cost report, Worksheet G-3). It covers resident care only; money the home earns from other sources is shown separately as "Other income."
$15.4M
Net patient income Info Net patient income: net patient revenue minus the home's total operating expenses. A positive figure means it earns more from resident care than it spends to deliver it; a negative figure means the opposite. It excludes non-operating "other income."
-$1.8M
For-profit Corporation
Net patient revenue Info Net patient revenue — what the home actually collects for resident care, after contractual allowances, bad debt and discounts are subtracted from its gross charges (CMS cost report, Worksheet G-3). It covers resident care only; money the home earns from other sources is shown separately as "Other income."
$15.4M Rank #106 / 257Revenue — State benchmarkedThis home is ranked 106th out of 257 homes in Florida. Shows this facility's annual revenue compared to the Florida average. Higher revenue generally means more resources for staffing and capital — read alongside Payroll %.Rankings are based only on facilities in Florida that report data for that category. Facilities without available data are excluded from the ranking.Click the rank badge to see the full State ranking.Click here to see the full State ranking.
Net patient income Info Net patient income: net patient revenue minus the home's total operating expenses. A positive figure means it earns more from resident care than it spends to deliver it; a negative figure means the opposite. It excludes non-operating "other income."
-$1.8M
Other income Info Money the home earns outside of resident care — such as investments, grants, rentals and other non-operating sources (CMS cost report, Worksheet G-3). It is tracked separately from net patient revenue: it is not part of that figure, and it is not included in net patient income.
$1.5M
Payroll costs Info Staff salaries plus wage-related costs — benefits such as payroll taxes, health insurance and retirement — from the home's own accounting records (CMS cost report, Worksheet A). Contract or agency labor is counted separately, under other operating costs. Rank #96 / 257Payroll — State benchmarkedThis home is ranked 96th out of 257 homes in Florida. Shows total annual staff payroll benchmarked to the Florida average. Higher payroll investment relative to peers often signals better staffing and less reliance on cheaper contract labor.Rankings are based only on facilities in Florida that report data for that category. Facilities without available data are excluded from the ranking.Click the rank badge to see the full State ranking.Click here to see the full State ranking.
$9.2M 59.8% of net patient revenue Info Payroll as a share of revenue: staff salaries and wage-related benefits divided by net patient revenue. A higher figure means more of each revenue dollar goes to staff pay. Rank #126 / 257Payroll % — State benchmarkedThis home is ranked 126th out of 257 homes in Florida. Shows payroll as a percentage of revenue versus the Florida average. Well-run Florida facilities typically land around 49–56% — the top third Statewide. Below 25% may signal understaffing or heavy agency use — read with Staffing ratings.Rankings are based only on facilities in Florida that report data for that category. Facilities without available data are excluded from the ranking.Click the rank badge to see the full State ranking.Click here to see the full State ranking.
Other operating costs Info Everything it costs to run the home apart from payroll — food, utilities, supplies, maintenance, contract labor and administration. Calculated as total operating expense minus payroll (staff salaries and wage-related benefits).
$8.0M
Total costs Info The home's total operating expense for the year — all the costs of running it, salaries included (CMS cost report, Worksheet G-3).
$17.3M

What does this home offer?

Minimum age icon
Minimum age icon

Minimum Age: 55 Years Old

Housing options icon

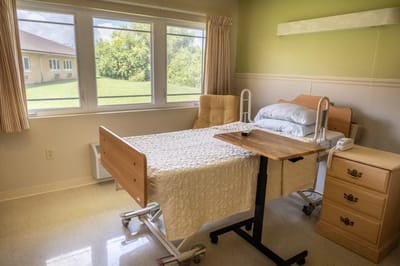
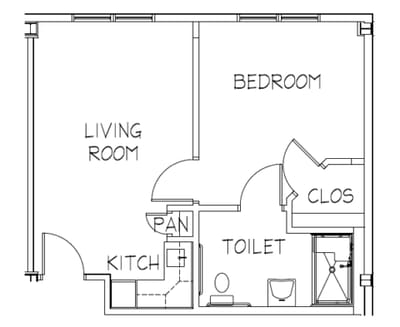
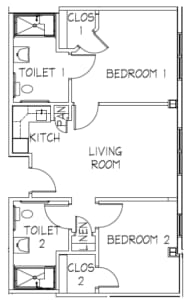
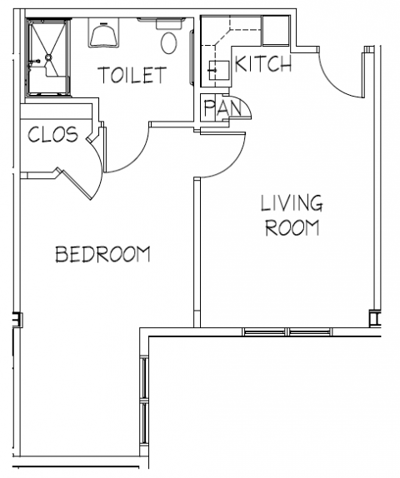
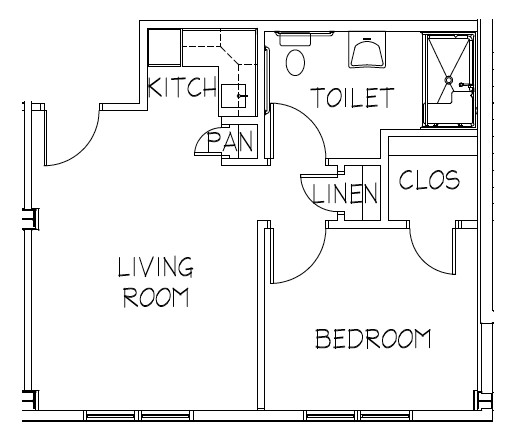
Housing Options: 1 Bed / 2 Bed

Building type icon
Building type icon

Building Type: 3-story

Transportation services icon

Transportation Services

Fitness and recreation icon

Fitness and Recreation

Who this home usually serves

TYPE OF STAY

Mix of rehab and long-term care

This home supports both short-term rehab and long-term care, with residents staying for a wide range of durations.

Most new residents arrive under private pay (55% of admissions), and a typical private pay stay runs around 2 - 3 months.

Admissions
765 total

Coverage residents most often arrive under.

Medicare 45%
Private pay 55%
Discharges
334 total

Coverage residents most often leave under.

Medicare 97%
Private pay 3%

Activities in this home

Living Spaces & Floor Plans for Astoria Senior Living

Places of interest near Astoria Senior Living

Address 3.3 miles from city center Info Estimated distance in miles from Winter Haven's city center to Astoria Senior Living's address, calculated via Google Maps.

Calculate Travel Distance to Astoria Senior Living

Add your location

Address

Compare Nursing Homes around the area

The information below is reported by the Florida Agency for Health Care Administration (AHCA).

Astoria Senior Living
NH
AL
NC
RC
Winter Haven -45 - 14 1 Bed / 2 Bed
Terracina Grand
NH
AL
IL
MC
RC
Naples -200 A+ 12 Studio / 1 Bed / 2 Bed
Brookdale DeLand
NH
AL
MC
Deland (Scarlett) -89 A+ 14 Studio / Suite
The Oaks of Clearwater
NH
AL
IL
MC
Clearwater (Oak Bluffs) -175 B- 64 Studio / 1 Bed / 2 Bed
The Bridge at Ocala
NH
AL
Ocala -95 A+ 44 Studio / 1 Bed

Frequently Asked Questions about Astoria Senior Living

What languages are spoken at Astoria Senior Living?

The team at Astoria Senior Living speaks Creole, English, and Spanish.

Who is the owner of Astoria Senior Living?

Astoria Senior Living is legally operated by Lake Wales Health Care Operations Company, Llc, and administered by Dena Rene Goldberg.

Is Astoria Senior Living in a walkable area?

Astoria Senior Living has a walk score of 14. Car-dependent. Most errands require a car, with limited nearby walkable options.

What is the license number of Astoria Senior Living?

According to FL state health department records, Astoria Senior Living's license number is 11898.

When does Astoria Senior Living's license expire?

According to FL state health department records, Astoria Senior Living's license expires on January 18, 2027.

What is the occupancy rate at Astoria Senior Living?

Astoria Senior Living's occupancy is 87%.

What payment types does Astoria Senior Living accept?

Astoria Senior Living accepts Other and VA.

Guides for Better Senior Living

Care Cost Calculator: See Prices in Your Area

Nursing Home Data Explorer

Don’t Wait Too Long: 7 Red Flag Signs Your Parent Needs Assisted Living Now

The True Cost of Assisted Living in 2025 – And How Families Are Paying For It

Understanding Senior Living Costs: Pricing Models, Discounts & Financial Assistance