Atlas at Cedar Grove Respiratory & Nursing
Nursing Home, Hospice Care, Palliative Care, Respite Care & Skilled Nursing · Williamstown, NJ
CMS overall rating Info CMS (the Centers for Medicare & Medicaid Services) is the federal agency that rates nursing home quality. Its Overall Rating runs from 1 to 5 stars, combining health inspections, staffing, and quality measures, with inspections weighted most heavily.

Atlas at Cedar Grove Respiratory & Nursing

Nursing Home, Hospice Care, Palliative Care, Respite Care & Skilled Nursing · Williamstown, NJ
CMS overall rating Info CMS (the Centers for Medicare & Medicaid Services) is the federal agency that rates nursing home quality. Its Overall Rating runs from 1 to 5 stars, combining health inspections, staffing, and quality measures, with inspections weighted most heavily.
Atlas at Cedar Grove Respiratory & Nursing accepts Medicare, Medicaid, and private pay.

Overview of Atlas at Cedar Grove Respiratory & Nursing

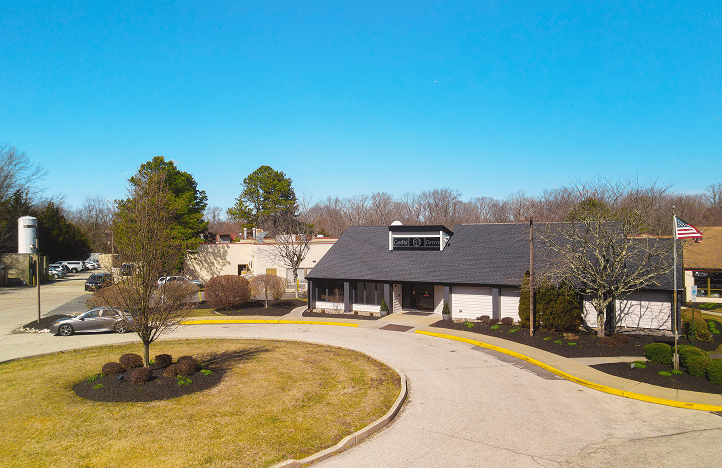
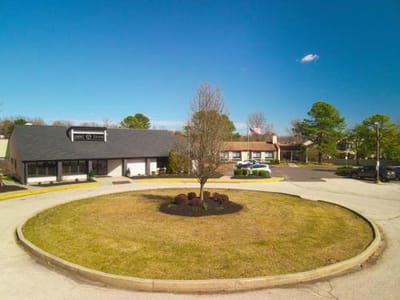
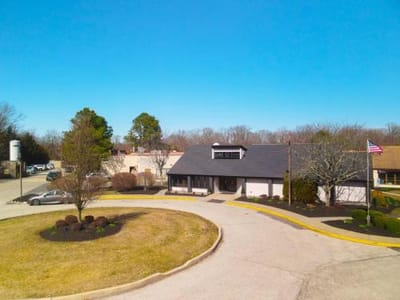
Atlas at Cedar Grove Respiratory & Nursing is a nursing home in Williamstown, NJ, offering long-term care, rehabilitation, respite care, and skilled nursing. Promoting a comfortable and supportive environment, the community features upscale amenities dedicated to older adults’ welfare. With round-the-clock care, restaurant-style dining, laundry, and concierge services, residents can focus on their recovery. Focusing on residents’ holistic wellness, the community follows an interdisciplinary approach to care.

Therapeutic recreation, fun gatherings, and local outings encourage residents to make friends and gain meaningful experiences. A hair salon, a gazebo, and spacious grounds also ensure residents’ relaxation. Residents also have quick access to their necessities and leisure with shopping centers and restaurants available in the area. As one of the highly regarded options for senior living in New Jersey, this nursing home strives to help older adults thrive in retirement.

Quality ratings

Measured by Centers for Medicare & Medicaid Services (CMS)

Overall rating Info The Overall CMS Rating combines results from health inspections, staffing levels and quality measures. Health inspections carry the most weight. Staffing and quality scores can increase or decrease the final rating based on performance compared to state and national standards.
▲ 19.8% Above NJ avg. ▲ 19.8% Above NJ avg.NJ average: 3.3Click the badge to see the full State ranking.Click here to see the full State ranking.
Health Inspection Info Based on the results of the facility's three most recent standard inspections and any complaint investigations. CMS reviews the number, scope, and severity of deficiencies, with more recent findings weighted more heavily.
▲ 41.8% Above NJ avg. ▲ 41.8% Above NJ avg.NJ average: 2.8Click the badge to see the full State ranking.Click here to see the full State ranking.
Staffing Info Measures average nursing staff hours per resident per day, including Registered Nurses (RNs) and total nursing staff. Ratings are adjusted based on the level of care residents require and are compared to state and national benchmarks.
▼ 67.3% Below NJ avg. ▼ 67.3% Below NJ avg.NJ average: 3.1Click the badge to see the full State ranking.Click here to see the full State ranking.
Quality Measures Info Based on clinical and physical health indicators reported to CMS, such as hospital readmissions, falls, pressure ulcers, and improvements in mobility. These measures reflect how well residents' health needs are being managed.
▲ 12.8% Above NJ avg. ▲ 12.8% Above NJ avg.NJ average: 4.4Click the badge to see the full State ranking.Click here to see the full State ranking.

Staffing Info Data period: Q4 2025 (October 1 – December 31, 2025).
Nursing care per resident per day and state rankings: CMS Provider Information.
Headcount, shifts and contractors: CMS Payroll-Based Journal (PBJ).
Resident count: CMS Long-Term Care Facility Characteristics (data as of Jun 2026).

Total nursing care per resident / day Info This nursing home is ranked 271st out of 280 nursing homes we track in New Jersey for nurse hours. Total adjusted nursing hours per resident per day, combining RN, LPN, and aide time. CMS adjusts this for case-mix so facilities can be fairly compared.
↓ 25% · NJ 3h 53mThis facility: 2h 54m per resident per day, 25% below the New Jersey average of 3h 53m (among New Jersey facilities reporting a recent figure).Green: 5% or more better than the state average. Yellow: within 5%. Red: 5% or more worse. Rank #271 / 280Nurse hours — State benchmarked This nursing home is ranked 271st out of 280 nursing homes we track in New Jersey for nurse hours. Shows adjusted nurse hours per resident per day benchmarked to the New Jersey average, with a ranking across 280 New Jersey facilities. More hours mean more direct care. The national average is about 3.5 hrs; below 3.0 is a red flag. Communities with the same value for a metric share the same rank. Rankings compare like with like: every nursing home we track in New Jersey that reports data for that category. Nursing homes without available data are excluded, so the pool size varies from metric to metric.
2h 54m

Standout metric: LPN / LVN is +6% above New Jersey average

5 of 6 metrics below New Jersey average

Staff by category

Q4 2025 · Oct 1 – Dec 31 More info This data comes from the CMS Payroll-Based Journal report covering October 1 – December 31, 2025.
Certified Nursing Assistant9009031,45692100%9.1
Licensed Practical Nurse488213021,01692100%9.1
Qualified Activities Professional023235,75492100%12.4
Registered Nurse921305,39692100%7.5
Clinical Nurse Specialist619253,36792100%4.6
Other Dietary Services Staff9093,34892100%7.4
RN Director of Nursing2029126874%7.7
Mental Health Service Worker2027846975%8
Administrator1015126470%8
Dietitian1014886166%8
Nurse Practitioner1014806065%8
Occupational Therapy Assistant011771516%5.1
Medical Director011481213%4
90 Certified Nursing Assistant
Coverage 100%
130 Licensed Practical Nurse
Coverage 100%
23 Qualified Activities Professional
Coverage 100%
30 Registered Nurse
Coverage 100%
By The Numbers

Community insights.

Bed count Info A mid-sized community that may balance personal attention with shared amenities and social activities. 180 Rank #71 / 333Bed count — State benchmarked This nursing home is ranked 71st out of 333 nursing homes we track in New Jersey for bed count. Shows this facility's certified or reported bed count compared to other New Jersey facilities. Larger communities may offer more amenities, programs, and on-site services for residents and families. Communities with the same value for a metric share the same rank. Rankings compare like with like: every nursing home we track in New Jersey that reports data for that category. Nursing homes without available data are excluded, so the pool size varies from metric to metric.

Medium-capacity home · Offers a balance of services and community atmosphere.

Walk Score Info Car-dependent. Most errands require a car, with limited nearby walkable options. Rank #317 / 353Walk Score — State benchmarked This nursing home is ranked 317th out of 353 nursing homes we track in New Jersey for walk score. Shows how walkable this facility's neighborhood is compared to the average walk score across New Jersey facilities. Higher scores benefit residents, families, and staff. Communities with the same value for a metric share the same rank. Rankings compare like with like: every nursing home we track in New Jersey that reports data for that category. Nursing homes without available data are excluded, so the pool size varies from metric to metric.
12 / 100
Occupancy rate Info Occupancy higher than 95% suggests steady demand, but availability may be limited. Rank #16 / 293Occupancy rate — State benchmarked This nursing home is ranked 16th out of 293 nursing homes we track in New Jersey for occupancy. Shows this facility's occupancy rate versus the New Jersey average, with its Statewide rank out of 293. Higher occupancy signals strong local demand and financial stability. Communities with the same value for a metric share the same rank. Rankings compare like with like: every nursing home we track in New Jersey that reports data for that category. Nursing homes without available data are excluded, so the pool size varies from metric to metric.
98.8% This home is often near full

Based on residents per day and 180 beds.

Higher than the New Jersey average: 81.9%
Residents per day (avg) Info The average number of residents living at this facility on a given day. CMS calculates this figure from the facility's Minimum Data Set (MDS) assessments and uses this value for other measures like Hours Per Resident Per Day (HPRD) and 5-Star Staffing rating.
178

Source: CMS Provider Information, average daily residents (data as of Aug 2026)

Avg. Length of Stay Info Average number of days residents stay at this facility, based on CMS cost report data. Shorter stays often reflect post-acute or rehab care; longer stays reflect long-term care.
81 days

About This Community

Certifications & Programs

VA contracted facility — U.S. Department of Veterans AffairsA specialty credential or certification held by the community or its staff, indicating training or standards beyond basic state licensure.

Payment & Insurance

1 service
Accept Medicare

Therapy & Rehabilitation

6 services
24-Hour Respiratory Therapy
Stroke Recovery
Subacute Rehab
Physical Therapy
Occupational Therapy
Speech Therapy

Staffing & Medical

19 services
Doctor on Staff
Subacute Care
Respiratory Care
Pulmonary Care
Cardiac Care
Wound CareCare for wounds such as pressure sores, surgical wounds, or ulcers, including assessment, dressing changes, and monitoring for infection.
LVAD Management
Tracheostomy CareCare for a tracheostomy, an opening in the neck that helps someone breathe. Care can include cleaning, suctioning, and managing the breathing tube.
Orthopedic CareMedical care for bone, joint, muscle, and connective-tissue problems, including injuries, arthritis, and mobility concerns. It may involve orthopedic specialists or treatment plans.
Pain Management
Diabetes Management
Nutrition Management
Psychiatry/Psychology In-House Consultations
Infection Control
Post-Surgical Care
Oxygen Therapy
Antibiotic Therapy
Vent Unit / Respiratory Care
Medication ManagementSupport with organizing, administering, and monitoring medicines can help prevent missed or incorrect doses.

Memory & Specialized Care

1 service
Hospice & Palliative Care

Additional Services

5 services
Respite CareRespite care provides families and unpaid caregivers with short-term relief from caregiving duties. Care can range from a few hours to a few weeks.
Laundry & Linen
ConciergeListed as: Dedicated patient concierge
Housekeeping
Beauty Services

Additional Policies & Features

Pets not allowed

Amenities & Lifestyle

Wi-Fi
Beauty Salon
Patio
Gazebo
Resident Store
Volunteer Program
Activities
Therapeutic Recreation
Local Outings

Faith & Spiritual Life

Religious AffiliationYes

Room Accommodations

Building TypeSingle-story
Room Types
Private Room Semi-Private / Shared Room Suite
In-Room Features
Flat Screen Tv And Phone In Each Room

Contact Atlas at Cedar Grove Respiratory & Nursing

CMS Health Inspection History

Since 2022 · 4 years of data · Last health inspection May 2025

ALM Inspection Grade

91 / 100 Calculated from CMS inspection data for this community's nursing-home beds
How it compares

8 points above the New Jersey average for CMS-certified facilities (83/100)

Category breakdown

Citations Typical

45 severity-weighted points (32 deficiencies) · 30% lower than the typical CMS-certified NJ facility (median: 64)

Enforcement Strong

No fines on record · 0 enforcement actions

Persistence Typical

32 days to fix issues · faster than the typical CMS-certified NJ facility (median: 33)

Inspection grade: 91 out of 100, letter grade A-.
Total health inspections 4 New Jersey avg 4.1
Total health citations
32 Rank #230 / 285Health citations — State benchmarked This nursing home is ranked 230th out of 285 nursing homes we track in New Jersey for health citations. Shows this facility's total health deficiency citations benchmarked to the New Jersey State average, with a ranking across all 285 NJ facilities. Lower citation counts earn a better rank. Communities with the same value for a metric share the same rank. Rankings compare like with like: every nursing home we track in New Jersey that reports data for that category. Nursing homes without available data are excluded, so the pool size varies from metric to metric.
New Jersey avg 22.7 (41% worse than New Jersey average)
Citations per inspection
8 Rank #250 / 285Citations per inspection — State benchmarked This nursing home is ranked 250th out of 285 nursing homes we track in New Jersey for citations per inspection. Shows average deficiency citations per CMS inspection for this facility versus the New Jersey mean across 285 facilities with citation data. Lower is better. Communities with the same value for a metric share the same rank. Rankings compare like with like: every nursing home we track in New Jersey that reports data for that category. Nursing homes without available data are excluded, so the pool size varies from metric to metric.
New Jersey avg 5.59 (43% worse than New Jersey average)
Citation severity
100% corrected 32 of 32 citations corrected
Bar = mix of this home's 32 citations, not a state comparison

Lighter shade = corrected

Critical J–L
0 New Jersey avg 0.7 (100% better than New Jersey average)
Immediate jeopardy
Serious G–I
0 New Jersey avg 0.4 (100% better than New Jersey average)
Actual harm
Moderate D–F
30 New Jersey avg 21.3 (41% worse than New Jersey average)
No harm, more than minimal risk
Minor A–C
2 New Jersey avg 0.4 (400% worse than New Jersey average)
No harm, minimal risk
Citations history
Most recent first
May 20, 2025 6 citations
Environmental moderate citation Corrected
Infection Control moderate citation Corrected
Pharmacy moderate citation Corrected
Quality of Care moderate citation Corrected
Resident Rights moderate citation Corrected
Dec 08, 2023 1 citation
Abuse/Neglect moderate citation Corrected
May 18, 2023 8 citations
Environmental moderate citation Corrected
Nutrition moderate citation Corrected
Pharmacy moderate citation Corrected
Quality of Care moderate citation Corrected
Resident Rights moderate citation Corrected
Feb 23, 2022 17 citations
Infection Control moderate citation Corrected
Nursing Services moderate citation Corrected
Pharmacy moderate citation Corrected
Quality of Care moderate citation Corrected
Care Planning minor citation Corrected
Care Planning moderate citation Corrected
Resident Rights minor citation Corrected
Top deficiency categories
Share of 32 citations
Quality of Life & Care 8 deficiencies (25%)
Pharmacy Services 6 deficiencies (19%)
Resident Assessment & Care Planning 5 deficiencies (16%)
Infection Control 4 deficiencies (13%)
Resident Rights 3 deficiencies (9%)
Nutrition & Dietary 2 deficiencies (6%)
Environmental 2 deficiencies (6%)
Abuse, Neglect & Exploitation 1 deficiency (3%)
Nursing & Physician Services 1 deficiency (3%)
How citations are counted

Health citations are formal notices following inspections when they fail to comply with safety and care standards.

30 of 32 citations resulted from standard inspections; 1 of 32 resulted from complaint investigations; and 1 of 32 came from combined inspections (standard and complaint).

Includes all CMS health inspection records for this property, which could include management/ownership changes.

Source

Data sourced from CMS Health Deficiencies reports. Citation severity codes range from A (least serious) to L (most serious). Immediate Jeopardy (J-L) citations indicate situations where the facility's noncompliance has placed residents at risk of death or serious harm.

Show Inspection Reports

Penalties and fines

Federal penalties imposed by CMS for regulatory violations, including civil money penalties (fines) and denials of payment for new Medicare/Medicaid admissions.

Source: CMS Penalties Database

No penalties in the past 3 years

No civil money penalties or payment denials were reported in the last 3 years.

Quality of care over time

These measures show how residents usually do over time at this home, based on health outcomes and preventive care.

High-risk clinical events score Info A composite score based on pressure ulcers, falls with injury, weight loss, walking ability decline, and activities of daily living decline. 1.8
69% better than New Jersey average

New Jersey average: 5.8

Functional decline score Info A composite score based on activities of daily living decline, walking ability decline, and incontinence. 6.3
43% better than New Jersey average

New Jersey average: 10.9

Long-stay resident measures
Significantly above average Info CMS star rating based on long-stay quality measure performance. 5 stars = significantly above average, 1 star = significantly below average.
Need for Help with Daily Activities Increased Info Percent of long-stay residents whose need for help with daily activities has increased 0.3%
97% better than New Jersey average

New Jersey average: 8.7%

Walking Ability Worsened Info Percent of long-stay residents whose ability to move independently worsened 0.0%
100% better than New Jersey average

New Jersey average: 8.2%

Low Risk Residents with Bowel/Bladder Incontinence Info Percent of low risk long-stay residents who lose control of their bowels or bladder 18.5%
18% worse than New Jersey average

New Jersey average: 15.6%

Falls with Major Injury Info Percent of long-stay residents experiencing one or more falls with major injury 2.3%
In line with New Jersey average

New Jersey average: 2.3%

High Risk Residents with Pressure Ulcers Info Percent of long-stay high risk residents with pressure ulcers 5.6%
In line with New Jersey average

New Jersey average: 5.4%

Urinary Tract Infection Info Percent of long-stay residents with a urinary tract infection 0.0%
100% better than New Jersey average

New Jersey average: 0.8%

Lost Too Much Weight Info Percent of long-stay residents who lose too much weight 0.8%
83% better than New Jersey average

New Jersey average: 4.6%

Depressive Symptoms Info Percent of long-stay residents who have depressive symptoms 15.8%
31% worse than New Jersey average

New Jersey average: 12.1%

Antipsychotic Use Info Percent of long-stay residents who received an antipsychotic medication 2.9%
77% better than New Jersey average

New Jersey average: 12.7%

Pneumococcal Vaccine Info Percent of long-stay residents assessed and appropriately given the pneumococcal vaccine 97.2%
5% better than New Jersey average

New Jersey average: 93.0%

Influenza Vaccine Info Percent of long-stay residents assessed and appropriately given the seasonal influenza vaccine 98.7%
In line with New Jersey average

New Jersey average: 97.2%

Short-stay resident measures
Above average Info CMS star rating based on short-stay quality measure performance. 5 stars = much above average, 1 star = much below average.
Pneumococcal Vaccine Info Percent of short-stay residents assessed and appropriately given the pneumococcal vaccine 87.7%
11% better than New Jersey average

New Jersey average: 79.0%

Antipsychotic medication increase Info Percent of short-stay residents who newly received an antipsychotic medication 0.0%
100% better than New Jersey average

New Jersey average: 1.2%

Influenza Vaccine Info Percent of short-stay residents assessed and appropriately given the seasonal influenza vaccine 77.8%
In line with New Jersey average

New Jersey average: 80.1%

Breakdown by payment type

Medicare

29% of new residents, usually for short-term rehab.

Typical stay 1 - 2 months

Private pay

23% of new residents, often for short stays.

Typical stay 1 - 2 months

Medicaid

48% of new residents, often for long-term daily care.

Typical stay 4 - 5 months

Facility Characteristics

Source: CMS Long-Term Care Facility Characteristics (Data as of Jun 2026)

Total residents 168
Medicare
23
13.7% of residents
Medicaid
102
60.7% of residents
Private pay or other
43
25.6% of residents
Programs & Services
Residents Group

Residents meet regularly to discuss policies, care quality, and activities

Active Resident Council

Organized group of residents that meets regularly to discuss facility policies, quality of life, and activities.

Finances and operations

Based on CMS SNF Cost Report for fiscal year ending in 12/2024.

For-profit
Operated by a limited liability company.
Net patient revenue Info Net patient revenue — what the home actually collects for resident care, after contractual allowances, bad debt and discounts are subtracted from its gross charges (CMS cost report, Worksheet G-3). It covers resident care only; money the home earns from other sources is shown separately as "Other income."
$28.3MFiscal year ending 12/2024
Net patient income Info Net patient income: net patient revenue minus the home's total operating expenses. A positive figure means it earns more from resident care than it spends to deliver it; a negative figure means the opposite. It excludes non-operating "other income."
$741.0KFiscal year ending 12/2024
For-profit Operated by a limited liability company.
Net patient revenue Info Net patient revenue — what the home actually collects for resident care, after contractual allowances, bad debt and discounts are subtracted from its gross charges (CMS cost report, Worksheet G-3). It covers resident care only; money the home earns from other sources is shown separately as "Other income."
$28.3MFiscal year ending 12/2024 Rank #23 / 253Net patient revenue — State benchmarked This nursing home is ranked 23rd out of 253 nursing homes we track in New Jersey. Shows this facility's net patient revenue compared to the New Jersey average, among facilities reporting a recent fiscal year. Higher revenue generally means more resources for staffing and capital — read alongside Payroll %. Communities with the same value for a metric share the same rank. Rankings compare like with like: every nursing home we track in New Jersey that reports data for that category. Nursing homes without available data are excluded, so the pool size varies from metric to metric.
Net patient income Info Net patient income: net patient revenue minus the home's total operating expenses. A positive figure means it earns more from resident care than it spends to deliver it; a negative figure means the opposite. It excludes non-operating "other income."
$741.0KFiscal year ending 12/2024
Other income Info Money the home earns outside of resident care — such as investments, grants, rentals and other non-operating sources (CMS cost report, Worksheet G-3). It is tracked separately from net patient revenue: it is not part of that figure, and it is not included in net patient income.
$20.2KFiscal year ending 12/2024
Payroll costs Info Staff salaries plus wage-related costs — benefits such as payroll taxes, health insurance and retirement — from the home's own accounting records (CMS cost report, Worksheet A). Contract or agency labor is counted separately, under other operating costs. Rank #74 / 253Payroll costs — State benchmarked This nursing home is ranked 74th out of 253 nursing homes we track in New Jersey. Shows total staff payroll — salaries plus wage-related benefits — benchmarked to the New Jersey average, among facilities reporting a recent fiscal year. Higher payroll relative to peers often signals better staffing and less reliance on contract labor. Communities with the same value for a metric share the same rank. Rankings compare like with like: every nursing home we track in New Jersey that reports data for that category. Nursing homes without available data are excluded, so the pool size varies from metric to metric.
$10.2MFiscal year ending 12/2024 36.2% of net patient revenue Info Payroll as a share of revenue: staff salaries and wage-related benefits divided by net patient revenue. A higher figure means more of each revenue dollar goes to staff pay. Rank #222 / 253Payroll % of net patient revenue — State benchmarked This nursing home is ranked 222nd out of 253 nursing homes we track in New Jersey. Shows payroll as a percentage of net patient revenue versus the New Jersey average, among facilities reporting a recent fiscal year. Below 25% may signal understaffing or heavy agency use — read with Staffing ratings. Communities with the same value for a metric share the same rank. Rankings compare like with like: every nursing home we track in New Jersey that reports data for that category. Nursing homes without available data are excluded, so the pool size varies from metric to metric.
Other operating costs Info Everything it costs to run the home apart from payroll — food, utilities, supplies, maintenance, contract labor and administration. Calculated as total operating expense minus payroll (staff salaries and wage-related benefits).
$17.3MFiscal year ending 12/2024
Total costs Info The home's total operating expense for the year — all the costs of running it, salaries included (CMS cost report, Worksheet G-3).
$27.5MFiscal year ending 12/2024

Who this home usually serves

TYPE OF STAY

Mostly long-term care residents

Most residents stay for extended periods and receive ongoing daily care.

New residents most often arrive under Medicaid (48% of admissions), and a typical Medicaid stay runs around 4 - 5 months.

Admissions
785 total

Coverage residents most often arrive under.

Medicare 29%
Private pay 23%
Medicaid 48%
Discharges
770 total

Coverage residents most often leave under.

Medicare 20%
Private pay 32%
Medicaid 48%

Places of interest near Atlas at Cedar Grove Respiratory & Nursing

Address 1420 S Black Horse Pike, Williamstown, NJ 08094

Calculate Travel Distance to Atlas at Cedar Grove Respiratory & Nursing

Add your location

Address

Financial Assistance for
Nursing Home in New Jersey

Atlas at Cedar Grove Respiratory & Nursing is located in Williamstown, New Jersey.
Here are the financial assistance programs available to residents in New Jersey.

Get Financial aid guidance

Managed Long Term Services and Supports

NJ Medicaid MLTSS

Age 65+ or disabled
General New Jersey resident, Medicaid- eligible, nursing home-level care need.
Income Limits (2025) ~$2,829/month 300% FBR, individual
Asset Limits $2,000 (individual), $3,000 (couple).
NJ

High urban demand; managed care model.

Benefits
In-home care (5-7 hours/day) Assisted living Respite (240 hours/year) Medical services

JACC (Jersey Assistance for Community Caregiving)

NJ JACC

Age 60+
General New Jersey resident, at risk of nursing home.
Income Limits ~$2,500/month individual, varies
Asset Limits $40,000 individual
NJ

Higher asset limit; limited funding.

Benefits
In-home care (3-5 hours/week) Respite (up to 10 days/year) Home modifications (~$1,000 avg.)

Pharmaceutical Assistance to the Aged and Disabled (PAAD)

New Jersey PAAD

Age 65+
General NJ resident, enrolled in Medicare Part D or eligible.
Income Limits (2025) ~$42,142/year (individual), ~$49,209/year (couple).
Asset Limits Not assessed.
NJ

Copays $5 (generic), $7 (brand); covers Part D premiums up to benchmark.

Benefits
Prescription cost reduction ($500-$1,000/year savings) Premium assistance ($20/month above benchmark)

Senior Gold Prescription Discount Program

New Jersey Senior Gold

Age 65+
General NJ resident, enrolled in Medicare Part D or eligible.
Income Limits (2025) ~$42,142-$52,142/year (individual), ~$49,209-$59,209/year (couple).
Asset Limits Not assessed.
NJ

Copays $15 + 50% of remaining cost; no premium assistance.

Benefits
Prescription cost reduction (~$300-$800/year savings)

Medicare Savings Program (MSP)

New Jersey Medicare Savings Program

Age 65+ or disabled
General NJ resident, Medicare Part A/B.
Income Limits (2025) ~$2,510/month (QMB), ~$3,380/month (SLMB), ~$3,598/month (QI)—individual.
Asset Limits $9,430 (individual), $14,130 (couple).
NJ

Three tiers; no waitlist; includes Extra Help for Part D.

Benefits
Covers Part B premiums ($174.70/month) Deductibles ($240/year) Copays (~20%)

Senior Freeze (Property Tax Reimbursement)

New Jersey Senior Freeze

Age 65+ by Dec 31 prior year
General NJ resident, homeowner, paid property taxes.
Income Limits (2025) ~$150,000/year combined household, projected
Asset Limits Not assessed; home ownership required.
NJ

Combines with ANCHOR/Stay NJ via PAS-1; annual application.

Benefits
Tax reimbursement (~$500-$2,000/year) for increases since base year

ANCHOR (Affordable NJ Communities for Homeowners and Renters)

New Jersey ANCHOR

Age 65+ prioritized
General NJ resident, homeowner/renter, paid property taxes/rent.
Income Limits (2025) ~$150,000/year (homeowners), ~$75,000/year (renters).
Asset Limits Not assessed.
NJ

Combines with Senior Freeze/Stay NJ; broader than prior Homestead program.

Benefits
Tax relief (~$700-$1,500/year homeowners, ~$250-$450 renters)

Stay NJ

New Jersey Stay NJ

Age 65+ by Dec 31 prior year
General NJ resident, homeowner, lived in home 10+ years.
Income Limits (2025) ~$500,000/year projected, subject to final regs
Asset Limits Not assessed; home ownership required.
NJ

Up to 50% tax credit (max $6,500); phased implementation.

Benefits
Tax credit (~$3,000-$6,500/year, projected) starting 2026

Universal Service Fund (USF)

New Jersey Universal Service Fund

Age 65+ prioritized
General NJ resident, utility customer, low-income.
Income Limits (2025) ~$3,970/month individual, 185% FPL
Asset Limits Not assessed; income-focused.
NJ

Must owe >$25 on bill; combines with LIHEAP if eligible.

Benefits
Bill credits (~$300-$1,500/year) to cap energy costs at 6% of income

NJ Family Caregiver Support Program (via NFCSP)

New Jersey Family Caregiver Support Program

Age —
General Caregivers of 60+ needing care or 55+ caregivers of others; NJ resident; functional needs (2+ ADLs).
Income Limits (2025) Prioritizes ~$24,980/year (individual); no strict cap.
Asset Limits Not assessed; need-based.
NJ

21 AAAs; rural/low-income priority.

Benefits
Respite (4-6 hours/week or 5 days/year) Adult day care ($60/day) Training Supplies (~$500/year)

VA Aid and Attendance (A&A) and Housebound Benefits

New Jersey VA Aid and Attendance/Housebound

Age 65+ or disabled veteran/spouse
General NJ resident, wartime service, need for ADL help (A&A) or homebound.
Income Limits (2025) Net income < ~$1,984/month (veteran with dependent, A&A); pension offsets income.
Asset Limits ~$155,356 net worth limit
NJ

High veteran demand in urban/rural areas.

Benefits
Cash (~$1,433-$2,642/month veteran, ~$951-$1,318 spouse) for care costs (e.g., in-home, assisted living)

Frequently Asked Questions about Atlas at Cedar Grove Respiratory & Nursing

Is Atlas at Cedar Grove Respiratory & Nursing in a walkable area?

Atlas at Cedar Grove Respiratory & Nursing has a walk score of 12. Car-dependent. Most errands require a car, with limited nearby walkable options.

What is the occupancy rate at Atlas at Cedar Grove Respiratory & Nursing?

Atlas at Cedar Grove Respiratory & Nursing's occupancy is 98.8%.

Are pets allowed at Atlas at Cedar Grove Respiratory & Nursing?

No, Atlas at Cedar Grove Respiratory & Nursing has a no-pet policy.

What is the best email address for Atlas at Cedar Grove Respiratory & Nursing?

The team at Atlas at Cedar Grove Respiratory & Nursing can be reached at info@cedargrovenursing.com.

Does Atlas at Cedar Grove Respiratory & Nursing operate as a for-profit or non-profit?

Atlas at Cedar Grove Respiratory & Nursing is registered as a for-profit.

What is the overall rating for Atlas at Cedar Grove Respiratory & Nursing?

Atlas at Cedar Grove Respiratory & Nursing received a 4-star overall rating from the CMS (Centers for Medicare and Medicaid Services). This score combines results from staffing levels, quality measures, and health inspections.

How many beds does Atlas at Cedar Grove Respiratory & Nursing have?

Atlas at Cedar Grove Respiratory & Nursing has 180 beds.

Guides for Better Senior Living

Care Cost Calculator: See Prices in Your Area

Nursing Home Data Explorer

Don’t Wait Too Long: 7 Red Flag Signs Your Parent Needs Assisted Living Now

The True Cost of Assisted Living in 2025 – And How Families Are Paying For It

Understanding Senior Living Costs: Pricing Models, Discounts & Financial Assistance