Explore Open Rooms

1 Contact details
2 What type of senior care service are you looking for?
3 What budget do you have in mind for senior care?
4 How soon do you need to find care?
5 Additional details

Thank you for your interest!

Our team will be in touch shortly to help with next steps.

Nursing Home

Autumn Lake Healthcare at Silver Spring

Nursing Home

Autumn Lake Healthcare at Silver Spring

2501 Musgrove Rd, Silver Spring, MD 20904 View map
Overview of Autumn Lake Healthcare at Silver Spring

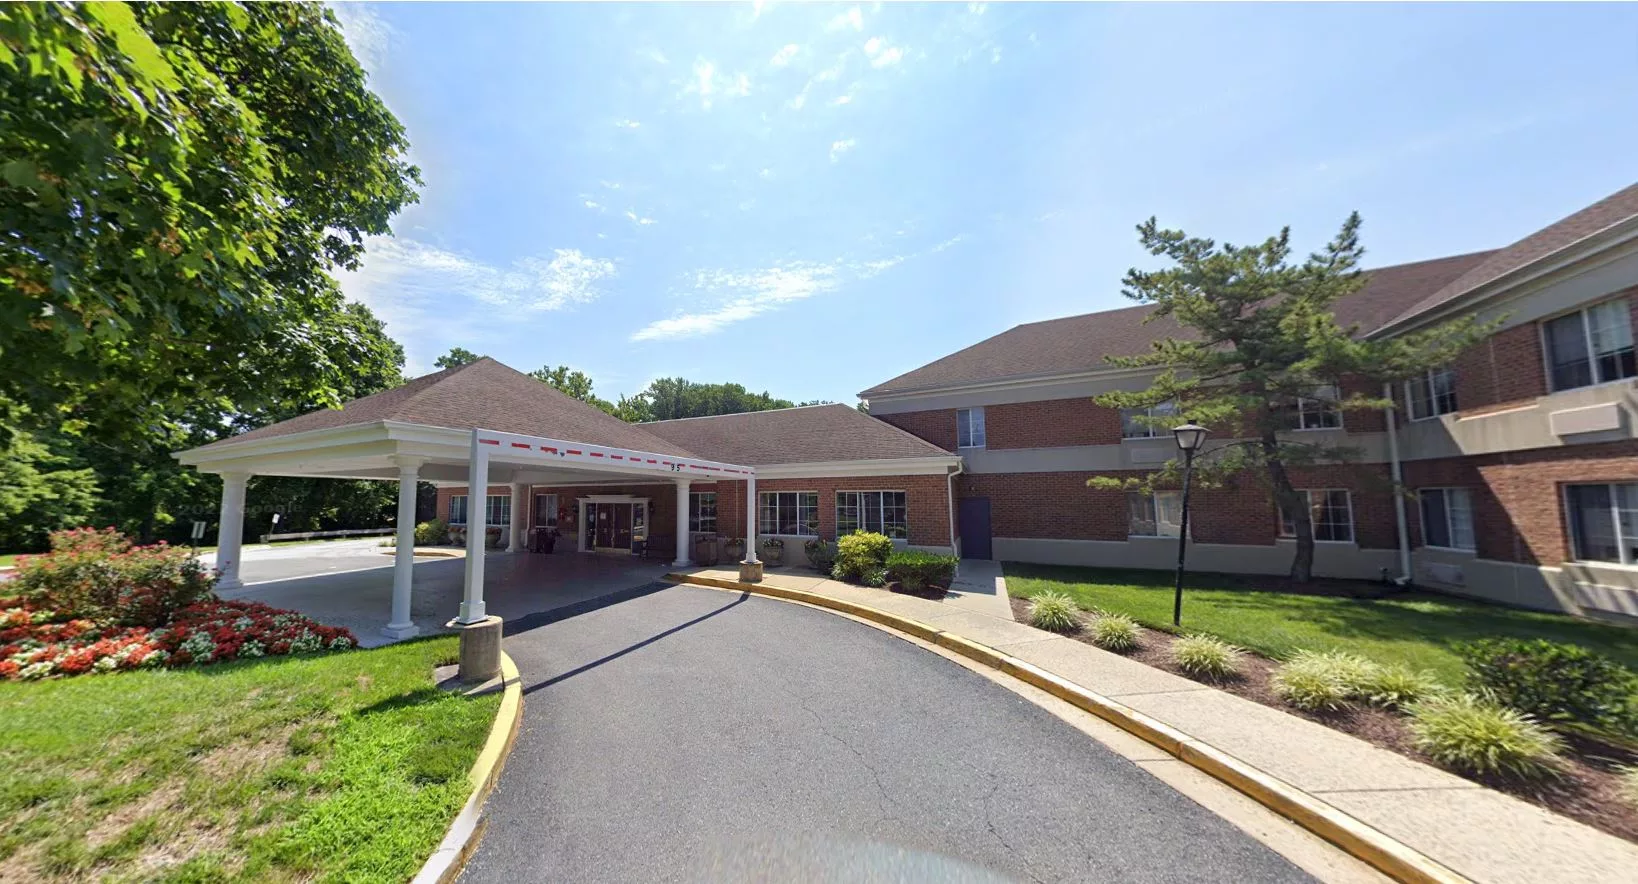
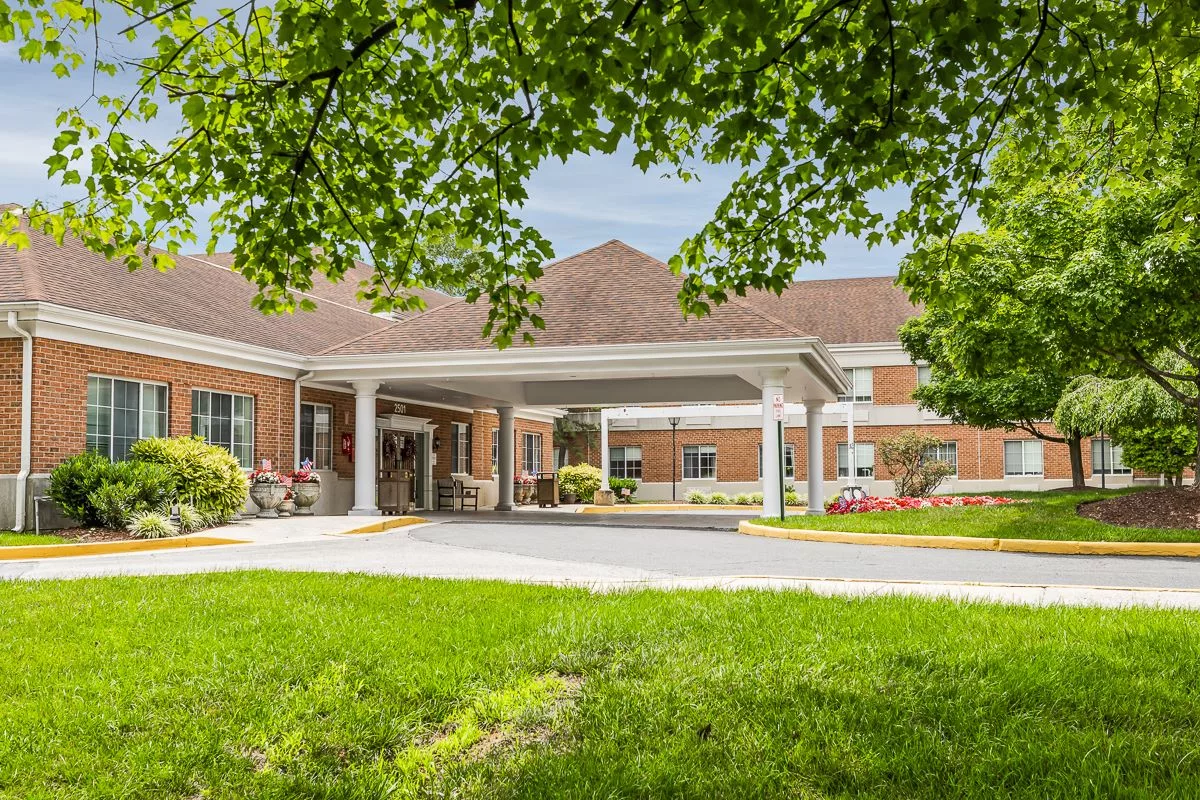
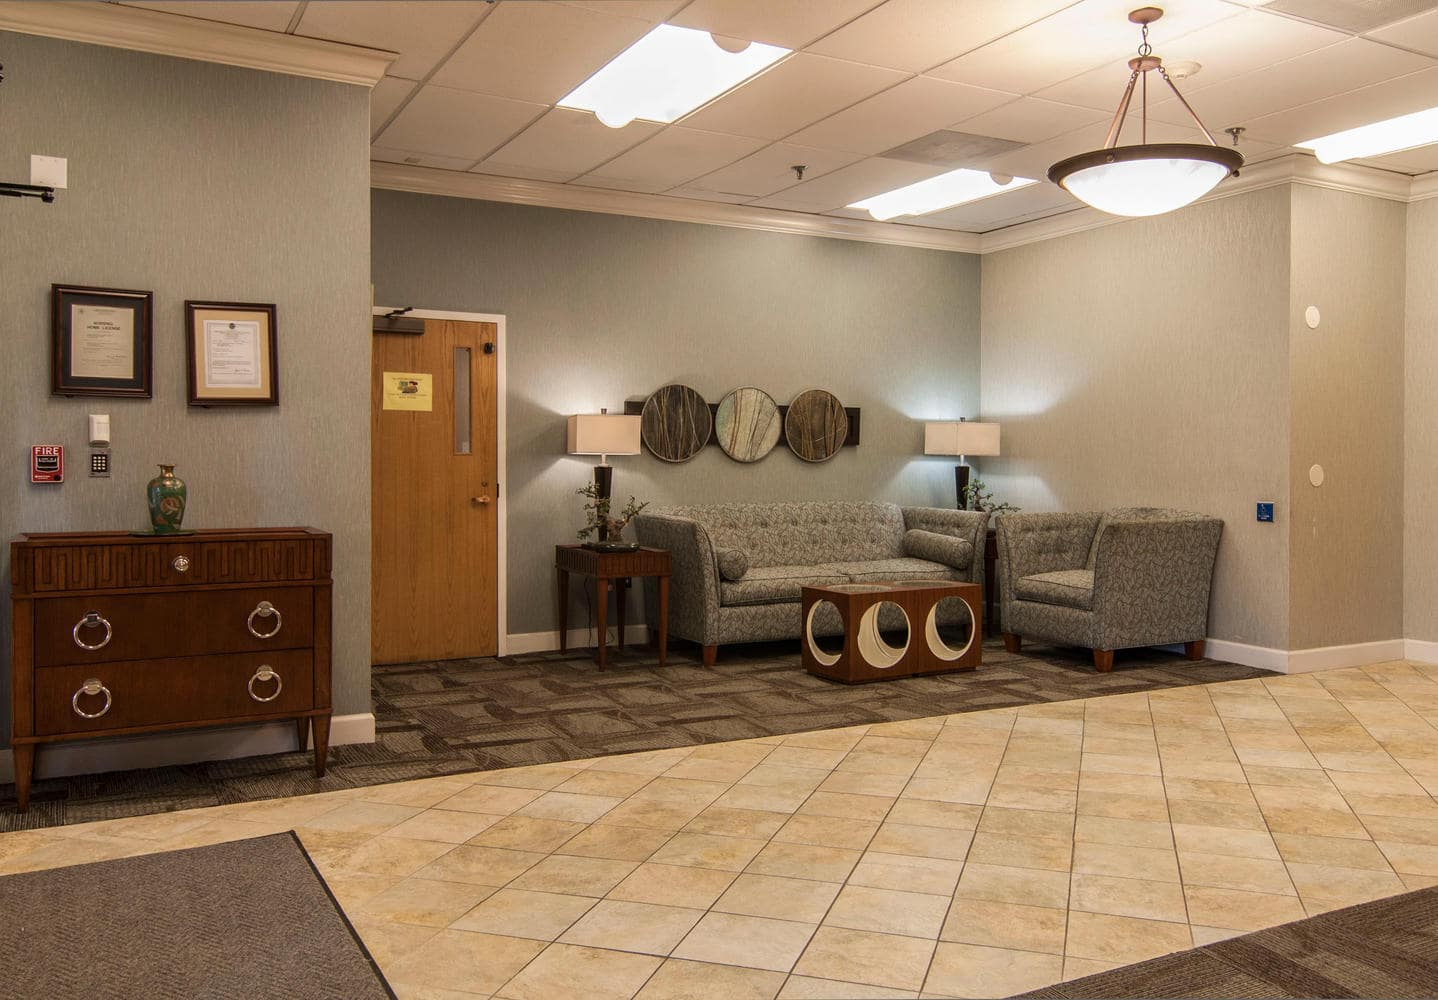
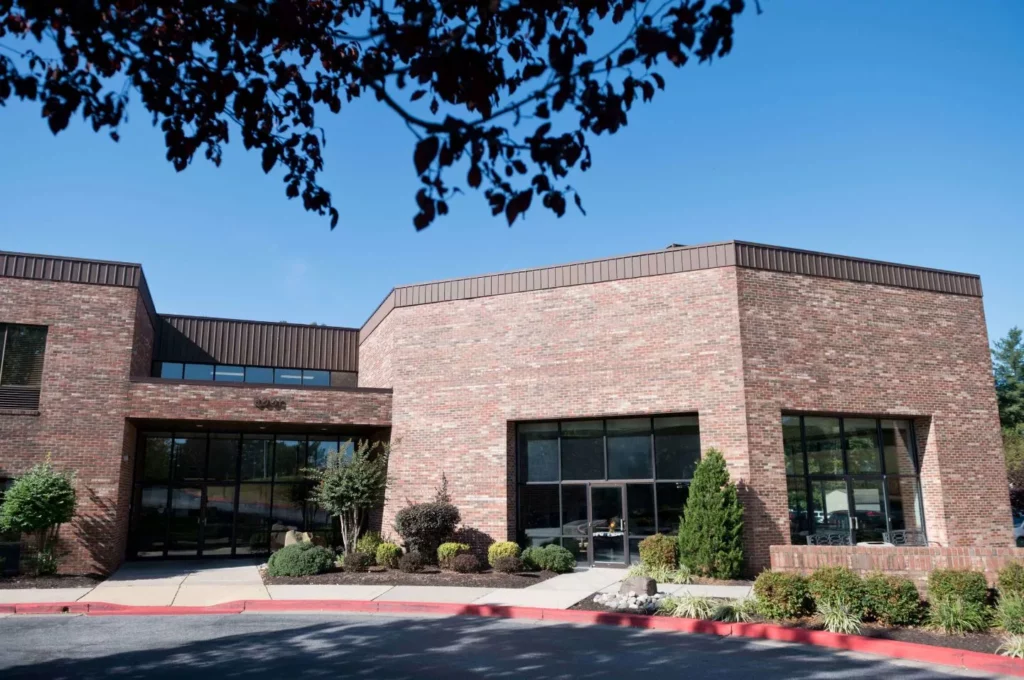
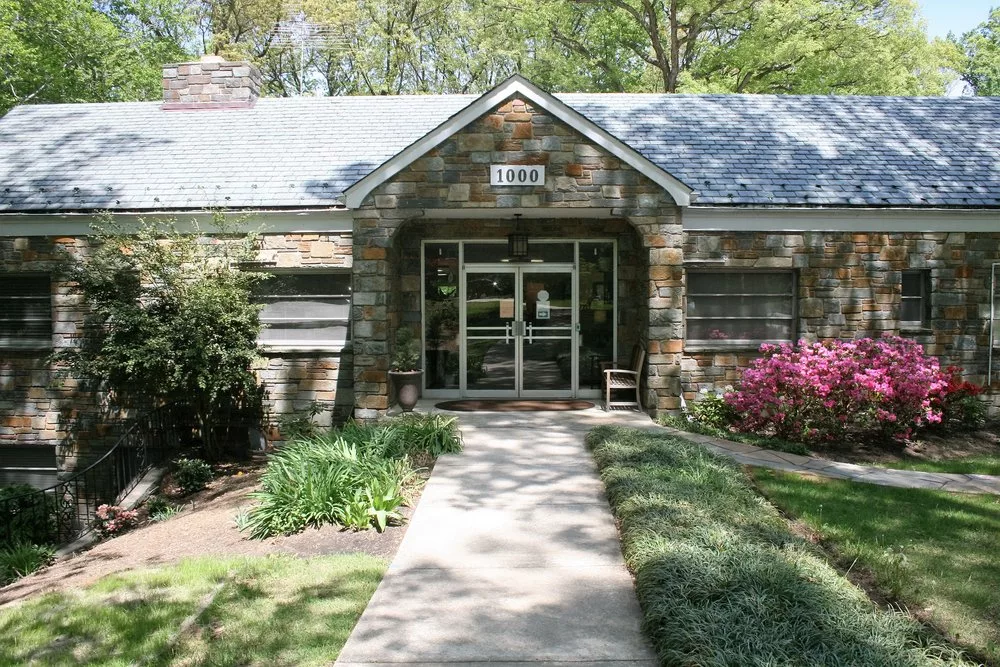
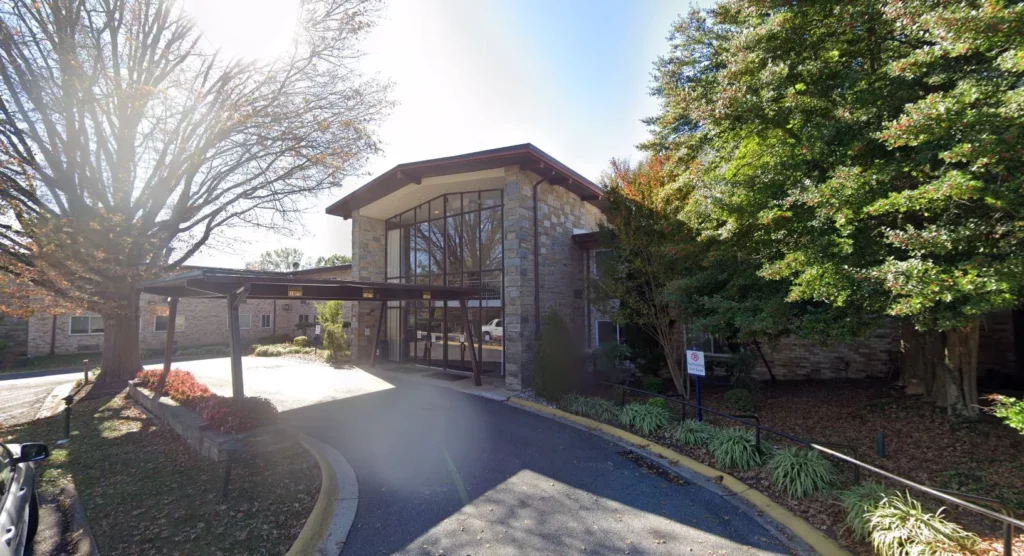
If you’re looking for a home where you can proudly say that you reside in a top-notch level of care in a premiere community with a tranquil atmosphere, then Autumn Lake Healthcare at Silver Spring is the ideal nursing home to receive good care. It’s composed of a professional care staff who brings excellence to the recovery of every senior; residents can genuinely feel the high-end quality of care in a nurturing environment. Autumn Lake Healthcare is where many choose to relax and recover in a good place for a good time.

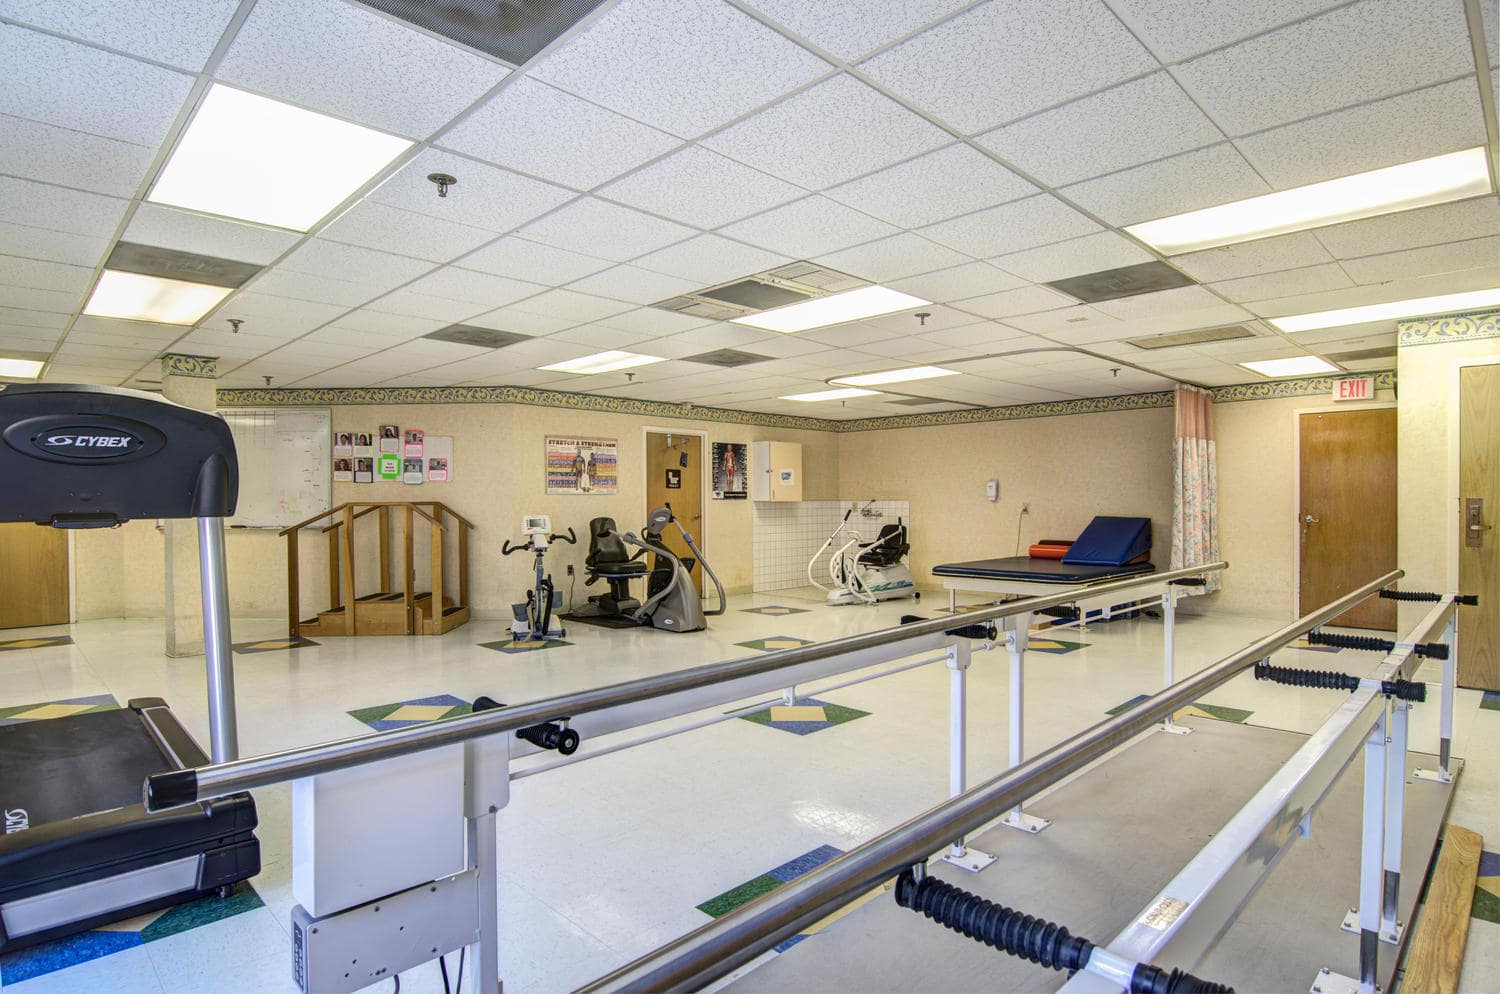
As an Autumn Lake home, expect the staff to deliver comprehensive programs for a successful recovery period. With an emphasis on short-term and long-term care, seniors receive professional care in therapy (speech, occupational, physical), trach management care, IV therapy, and respiratory therapy; pain management, stroke recovery, diabetes management, hospice care, and a closed dementia unit – among many others.

Autumn Lake Healthcare at Silver Spring is an independently owned and operated healthcare center that is licensed to use the Autumn Lake Healthcare name and receive non-healthcare related services. All healthcare-related services are provided solely by Autumn Lake Healthcare at Silver Spring.

(301) 890-5552

Quality ratings

Measured by Centers for Medicare & Medicaid Services (CMS)

Overall rating Info The Overall CMS Rating combines results from health inspections, staffing levels and quality measures. Health inspections carry the most weight. Staffing and quality scores can increase or decrease the final rating based on performance compared to state and national standards.
3/5
Maryland average: 3.0/5
Health Inspection Info Based on the results of the facility's three most recent standard inspections and any complaint investigations. CMS reviews the number, scope, and severity of deficiencies, with more recent findings weighted more heavily.
3/5
Maryland average: 2.8/5
Staffing Info Measures average nursing staff hours per resident per day, including Registered Nurses (RNs) and total nursing staff. Ratings are adjusted based on the level of care residents require and are compared to state and national benchmarks.
3/5
Maryland average: 3.0/5
Quality Measures Info Based on clinical and physical health indicators reported to CMS, such as hospital readmissions, falls, pressure ulcers, and improvements in mobility. These measures reflect how well residents' health needs are being managed.
3/5
Maryland average: 3.7/5

Nursing care per resident

Info This shows how many total hours of nursing staff time are available per resident each day. Higher numbers usually mean more staff support.
3h 31m per day

This home provides 7% less nursing time per resident than the Maryland average.

Maryland average: 3h 46m per day

Staffing hours breakdown

Info Hours of care per resident per day, broken down by staff type. Data from CMS Medicare.
Staff type Facility State avg National avg
Registered Nurse (RN) Info Registered nurse hours per resident per day. 37m per day 50m per day 41m per day
Nurse Aide Info Nurse aide hours per resident per day. 2h 2m per day 2h 10m per day 2h 21m per day
Total Nursing (Weekend) Info Total number of nurse staff hours per resident per day on weekends. 3h 16m per day 3h 29m per day 3h 26m per day
Physical Therapist Info Physical therapist staff hours per resident per day. 6m per day 5m per day 4m per day
RN (Weekend) Info Registered nurse hours per resident per day on weekends. 36m per day 37m per day 29m per day

Capacity and availability

Medium-capacity home

Offers a balance of services and community atmosphere.

Total beds 148

This home usually has limited availability

Occupancy is moderate, suggesting balanced demand.

Similar demand to the Maryland average
Occupancy rate 93.4%
Residents per day (avg) 135
Occupancy rate
93.4%
Residents per day (avg)
135

Who this home usually serves

TYPE OF STAY

Mostly short-term rehab stays

Most residents typically stay for a few weeks or months before returning home or moving on.

Might be optimal for
Short stays Recovery Medicare-covered care

Breakdown by payment type

Medicare

51% of new residents, usually for short-term rehab.

Typical stay 1 months

Private pay

41% of new residents, often for short stays.

Typical stay 1 months

Medicaid

8% of new residents, often for long-term daily care.

Typical stay 3 years

Finances and operations

Privately-owned community
Operated by a business corporation.
Home revenue
$12.0M
Profit
$192.1K
Privately-owned community Operated by a business corporation.
Home revenue
$12,022,681.00
Profit
$192,055.00
Payroll costs Info The portion of the home's budget spent on staff, including nurses, caregivers, and other employees who support care and operations.
$800.4K
6.7% of revenue
Other operating costs Info All remaining costs needed to run the home, such as food, utilities, building maintenance, supplies and administrative expenses.
$11.0M
Total costs $11.8M
Walk Score
Walk Score: 16 / 100
Car-dependent. Most errands require a car, with limited nearby walkable options.

About this community

Care Services

Accepts Medicaid
Accepts Medicare
Nursing Services
Rehabilitation Services
Respite Care
Skilled Nursing
Licensed Nurses/CNAs
Short-Term Rehab

All Levels of Care

Short-term Care
Long-Term Care

Programs & Activities

Specific Programs
Short-term Care, Long-Term Care, Physical Therapy, Occupational Therapy, Speech Therapy, Respiratory Therapy, IV Therapy, Joint Replacement/Orthopedic Care, Trach Management Care, Wound Care, Colostomy Care, Secured Unit, Respite/Hospice Care, Palliative Care, Stroke Recovery, Diabetes Management, Total Parenteral Nutrition (TPN), Bariatric Patients

Pricing & Financial Information

Types of Care at Autumn Lake Healthcare at Silver Spring

Skilled Nursing Memory Care Hospice Care

Health Inspection History

Inspections
Total health inspections 5

Maryland average 3.9


Last Health inspection on Aug 2025

Total health citations 35

Maryland average 49.9

Citations per inspection
7

Maryland average 12.81


Health citations are formal notices following inspections when they fail to comply with safety and care standards.

21 of 35 citations resulted from standard inspections; 8 of 35 resulted from complaint investigations; and 6 of 35 came from combined inspections (standard and complaint).

Breakdown of citation severity (last 3 years)
Critical Health citations More info 0
100% better than Maryland average

Maryland average: 0.5


Serious Health citations More info 0
100% better than Maryland average

Maryland average: 0.6

0 critical citations More info Maryland average: 0.5

0 serious citations More info Maryland average: 0.6

29 moderate citations More info Maryland average: 47.2

6 minor citations More info Maryland average: 1.7
Citations history (last 3 years)
Environmental moderate citation Info Issues related to building safety, cleanliness, maintenance, and overall living conditions. Aug 04, 2025
Corrected

Care Planning moderate citation Info Issues related to creating and updating personalized care plans for residents based on their needs and conditions. Aug 04, 2025
Corrected

Infection Control moderate citation Info Issues related to preventing and controlling infections, including hygiene practices and safety protocols. Dec 06, 2024
Corrected

Nutrition moderate citation Info Issues related to food quality, meal service, and resident's nutritional needs. Dec 06, 2024
Corrected

Compare Nursing Homes around Beltsville The information below is reported by the Maryland Department of Health, Office of Health Care Quality.

5 facilities compared · CMS & MD Dept. of Health data · Updated Mar 2026

Autumn Lake Healthcare at Cherry Lane
HC

Home Care Professional care delivered in the person's own home — from companionship and errands to skilled nursing and therapy. Allows seniors to age in place. Medicare covers skilled home health when medically necessary.

NH

Nursing Home Licensed facility providing 24/7 skilled nursing care for residents with complex, ongoing medical needs. Staffed by RNs, LPNs, and CNAs. Inspected and star-rated annually by CMS. Accepts Medicare (short-term rehab) and Medicaid (long-term care).

Laurel
155
95.3%
+16%
3.21
+27%
-15%
0
41
0
149
36
A&R Stern Family Cl Holdings, Llc
$25,6M
$2,9M
11.4%
215177
Althea Woodland Nursing Home
AL

Assisted Living A licensed, long-term care setting for seniors or individuals with disabilities who need help with daily activities — like bathing, dressing, and medication management — but not 24-hour skilled nursing. Offers housing, meals, and around-the-clock support while aiming to maximize resident independence.

NH

Nursing Home Licensed facility providing 24/7 skilled nursing care for residents with complex, ongoing medical needs. Staffed by RNs, LPNs, and CNAs. Inspected and star-rated annually by CMS. Accepts Medicare (short-term rehab) and Medicaid (long-term care).

Silver Spring
50
91.7%
+11%
3.79
-29%
0%
0
29
0
43
12
Meyer, Toni
$7,6M
$2,3M
29.7%
215228
Autumn Lake Healthcare at Chevy Chase
NH

Nursing Home Licensed facility providing 24/7 skilled nursing care for residents with complex, ongoing medical needs. Staffed by RNs, LPNs, and CNAs. Inspected and star-rated annually by CMS. Accepts Medicare (short-term rehab) and Medicaid (long-term care).

Chevy Chase
172
81.1%
-2%
3.42
+2%
-9%
0
42
0
148
16
8700 Jones Mill Road Holdco Llc
$11,8M
$1,1M
9.5%
215029
Autumn Lake Healthcare at Silver Spring
HC

Home Care Professional care delivered in the person's own home — from companionship and errands to skilled nursing and therapy. Allows seniors to age in place. Medicare covers skilled home health when medically necessary.

MC

Memory Care Secured, specialized care for people living with Alzheimer's or dementia. Staff trained in cognitive impairment, with higher staff-to-resident ratios and an environment designed to reduce confusion and wandering risk.

NH

Nursing Home Licensed facility providing 24/7 skilled nursing care for residents with complex, ongoing medical needs. Staffed by RNs, LPNs, and CNAs. Inspected and star-rated annually by CMS. Accepts Medicare (short-term rehab) and Medicaid (long-term care).

Silver Spring
148
93.4%
+13%
3.51
0%
-7%
0
35
0
135
16
2501 Musgrove Road Holdco Llc
$11,7M
$0,8M
6.8%
215224
Autumn Lake Healthcare at Arcola
AL

Assisted Living A licensed, long-term care setting for seniors or individuals with disabilities who need help with daily activities — like bathing, dressing, and medication management — but not 24-hour skilled nursing. Offers housing, meals, and around-the-clock support while aiming to maximize resident independence.

NH

Nursing Home Licensed facility providing 24/7 skilled nursing care for residents with complex, ongoing medical needs. Staffed by RNs, LPNs, and CNAs. Inspected and star-rated annually by CMS. Accepts Medicare (short-term rehab) and Medicaid (long-term care).

Silver Spring
151
87.9%
+7%
3.57
-15%
-5%
0
53
3
140
44
901 Arcola Avenue Opco Llc
$19,6M
$1,3M
6.8%
215014

Autumn Lake Healthcare at Silver Spring Review

Share your thoughts and experiences about Autumn Lake Healthcare at Silver Spring. Let’s celebrate the stories that make a difference!
Reviewer avatar
Leonard Ragazinsky
Thank you Angie — you are the best!| Our new administrator, Miss T, is by far the best we have ever had. Thank you, Miss T!
Reviewer avatar
Tracy Bowling
This is not even good enough to be a pound. They are not clean and definitely not following OSHA regulations. Just go peek in and request a tour, and see for yourself before making any decisions about your loved one.
Reviewer avatar
Leonard Ragazinsky
The nursing staff forgot to order my pain meds again 5th or 6th time they are impossible to talk too so I lay here in pain. Thanks for nothing Autumn Lake Silver Spring !!!

Places of interest near Autumn Lake Healthcare at Silver Spring

Address 6.1 miles from city center — 4.25 miles to nearest hospital (UM Laurel Medical Center)
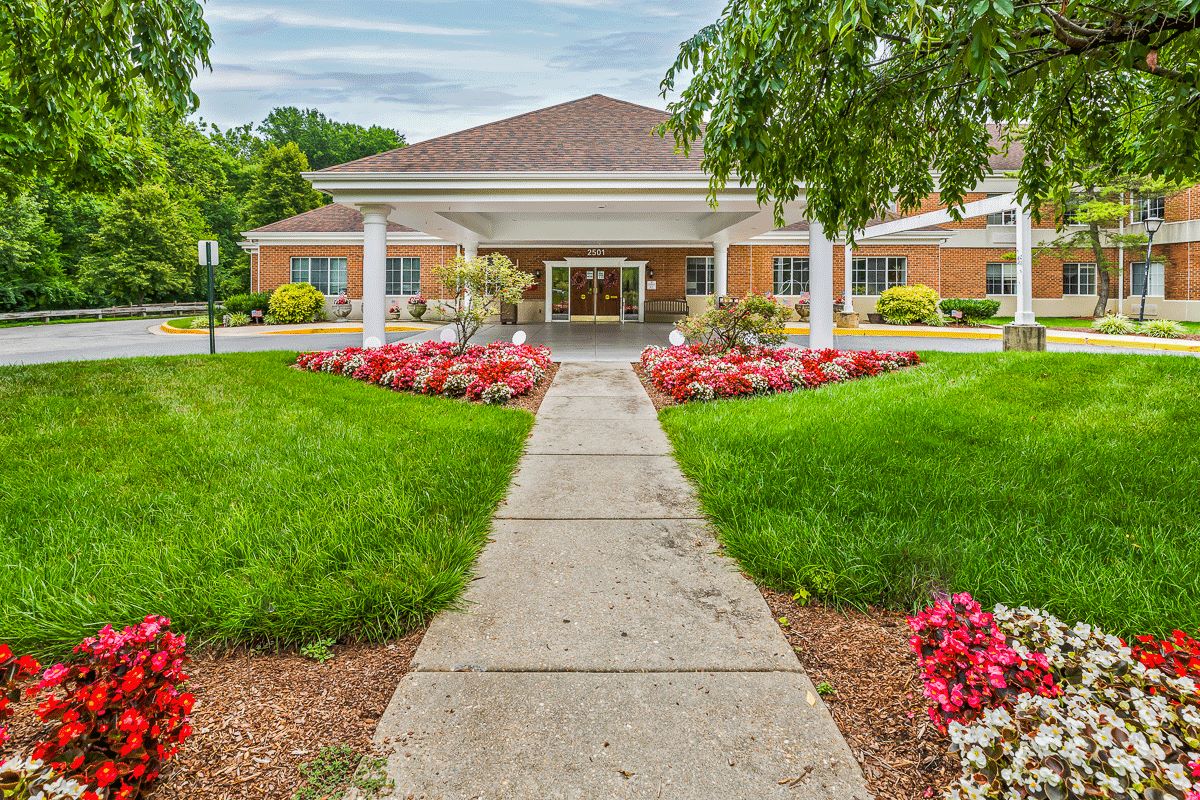
Address 2501 Musgrove Rd, Silver Spring, MD 20904

Calculate Travel Distance to Autumn Lake Healthcare at Silver Spring

Add your location

Address

Staffing Data (Q2 2025)

This data corresponds to Q2 2025 and is based on CMS Payroll-Based Journal.

Total staff 174
Employees 151
Contractors 23
Staff to resident ratio 1.34:1
26% worse than Maryland average

Maryland average ratio: 1.81:1

Avg staff/day 78
Average shift 7.4 hours
8% worse than Maryland average

Maryland average: 8 hours

Total staff hours (quarter) 52,853
Nursing staff breakdown
Registered Nurse

Manages medical care and health needs.

Total count 23
Average shift length Info Average shift length. Calculated as total hours divided by days worked and average staff per day. 8.4 hours

No contractors work on this role.

Licensed Practical Nurse

Assists with medical care and medications.

Total count 27
Average shift length Info Average shift length. Calculated as total hours divided by days worked and average staff per day. 7.4 hours

No contractors work on this role.

Certified Nursing Assistant

Helps with daily care and mobility.

Total count 78
Average shift length Info Average shift length. Calculated as total hours divided by days worked and average staff per day. 7.5 hours

No contractors work on this role.

Contractor staffing

Total hours from contractors

7.8%

4,126 contractor hours this quarter

Physical Therapy Assistant: 8 Respiratory Therapy Technician: 6 Speech Language Pathologist: 4 Physical Therapy Aide: 4 Qualified Social Worker: 1
Staff by category
Certified Nursing Assistant7807825,35691100%7.5
Licensed Practical Nurse2702711,22291100%7.4
Registered Nurse230235,87691100%8.4
Other Dietary Services Staff6061,5479099%6.9
Respiratory Therapy Technician0661,4017279%7.5
Physical Therapy Assistant0889867279%6.5
Clinical Nurse Specialist5059665662%7.5
Speech Language Pathologist0449016571%7.8
RN Director of Nursing2028636470%7.5
Dental Services Staff4048608290%7.3
Occupational Therapy Aide2026146976%7.4
Mental Health Service Worker2025916774%7.2
Physical Therapy Aide0445906470%5.7
Administrator1014506066%7.5
Nurse Practitioner1013835156%7.5
Qualified Social Worker0112486167%4.1
78 Certified Nursing Assistant
% of Days 100%
27 Licensed Practical Nurse
% of Days 100%
23 Registered Nurse
% of Days 100%
6 Other Dietary Services Staff
% of Days 99%
6 Respiratory Therapy Technician
% of Days 79%
8 Physical Therapy Assistant
% of Days 79%
5 Clinical Nurse Specialist
% of Days 62%
4 Speech Language Pathologist
% of Days 71%
2 RN Director of Nursing
% of Days 70%
4 Dental Services Staff
% of Days 90%
2 Occupational Therapy Aide
% of Days 76%
2 Mental Health Service Worker
% of Days 74%
4 Physical Therapy Aide
% of Days 70%
1 Administrator
% of Days 66%
1 Nurse Practitioner
% of Days 56%
1 Qualified Social Worker
% of Days 67%

Facility Characteristics

Source: CMS Long-Term Care Facility Characteristics (Data as of Jan 2026)

Total census
130 residents
Residents by payment source
Medicare
21 residents (16.2%)
Medicaid
81 residents (62.3%)
Private pay or other
28 residents (21.5%)
Programs & Services
Residents' Group

Residents meet regularly to discuss policies, care quality, and activities

Active Resident Council

Organized group of residents that meets regularly to discuss facility policies, quality of life, and activities.

Quality of care over time

These measures show how residents usually do over time at this home, based on health outcomes and preventive care.

High-risk clinical events score Info A composite score based on pressure ulcers, falls with injury, weight loss, walking ability decline, and activities of daily living decline. 14.6
13% worse than Maryland average

Maryland average: 12.9

Functional decline score Info A composite score based on activities of daily living decline, walking ability decline, and incontinence. 27.8
8% worse than Maryland average

Maryland average: 25.7

Long-stay resident measures
Above average Maryland avg: 3.8 Info CMS star rating based on long-stay quality measure performance. 5 stars = significantly above average, 1 star = significantly below average.
Need for Help with Daily Activities Increased Info Percent of long-stay residents whose need for help with daily activities has increased 26.3%
11% worse than Maryland average

Maryland average: 23.7%

Walking Ability Worsened Info Percent of long-stay residents whose ability to move independently worsened 34.4%
24% worse than Maryland average

Maryland average: 27.7%

Low Risk Residents with Bowel/Bladder Incontinence Info Percent of low risk long-stay residents who lose control of their bowels or bladder 22.8%
12% better than Maryland average

Maryland average: 25.9%

Falls with Major Injury Info Percent of long-stay residents experiencing one or more falls with major injury 0.9%
61% better than Maryland average

Maryland average: 2.3%

High Risk Residents with Pressure Ulcers Info Percent of long-stay high risk residents with pressure ulcers 8.4%
28% worse than Maryland average

Maryland average: 6.5%

Urinary Tract Infection Info Percent of long-stay residents with a urinary tract infection 1.3%
17% better than Maryland average

Maryland average: 1.6%

Lost Too Much Weight Info Percent of long-stay residents who lose too much weight 3.3%
43% better than Maryland average

Maryland average: 5.8%

Depressive Symptoms Info Percent of long-stay residents who have depressive symptoms 14.8%
27% better than Maryland average

Maryland average: 20.2%

Antipsychotic Use Info Percent of long-stay residents who received an antipsychotic medication 14.3%
11% worse than Maryland average

Maryland average: 12.9%

Pneumococcal Vaccine Info Percent of long-stay residents assessed and appropriately given the pneumococcal vaccine 94.5%
In line with Maryland average

Maryland average: 92.0%

Influenza Vaccine Info Percent of long-stay residents assessed and appropriately given the seasonal influenza vaccine 99.1%
In line with Maryland average

Maryland average: 96.6%

Hospitalizations per 1,000 days Info Number of hospitalizations per 1,000 long-stay resident days. 1.38
5% worse than Maryland average

Maryland average: 1.32

ED visits per 1,000 days Info Number of outpatient emergency department visits per 1,000 long-stay resident days. 0.74
39% better than Maryland average

Maryland average: 1.21

Short-stay resident measures
Below average Maryland avg: 3.7 Info CMS star rating based on short-stay quality measure performance. 5 stars = much above average, 1 star = much below average.
Pneumococcal Vaccine Info Percent of short-stay residents assessed and appropriately given the pneumococcal vaccine 70.3%
10% worse than Maryland average

Maryland average: 78.4%

Antipsychotic medication increase Info Percent of short-stay residents who newly received an antipsychotic medication 0.8%
45% better than Maryland average

Maryland average: 1.4%

Influenza Vaccine Info Percent of short-stay residents assessed and appropriately given the seasonal influenza vaccine 79.6%
In line with Maryland average

Maryland average: 80.6%

Re-hospitalized after SNF stay Info Percentage of short-stay residents who were re-hospitalized after their nursing home admission. 23.2%
9% worse than Maryland average

Maryland average: 21.2%

Emergency department visits Info Percentage of short-stay residents who had an outpatient emergency department visit. 7.3%
26% better than Maryland average

Maryland average: 9.9%

Falls with major injury Info Percentage of SNF residents who experience falls with major injury during their stay. 0.0%
100% better than Maryland average

Maryland average: 0.8%

Ability to care for self at discharge Info Percentage of residents at or above expected ability to care for themselves at discharge. 42.4%
21% worse than Maryland average

Maryland average: 53.7%

Successful return to home or community Info Rate of successful return to home or community from a skilled nursing facility. 17.2%
66% worse than Maryland average

Maryland average: 50.6%

Guides for Better Senior Living

Care Cost Calculator: See Prices in Your Area

Nursing Home Data Explorer

Don’t Wait Too Long: 7 Red Flag Signs Your Parent Needs Assisted Living Now

The True Cost of Assisted Living in 2025 – And How Families Are Paying For It

Understanding Senior Living Costs: Pricing Models, Discounts & Financial Assistance

Financial Aid for Maryland Seniors

Get financial aid guidance

Community Options Waiver

Maryland Medicaid Community Options Waiver

Age 65+ or disabled, Maryland resident, Medicaid- eligible, nursing home-level care need.

~$2,829/month (300% FBR, individual).

$2,000 (individual), $3,000 (couple) (excludes home, car).

High urban demand; rural outreach efforts.

Senior Care Program

Maryland Senior Care

Age 65+, Maryland resident, at risk of nursing home placement.

~$2,000/month (individual, varies by county).

$11,000 (individual).

Limited funding; waitlists common in high-demand areas.

Maryland Nursing Home Medicaid

Maryland Medical Assistance (Medicaid) Nursing Home Program

Age 65+, Maryland resident, Medicaid-eligible, requires nursing home-level care.

$943/month (individual); most income applied to care costs.

$2,500 (individual), $3,000 (couple); spousal protections up to $155,356.

Home equity limit $636,000; estate recovery applies post-55.

Senior Assisted Living Subsidy Program

Maryland Senior Assisted Living Group Home Subsidy

Age 62+, Maryland resident, in or moving to approved assisted living, low/moderate income.

~$34,000/year (individual, varies by county).

Not strict; prioritizes low-income.

Not available statewide; facility must be licensed by MDH.

Veterans Aid and Attendance (A&A) Benefit

Maryland VA Aid and Attendance

Wartime veteran/spouse, age 65+ or disabled, needs ADL help, Maryland resident.

Net income minus medical expenses < $1,984/month (individual with A&A).

$155,356 (net worth limit).

High veteran population in suburban/rural areas.

Senior Prescription Drug Assistance Program (SPDAP)

Maryland Senior Prescription Drug Assistance Program

Age 65+, Maryland resident (6+ months), Medicare Part D enrolled.

$48,560/year (individual, 300% FPL).

None specified.

Supplements Medicare Part D; annual enrollment required.

Medicare Savings Programs (MSP)

Maryland Medicare Savings Programs

Age 65+, Maryland resident, Medicare Part A/B enrollee.

$2,014/month (QMB), $2,706/month (SLMB/QI, individual).

$9,090 (individual), $13,630 (couple).

Includes QMB, SLMB, QI categories.

Community Personal Assistance Services (CPAS)

Maryland Medicaid Community Personal Assistance Services

Age 65+, Maryland resident, Medicaid-eligible, needs ADL assistance.

$943/month (individual); spend-down available.

$2,500 (individual), $3,000 (couple).

Consumer-directed option allows hiring family caregivers.