Althea Woodland Nursing Home
Nursing Home, Hospice Care, Memory Care & Respite Care · Silver Spring, MD
CMS overall rating Info CMS (the Centers for Medicare & Medicaid Services) is the federal agency that rates nursing home quality. Its Overall Rating runs from 1 to 5 stars, combining health inspections, staffing, and quality measures, with inspections weighted most heavily.

Althea Woodland Nursing Home

Nursing Home, Hospice Care, Memory Care & Respite Care · Silver Spring, MD
CMS overall rating Info CMS (the Centers for Medicare & Medicaid Services) is the federal agency that rates nursing home quality. Its Overall Rating runs from 1 to 5 stars, combining health inspections, staffing, and quality measures, with inspections weighted most heavily.
Calculator: See prices in your area
Althea Woodland Nursing Home accepts Medicare, Medicaid, and private pay.

Overview of Althea Woodland Nursing Home

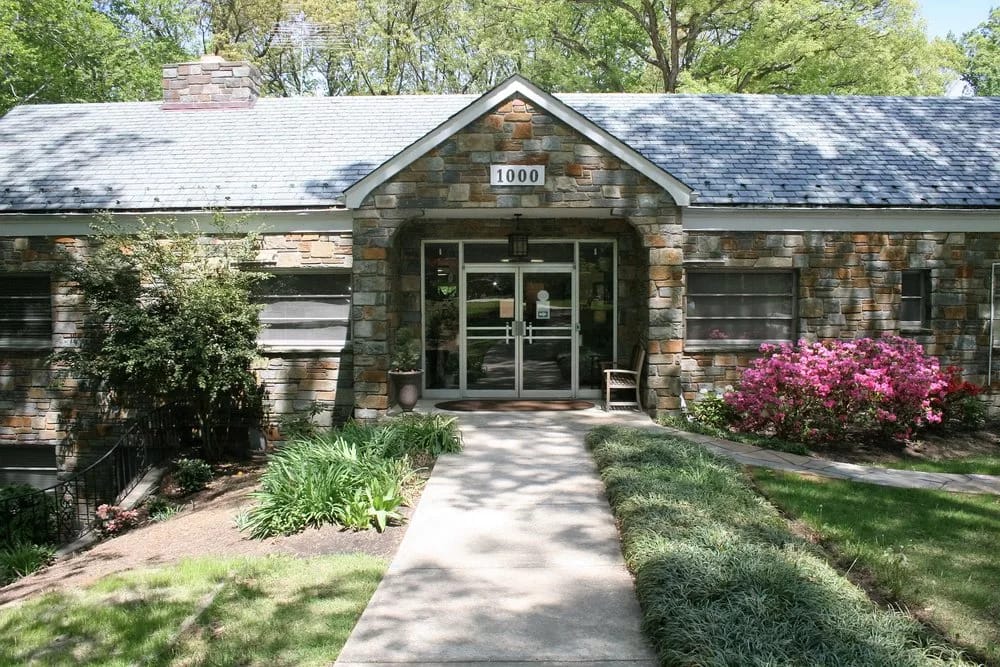
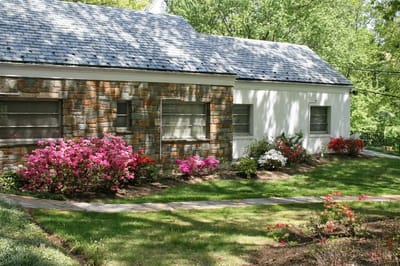
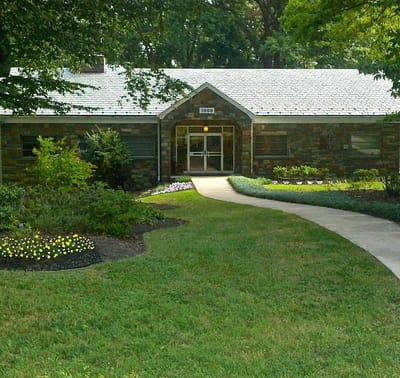
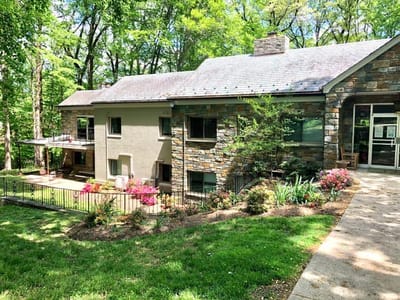
Althea Woodland Nursing Home is a skilled nursing community that has been the center of excellence for nursing homes. They have continuously provided the highest level of support for the speedy recovery of its residents. The results-driven community follows a resident-centered approach to holistic wellness for seniors.

Althea Woodland is the premiere home for skilled nursing and long-term care because of its commitment to maintaining a level of comfort, safety, and security in the community. 

Quality ratings

Measured by Centers for Medicare & Medicaid Services (CMS)

Overall rating Info The Overall CMS Rating combines results from health inspections, staffing levels and quality measures. Health inspections carry the most weight. Staffing and quality scores can increase or decrease the final rating based on performance compared to state and national standards.
▲ 31.5% Above MD avg. ▲ 31.5% Above MD avg.MD average: 3.0Click the badge to see the full State ranking.Click here to see the full State ranking.
Health Inspection Info Based on the results of the facility's three most recent standard inspections and any complaint investigations. CMS reviews the number, scope, and severity of deficiencies, with more recent findings weighted more heavily.
▲ 42.0% Above MD avg. ▲ 42.0% Above MD avg.MD average: 2.8Click the badge to see the full State ranking.Click here to see the full State ranking.
Staffing Info Measures average nursing staff hours per resident per day, including Registered Nurses (RNs) and total nursing staff. Ratings are adjusted based on the level of care residents require and are compared to state and national benchmarks.
▲ 31.3% Above MD avg. ▲ 31.3% Above MD avg.MD average: 3.0Click the badge to see the full State ranking.Click here to see the full State ranking.
Quality Measures Info Based on clinical and physical health indicators reported to CMS, such as hospital readmissions, falls, pressure ulcers, and improvements in mobility. These measures reflect how well residents' health needs are being managed.
▲ 8.2% Above MD avg. ▲ 8.2% Above MD avg.MD average: 3.7Click the badge to see the full State ranking.Click here to see the full State ranking.

Staffing hours breakdown

Info Daily nursing hours per resident by staff type, reported to CMS. Higher is generally better — compare this facility to state and national averages to see where staffing stands.

Hours per resident per day — compared to Maryland state averages

Total nursing care / resident Info Total adjusted nursing hours per resident per day, combining RN, LPN, and aide time. CMS adjusts this for case-mix so facilities can be fairly compared.
3h 47m per day
This facility Maryland avg (3h 46m per day)
vs Maryland avg
+0%

3 of 6 metrics below state avg

Standout metric Nurse Aide is +8% above state avg
Staff typeHours / Day / Residentvs state avg
Registered Nurse (RN) Info RNs hold the highest nursing license and can assess residents, interpret test results, and direct care plans. More RN hours per day often signals stronger clinical oversight and faster response to health changes. 36m per day ▼ 29% State avg: 50m per day · National avg: 41m per day
LPN / LVN Info Licensed Practical Nurses (LPNs) or Licensed Vocational Nurses (LVNs) deliver routine hands-on care — medication administration, wound dressing, and monitoring vital signs. They work under RN supervision and make up a large share of daily bedside care. 55m per day ■ Avg State avg: 54m per day · National avg: 52m per day
Nurse Aide Info Certified Nurse Aides (CNAs) provide the most direct day-to-day assistance: bathing, dressing, feeding, and mobility. Nurse aide hours are typically the largest staffing category and directly affect residents' quality of life. 2h 20m per day ▲ 8% State avg: 2h 10m per day · National avg: 2h 21m per day
Weekend Total Nursing Info Combined nursing hours (RN + LPN + Nurse Aide) per resident per day on weekends. Staffing often drops on weekends — this figure reveals whether the facility maintains adequate coverage outside of weekday hours. 3h 33m per day ■ Avg State avg: 3h 29m per day · National avg: 3h 26m per day
Physical Therapist Info Hours per resident per day provided by licensed Physical Therapists (PTs) or PT Assistants. PT services help residents recover mobility after injury or illness and are especially important for post-acute (short-stay) rehabilitation. 2m per day ▼ 55% State avg: 5m per day · National avg: 4m per day
Weekend RN Info Registered nurse hours specifically on weekends. Facilities sometimes reduce RN presence on Saturdays and Sundays — a low weekend RN figure compared to weekday hours can indicate reduced clinical oversight when most administrative staff are absent. 24m per day ▼ 35% State avg: 37m per day · National avg: 29m per day

Capacity and availability

This home usually has limited availability

Higher occupancy than the Maryland average: 82.4%
Occupancy rate
91.7%
Avg. Length of Stay
178 days
Bed community size
50-bed community Rank #225 / 697Bed count — State benchmarkedThis home is ranked 225th out of 697 homes in Maryland. Shows this facility's certified or reported bed count compared to other Maryland facilities. Larger communities may offer more amenities, programs, and on-site services for residents and families.Rankings are based only on facilities in Maryland that report data for that category. Facilities without available data are excluded from the ranking.Click the rank badge to see the full State ranking.Click here to see the full State ranking.
A moderately sized community that may balance personal attention with shared amenities and social activities.
Walk Score
Walk Score: 12 / 100 Rank #802 / 985Walk Score — State benchmarkedThis home is ranked 802nd out of 985 homes in Maryland. Shows how walkable this facility's neighborhood is compared to the average Walk Score across Maryland facilities. Higher scores benefit residents, families, and staff.Rankings are based only on facilities in Maryland that report data for that category. Facilities without available data are excluded from the ranking.Click the rank badge to see the full State ranking.Click here to see the full State ranking.
Car-dependent. Most errands require a car, with limited nearby walkable options.

About this community

License Details

Accreditations5-Star Overall rating from CMS

Therapy & Rehabilitation

2 services
Rehabilitation Services
Respite Care

Staffing & Medical

1 service
24-Hour Staffing

Dining & Nutrition

Food DescriptionBalanced dining support available.

Contact Althea Woodland Nursing Home

Staffing Data

Reporting period: October 1 – December 31, 2025 (Q4 2025). Source: CMS Payroll-Based Journal report.

Total staff 60
Employees 49
Contractors 11
Staff to resident ratio 1.30 : 1
28% fewer staff per resident than Maryland average
Maryland average ratio: 1.81 : 1 Maryland average ratio: 1.81 : 1See full Maryland ranking
Avg staff/day 28
Average shift 7.5 hours
6% worse than Maryland average
Maryland average: 8 hours Maryland average shift: 8 hoursSee full Maryland ranking
Total staff hours (quarter) 19,440

Nursing staff breakdown

Q4 2025 · Oct 1 – Dec 31 More info This data comes from the CMS Payroll-Based Journal report covering October 1 – December 31, 2025.
Registered Nurse

Manages medical care and health needs.

RN Staff Info All 8 RN Staff are full-time employees. No contractors work on this role. 8
Average shift length Info Average shift length. Calculated as total hours divided by days worked and average staff per day. 8 hours
Licensed Practical Nurse

Assists with medical care and medications.

LPN Staff Info All 14 LPN Staff are full-time employees. No contractors work on this role. 14
Average shift length Info Average shift length. Calculated as total hours divided by days worked and average staff per day. 7.5 hours
Certified Nursing Assistant

Helps with daily care and mobility.

CNA Staff Info All 22 CNA Staff are full-time employees. No contractors work on this role. 22
Average shift length Info Average shift length. Calculated as total hours divided by days worked and average staff per day. 7.9 hours

Contractor staffing

Q4 2025 · Oct 1 – Dec 31 More info This data comes from the CMS Payroll-Based Journal report covering October 1 – December 31, 2025.

Total hours from contractors

7.1%

1,384 contractor hours this quarter

Speech Language Pathologist: 3 Respiratory Therapy Technician: 3 Physical Therapy Aide: 3 Qualified Social Worker: 1 Physical Therapy Assistant: 1

Staff by category

Q4 2025 · Oct 1 – Dec 31 More info This data comes from the CMS Payroll-Based Journal report covering October 1 – December 31, 2025.
Certified Nursing Assistant2202210,22992100%7.9
Licensed Practical Nurse140143,44292100%7.5
Registered Nurse8082,07192100%8
Speech Language Pathologist0335797076%6.2
RN Director of Nursing1015516470%8.6
Administrator1015286672%8
Nurse Practitioner1015286672%8
Physical Therapy Assistant0115086470%7.9
Dietitian1014686470%7.3
Mental Health Service Worker1012403033%8
Respiratory Therapy Technician0331653033%4.7
Physical Therapy Aide033861314%6.1
Qualified Social Worker011462830%1.7
22 Certified Nursing Assistant
% of Days 100%
14 Licensed Practical Nurse
% of Days 100%
8 Registered Nurse
% of Days 100%
3 Speech Language Pathologist
% of Days 76%
1 RN Director of Nursing
% of Days 70%
1 Administrator
% of Days 72%
1 Nurse Practitioner
% of Days 72%
1 Physical Therapy Assistant
% of Days 70%
1 Dietitian
% of Days 70%
1 Mental Health Service Worker
% of Days 33%
3 Respiratory Therapy Technician
% of Days 33%
3 Physical Therapy Aide
% of Days 14%
1 Qualified Social Worker
% of Days 30%

Penalties and fines

Federal penalties imposed by CMS for regulatory violations, including civil money penalties (fines) and denials of payment for new Medicare/Medicaid admissions.

Source: CMS Penalties Database

No penalties in the past 3 years

No civil money penalties or payment denials were reported in the last 3 years.

Quality of care over time

These measures show how residents usually do over time at this home, based on health outcomes and preventive care.

High-risk clinical events score Info A composite score based on pressure ulcers, falls with injury, weight loss, walking ability decline, and activities of daily living decline. 10.7
17% better than Maryland average

Maryland average: 12.9

Functional decline score Info A composite score based on activities of daily living decline, walking ability decline, and incontinence. 19.9
23% better than Maryland average

Maryland average: 25.7

Long-stay resident measures
Above average Maryland avg: 3.7 Info CMS star rating based on long-stay quality measure performance. 5 stars = significantly above average, 1 star = significantly below average.
Need for Help with Daily Activities Increased Info Percent of long-stay residents whose need for help with daily activities has increased 19.7%
17% better than Maryland average

Maryland average: 23.7%

Walking Ability Worsened Info Percent of long-stay residents whose ability to move independently worsened 26.9%
In line with Maryland average

Maryland average: 27.7%

Low Risk Residents with Bowel/Bladder Incontinence Info Percent of low risk long-stay residents who lose control of their bowels or bladder 13.1%
50% better than Maryland average

Maryland average: 25.9%

Falls with Major Injury Info Percent of long-stay residents experiencing one or more falls with major injury 1.2%
48% better than Maryland average

Maryland average: 2.3%

High Risk Residents with Pressure Ulcers Info Percent of long-stay high risk residents with pressure ulcers 3.2%
51% better than Maryland average

Maryland average: 6.5%

Urinary Tract Infection Info Percent of long-stay residents with a urinary tract infection 4.2%
164% worse than Maryland average

Maryland average: 1.6%

Lost Too Much Weight Info Percent of long-stay residents who lose too much weight 2.5%
57% better than Maryland average

Maryland average: 5.8%

Depressive Symptoms Info Percent of long-stay residents who have depressive symptoms 2.5%
87% better than Maryland average

Maryland average: 20.2%

Antipsychotic Use Info Percent of long-stay residents who received an antipsychotic medication 25.5%
97% worse than Maryland average

Maryland average: 12.9%

Pneumococcal Vaccine Info Percent of long-stay residents assessed and appropriately given the pneumococcal vaccine 72.6%
21% worse than Maryland average

Maryland average: 92.0%

Influenza Vaccine Info Percent of long-stay residents assessed and appropriately given the seasonal influenza vaccine 95.5%
In line with Maryland average

Maryland average: 96.6%

Hospitalizations per 1,000 days Info Number of hospitalizations per 1,000 long-stay resident days. 1.25
5% better than Maryland average

Maryland average: 1.32

ED visits per 1,000 days Info Number of outpatient emergency department visits per 1,000 long-stay resident days. 0.39
68% better than Maryland average

Maryland average: 1.21

Short-stay resident measures
Pneumococcal Vaccine Info Percent of short-stay residents assessed and appropriately given the pneumococcal vaccine 51.7%
34% worse than Maryland average

Maryland average: 78.4%

Antipsychotic medication increase Info Percent of short-stay residents who newly received an antipsychotic medication 0.0%
100% better than Maryland average

Maryland average: 1.4%

Successful return to home or community Info Rate of successful return to home or community from a skilled nursing facility. 37.1%
27% worse than Maryland average

Maryland average: 50.6%

Breakdown by payment type

Medicare

29% of new residents, usually for short-term rehab.

Typical stay 1 - 2 months

Private pay

47% of new residents, often for short stays.

Typical stay 4 - 5 months

Medicaid

23% of new residents, often for long-term daily care.

Typical stay 12 months

Facility Characteristics

Source: CMS Long-Term Care Facility Characteristics (Data as of Jan 2026)

Total residents 46
Medicare
3
6.5% of residents
Medicaid
20
43.5% of residents
Private pay or other
23
50% of residents
Programs & Services
Residents Group

Residents meet regularly to discuss policies, care quality, and activities

Active Resident Council

Organized group of residents that meets regularly to discuss facility policies, quality of life, and activities.

Finances and operations

Based on CMS SNF Cost Report for fiscal year ending in 12/2023.

Privately-owned community
Operated by a single business entity.
Net patient revenue Info Net patient revenue — what the home actually collects for resident care, after contractual allowances, bad debt and discounts are subtracted from its gross charges (CMS cost report, Worksheet G-3). It covers resident care only; money the home earns from other sources is shown separately as "Other income."
$6.3M
Net patient income Info Net patient income: net patient revenue minus the home's total operating expenses. A positive figure means it earns more from resident care than it spends to deliver it; a negative figure means the opposite. It excludes non-operating "other income."
$642.7K
Privately-owned community Operated by a single business entity.
Net patient revenue Info Net patient revenue — what the home actually collects for resident care, after contractual allowances, bad debt and discounts are subtracted from its gross charges (CMS cost report, Worksheet G-3). It covers resident care only; money the home earns from other sources is shown separately as "Other income."
$6.3M
Net patient income Info Net patient income: net patient revenue minus the home's total operating expenses. A positive figure means it earns more from resident care than it spends to deliver it; a negative figure means the opposite. It excludes non-operating "other income."
$642.7K
Other income Info Money the home earns outside of resident care — such as investments, grants, rentals and other non-operating sources (CMS cost report, Worksheet G-3). It is tracked separately from net patient revenue: it is not part of that figure, and it is not included in net patient income.
$1.4M
Payroll costs Info Staff salaries plus wage-related costs — benefits such as payroll taxes, health insurance and retirement — from the home's own accounting records (CMS cost report, Worksheet A). Contract or agency labor is counted separately, under other operating costs.
$2.5M 40.3% of net patient revenue Info Payroll as a share of revenue: staff salaries and wage-related benefits divided by net patient revenue. A higher figure means more of each revenue dollar goes to staff pay.
Other operating costs Info Everything it costs to run the home apart from payroll — food, utilities, supplies, maintenance, contract labor and administration. Calculated as total operating expense minus payroll (staff salaries and wage-related benefits).
$3.1M
Total costs Info The home's total operating expense for the year — all the costs of running it, salaries included (CMS cost report, Worksheet G-3).
$5.6M

Who this home usually serves

TYPE OF STAY

Mix of rehab and long-term care

This home supports both short-term rehab and long-term care, with residents staying for a wide range of durations.

New residents most often arrive under private pay (47% of admissions), and a typical private pay stay runs around 4 - 5 months.

Admissions
99 total

Coverage residents most often arrive under.

Medicare 29%
Private pay 47%
Medicaid 23%
Discharges
94 total

Coverage residents most often leave under.

Medicare 18%
Private pay 63%
Medicaid 19%

Managed by Adam Sanders

Administrator

Adam Sanders serves as the Administrator at Althea Woodland Nursing Home. He leads a dedicated team of licensed and trained healthcare professionals focused on delivering top-notch customer care and comprehensive healthcare management, ensuring residents receive compassionate and high-quality service.

Places of interest near Althea Woodland Nursing Home

Address 2.8 miles from city center Info Estimated distance in miles from Silver Spring's city center to Althea Woodland Nursing Home's address, calculated via Google Maps.

Calculate Travel Distance to Althea Woodland Nursing Home

Add your location

Address

Compare Nursing Homes around Silver Spring

The information below is reported by the Maryland Department of Health, Office of Health Care Quality.

5 facilities compared · CMS & MD Dept. of Health data

Bedford Court, a CCRC
NH
AL
HC
IL
MC
RC
Silver Spring (International Drive)
76
Facility 76
MD AVG 43
Rank #184 / 697
76.5% -7%4.81 -36%+27%$0237.7-43-
64
Facility 64
MD AVG 43
Rank #261 / 985
Welltower Opco Group LLC$23.1M$10.0M43.1%215246
Complete Care at Springbrook
NH
HC
PC
RC
Silver Spring
93
Facility 93
MD AVG 43
Rank #151 / 697
83.9% +2%2.77 -72%-27%$0336.6184A+
36
Facility 36
MD AVG 43
Rank #563 / 985
-$10.6M$4.8M45.1%215052
Althea Woodland Nursing Home
NH
HC
MC
RC
Silver Spring (Montgomery Knolls)
50
Facility 50
MD AVG 43
Rank #225 / 697
91.7% +11%3.79 -3%0%$0297.3-48-
12
Facility 12
MD AVG 43
Rank #802 / 985
Toni Meyer$6.3M$2.5M40.3%215228
Autumn Lake Healthcare at Silver Spring
NH
NC
PC
RC
Silver Spring
148
Facility 148
MD AVG 43
Rank #47 / 697
93.4% +13%3.51 +10%-7%$0
35
Facility 35
MD AVG 49.9
Rank #56 / 149
7.0-137-
16
Facility 16
MD AVG 43
Rank #772 / 985
2501 Musgrove Road Holdco LLC$10.8M$914.7k8.4%215224
Bel Pre Healthcare Center
NH
HC
MC
RC
Silver Spring (Bel Pre Road)
100
Facility 100
MD AVG 43
Rank #117 / 697
93.7% +14%4.36 +78%+16%$48.5k
55
Facility 55
MD AVG 49.9
Rank #101 / 149
13.8175F
52
Facility 52
MD AVG 43
Rank #402 / 985
Option Holdings II LLC$11.1M$5.4M
48.3%
Facility 48.3%
MD AVG 38.5%
Rank #99 / 148
215065

Financial Assistance for
Nursing Home in Maryland

Althea Woodland Nursing Home is located in Silver Spring, Maryland.
Here are the financial assistance programs available to residents in Maryland.

Get Financial aid guidance

Community Options Waiver

Maryland Medicaid Community Options Waiver

Age 65+ or disabled
General Maryland resident, Medicaid- eligible, nursing home-level care need.
Income Limits (2025) ~$2,829/month 300% FBR, individual
Asset Limits $2,000 (individual), $3,000 (couple) (excludes home, car).
MD

High urban demand; rural outreach efforts.

Benefits
Personal care (5-7 hours/day, e.g., bathing, dressing) Respite care (up to 240 hours/year) Adult day care ($70/day) Home modifications ($1,500 avg.)

Senior Care Program

Maryland Senior Care

Age 65+
General Maryland resident, at risk of nursing home placement.
Income Limits ~$2,000/month individual, varies by county
Asset Limits $11,000 individual
MD

Limited funding; waitlists common in high-demand areas.

Benefits
In-home care (3-5 hours/week) Respite care (up to 10 days/year) Meals (~$6/meal) Transportation (~5 trips/month) Case management

Maryland Nursing Home Medicaid

Maryland Medical Assistance (Medicaid) Nursing Home Program

Age 65+
General Maryland resident, Medicaid-eligible, requires nursing home-level care.
Income Limits (2025) $943/month (individual); most income applied to care costs.
Asset Limits $2,500 (individual), $3,000 (couple); spousal protections up to $155,356.
MD

Home equity limit $636,000; estate recovery applies post-55.

Benefits
24/7 nursing care Meals Therapy Medications (unlimited per medical need)

Senior Assisted Living Subsidy Program

Maryland Senior Assisted Living Group Home Subsidy

Age 62+
General Maryland resident, in or moving to approved assisted living, low/moderate income.
Income Limits (2025) ~$34,000/year individual, varies by county
Asset Limits Not strict; prioritizes low-income.
MD

Not available statewide; facility must be licensed by MDH.

Benefits
Personal care Meals 24-hour supervision (up to $1,500/month subsidy typical)

Veterans Aid and Attendance (A&A) Benefit

Maryland VA Aid and Attendance

Age
General Wartime veteran/spouse, age 65+ or disabled, needs ADL help, Maryland resident.
Income Limits (2025) Net income minus medical expenses < $1,984/month individual with A&A
Asset Limits $155,356 net worth limit
MD

High veteran population in suburban/rural areas.

Benefits
Cash benefit ($1,478-$2,471/month, varies by status) for care costs

Senior Prescription Drug Assistance Program (SPDAP)

Maryland Senior Prescription Drug Assistance Program

Age 65+
General Maryland resident (6+ months), Medicare Part D enrolled.
Income Limits (2025) $48,560/year individual, 300% FPL
Asset Limits None specified.
MD

Supplements Medicare Part D; annual enrollment required.

Benefits
Up to $40/month premium subsidy Reducing drug costs

Medicare Savings Programs (MSP)

Maryland Medicare Savings Programs

Age 65+
General Maryland resident, Medicare Part A/B enrollee.
Income Limits (2025) $2,014/month (QMB), $2,706/month (SLMB/QI, individual).
Asset Limits $9,090 (individual), $13,630 (couple).
MD

Includes QMB, SLMB, QI categories.

Benefits
Covers premiums (up to $174.70/month Part B) Co-pays Deductibles

Community Personal Assistance Services (CPAS)

Maryland Medicaid Community Personal Assistance Services

Age 65+
General Maryland resident, Medicaid-eligible, needs ADL assistance.
Income Limits (2025) $943/month (individual); spend-down available.
Asset Limits $2,500 (individual), $3,000 (couple).
MD

Consumer-directed option allows hiring family caregivers.

Benefits
Personal care (hours vary, typically 20-30/week) Chores Nurse supervision

Frequently Asked Questions about Althea Woodland Nursing Home

What neighborhood is Althea Woodland Nursing Home in?

Althea Woodland Nursing Home is in the Montgomery Knolls neighborhood.

Is Althea Woodland Nursing Home in a walkable area?

Althea Woodland Nursing Home has a walk score of 12. Car-dependent. Most errands require a car, with limited nearby walkable options.

What is the occupancy rate at Althea Woodland Nursing Home?

Althea Woodland Nursing Home's occupancy is 91.7%.

Are there photos of Althea Woodland Nursing Home?

Yes — there are 7 photos of Althea Woodland Nursing Home in the photo gallery on this page.

What is the address of Althea Woodland Nursing Home?

Althea Woodland Nursing Home is located at 1000 Daleview Dr, Silver Spring, MD 20901.

What is the phone number of Althea Woodland Nursing Home?

(301) 434-2646 will put you in contact with the team at Althea Woodland Nursing Home.

Is Althea Woodland Nursing Home Medicare or Medicaid certified?

Yes — Althea Woodland Nursing Home is a CMS-certified provider of Medicare and Medicaid.

Guides for Better Senior Living

Care Cost Calculator: See Prices in Your Area

Nursing Home Data Explorer

Don’t Wait Too Long: 7 Red Flag Signs Your Parent Needs Assisted Living Now

The True Cost of Assisted Living in 2025 – And How Families Are Paying For It

Understanding Senior Living Costs: Pricing Models, Discounts & Financial Assistance