


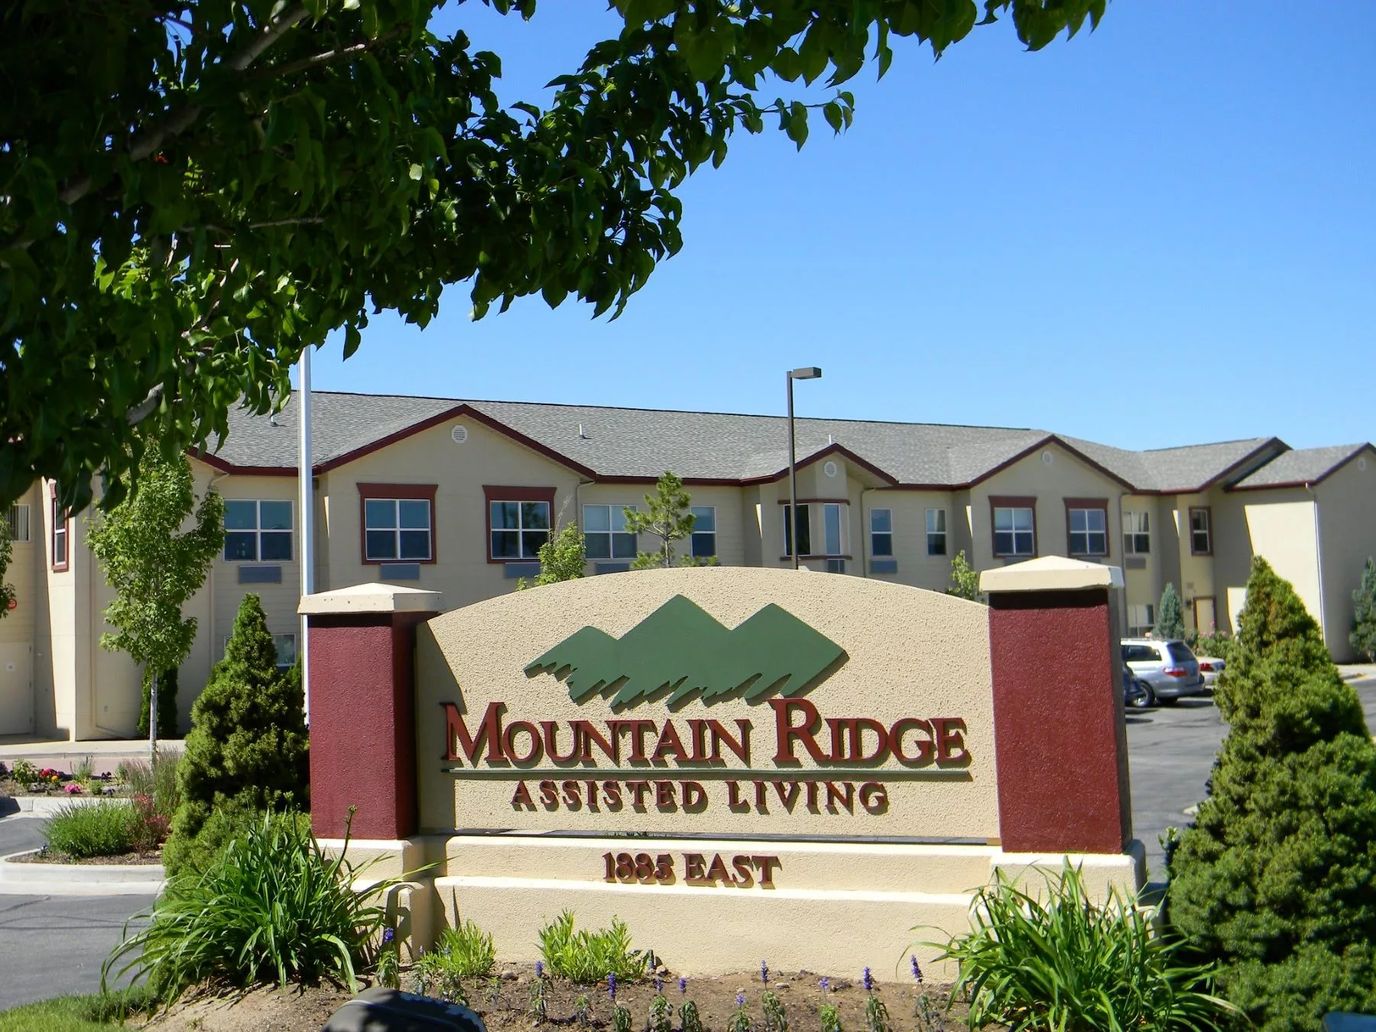
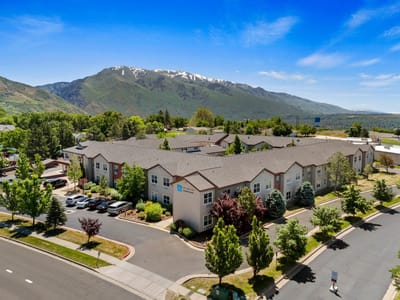
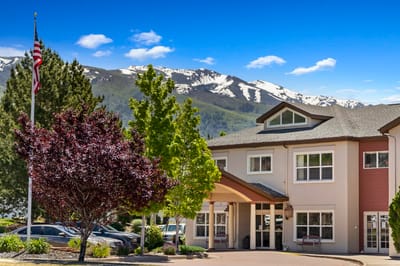
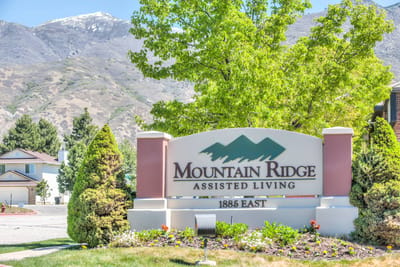
Avamere at Mountain Ridge
Assisted Living, Nursing Home & Memory Care · South Ogden, UT
Avamere at Mountain Ridge
Assisted Living, Nursing Home & Memory Care · South Ogden, UT
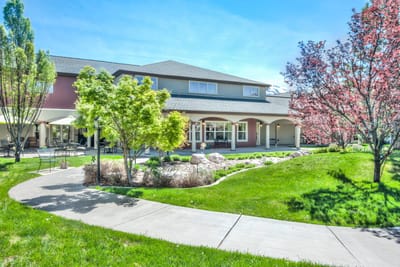
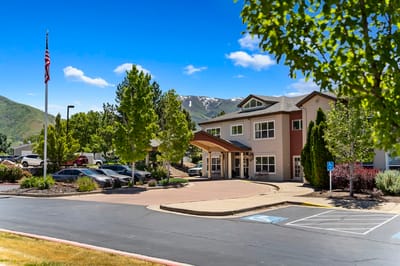
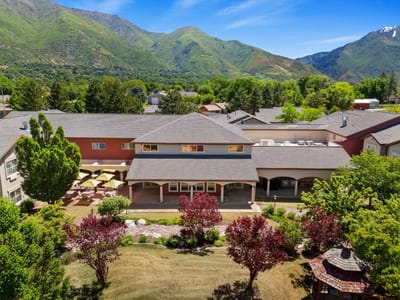
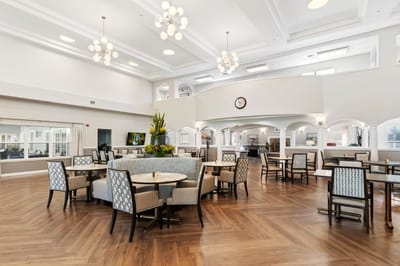
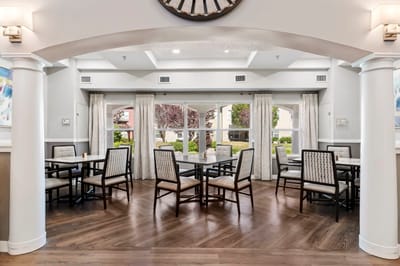
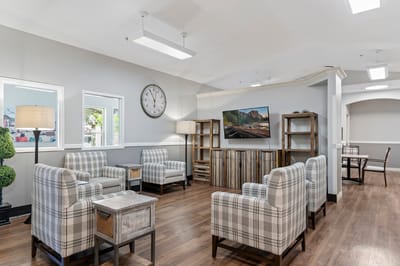
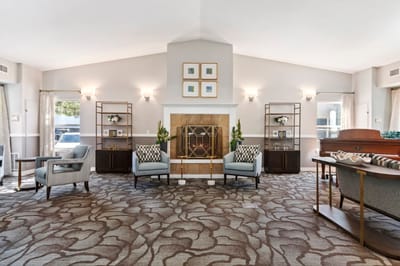
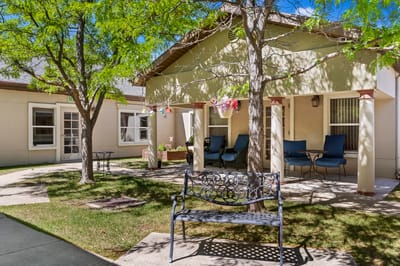
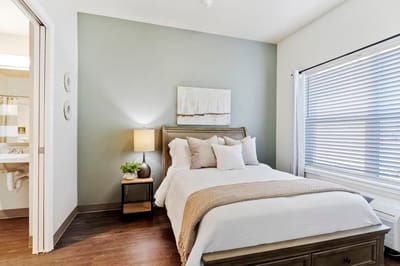
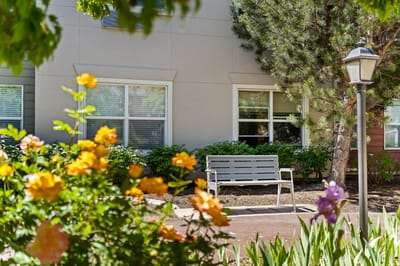
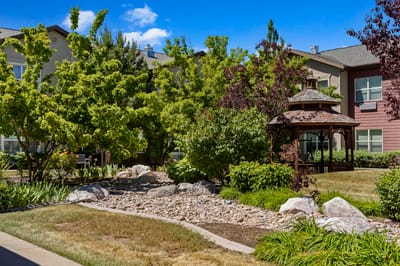
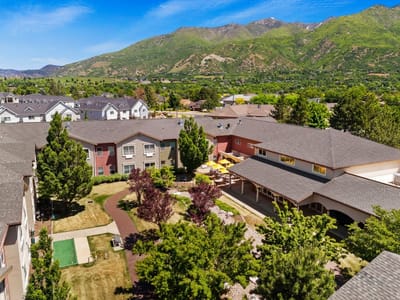
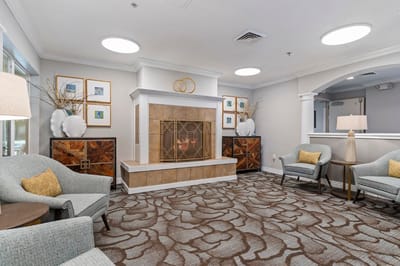
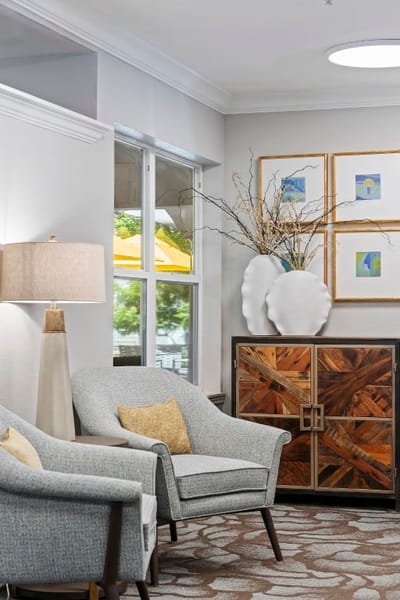
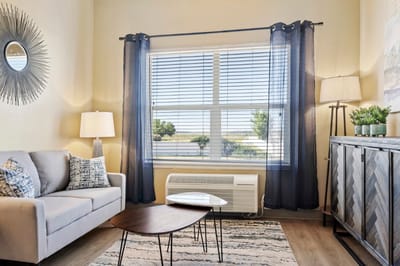
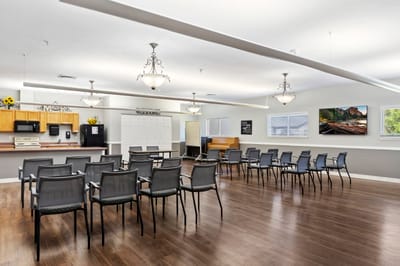
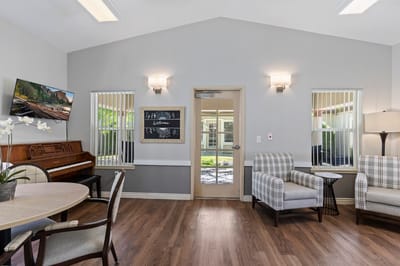
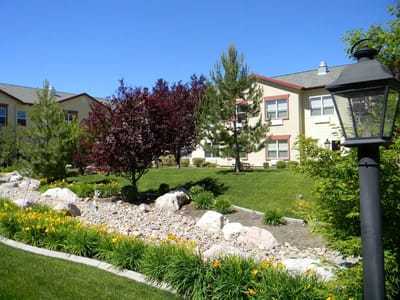
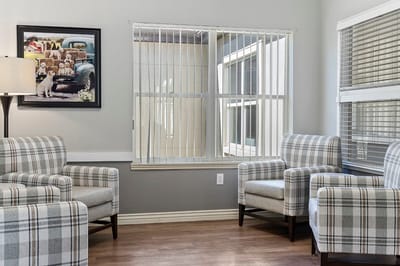
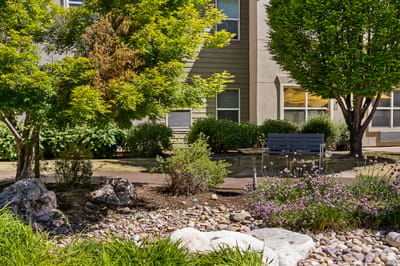
Avamere at Mountain Ridge is focused on promoting an active lifestyle for their independent living; while residents of assisted living are provided with familiarity and comfort; memory care is offered engaging activities. The enriching home continues to show that whatever category of living their residents are situated in, they are provided with quality healthcare. The lifestyle promoted in the community provides an environment where residents are able to celebrate their individuality and independence. Avamere at Mountain Ridge has welcomed seniors and families to their beautiful community that has been thoughtfully designed to have a wonderful time during their golden years.
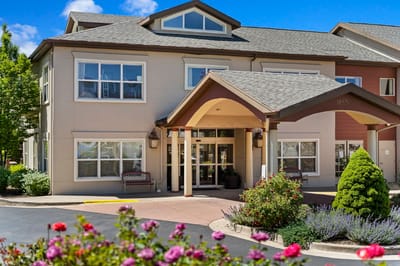
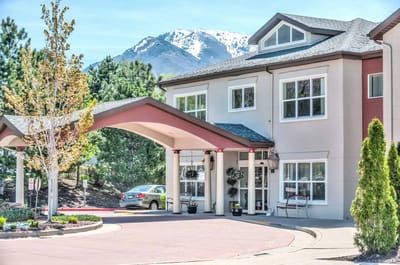
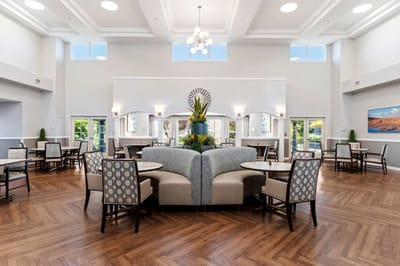
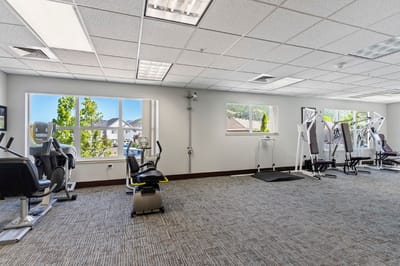
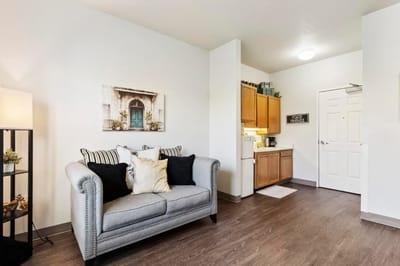
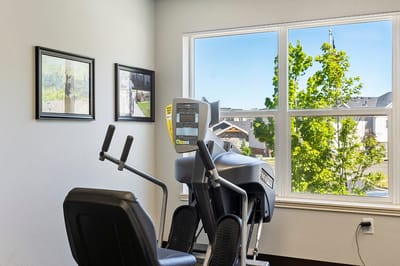
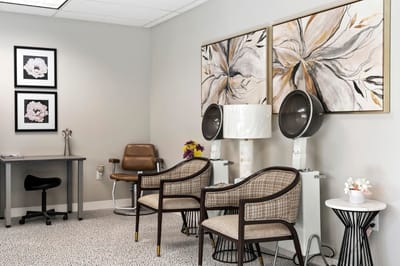
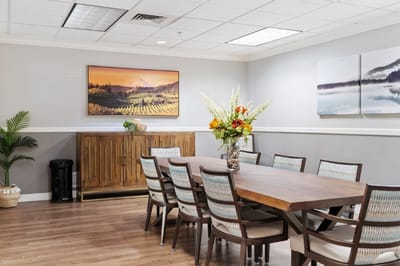
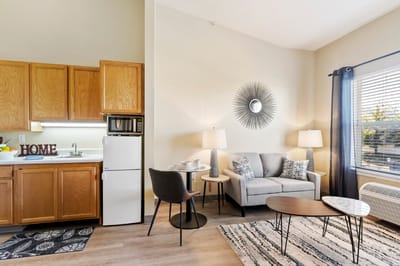
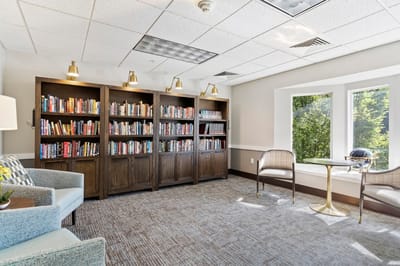
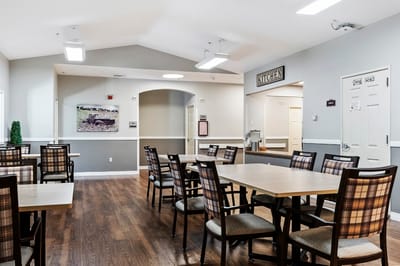
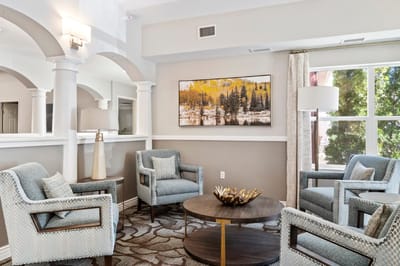
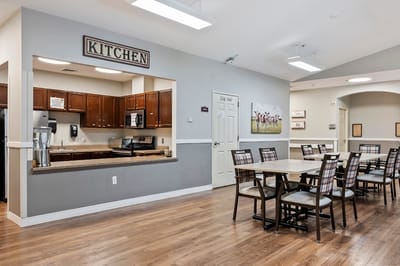
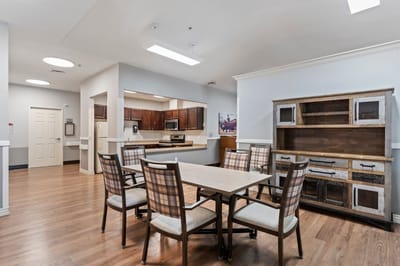
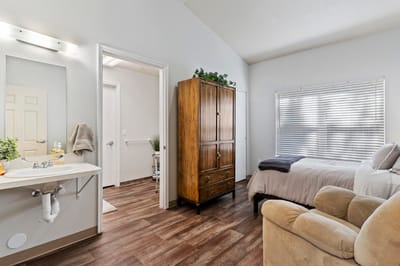
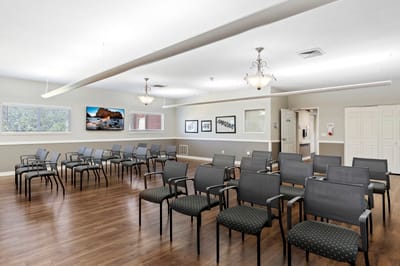
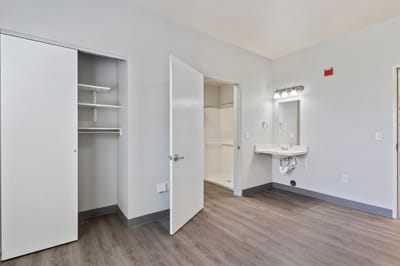
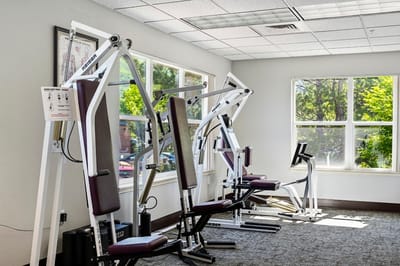
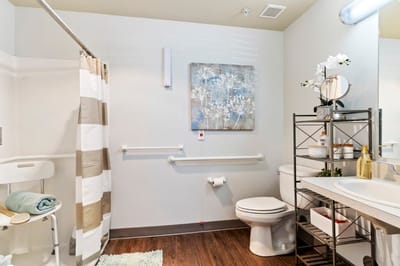
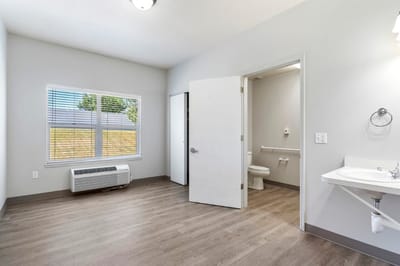
Avamere has ensured that residents are able to live comfortably through their helpful features that include wheelchair-accessible showers, high-speed internet, a kitchenette, cable or satellite TV, and an air-conditioned community– all designed to make their stay easy and hassle-free. A list of amenities that offer endless possibilities include their cafe or bistro, private dining room, dogs and cats allowed, barbershop and salon; as well as arts and crafts center, billiards lounge, fitness center, and library that allow for engaging and enriching activities to be held.
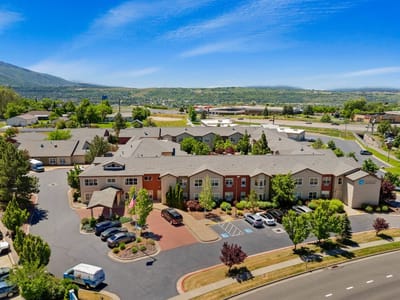
119-bed community Rank #42 / 192Bed count — State benchmarkedThis home is ranked 42nd out of 192 homes in Utah for bed count. Shows this facility's certified or reported bed count compared to other Utah facilities. Larger communities may offer more amenities, programs, and on-site services for residents and families.Facilities with the same value for a metric share the same rank. Rankings are based only on facilities in Utah that report data for that category. Facilities without available data are excluded from the ranking.Click the rank badge to see the full State ranking.Click here to see the full State ranking.
A larger shared setting that may offer more common spaces and organized community services.
23 years in operation Rank #84 / 197Years in operation — State benchmarkedThis home is ranked 84th out of 197 homes in Utah for years in operation. Shows how long this facility has been in operation compared to other Utah facilities. Longer operating histories may benefit residents, families, and staff.Facilities with the same value for a metric share the same rank. Rankings are based only on facilities in Utah that report data for that category. Facilities without available data are excluded from the ranking.Click the rank badge to see the full State ranking.Click here to see the full State ranking.
A longer operating history, which may indicate experience navigating regulations and delivering ongoing care.
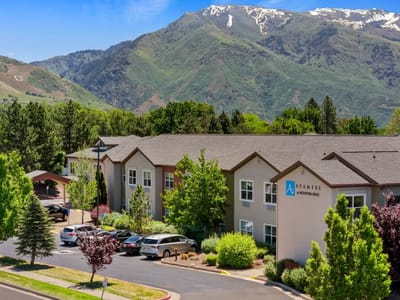
Walk Score: 56 / 100 Rank #118 / 280Walk Score — State benchmarkedThis home is ranked 118th out of 280 homes in Utah for walk score. Shows how walkable this facility's neighborhood is compared to the average walk score across Utah facilities. Higher scores benefit residents, families, and staff.Facilities with the same value for a metric share the same rank. Rankings are based only on facilities in Utah that report data for that category. Facilities without available data are excluded from the ranking.Click the rank badge to see the full State ranking.Click here to see the full State ranking.
Moderately walkable. Some errands can be accomplished on foot, with a mix of nearby amenities.
About this community
Facility TypeAssisted Living Facility - Type Ii
IssuanceJanuary 24, 2003
CountyWeber
Profit StatusFor-profit
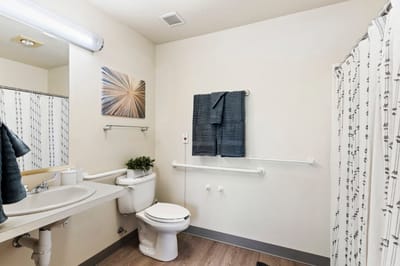
Wheelchair Accessible
Emergency SystemsEmergency call system.
Safety Features24-hour staff, call pendants, emergency responders on call 24/7, safety bars in bathrooms.
Rehabilitation Services
Respite Care
Nursing Services
24-Hour Staffing
No Alzheimer's certification
HousekeepingYes
Linen ServiceYes
Utilities IncludedYes
Activities
IL$3,689 per month
AL$4,281 per month
MC$4,874 per month
Inspection History
In Utah, the Department of Health and Human Services, Health Facility Licensing conducts regular onsite inspections to ensure compliance with state and federal healthcare standards.
Since 2025 · 1 year of data
11 deficiencies
7 inspections
Inspection Scorecard
 This scorecard compares key inspection, deficiency, and complaint metrics at this facility against the Utah state average. Metrics rated ≥15% worse than average are highlighted in red; those ≥15% better are highlighted in green.
Since 2025 vs. Utah state average
Overall vs. UT average
0 Worse
No metrics in this bucket.
4 Better
Metrics better than Utah average:
• Total deficiencies (21% below)
• Deficiencies per inspection (66% below)
• Inspections with deficiencies (50% below)
• Inspection deficiency rate (79% below)
• Total deficiencies (21% below)
• Deficiencies per inspection (66% below)
• Inspections with deficiencies (50% below)
• Inspection deficiency rate (79% below)
Deficiencies
| This Facility | UT Average | vs. UT Avg |
|---|---|---|---|
|
Total deficiencies
| 11 | 14 | This facility has 21% fewer total deficiencies than a typical Utah nursing home (11 vs. UT avg 14).↓ 21% better |
|
Deficiencies per inspection
| 1.6 | 4.7 | This facility has 66% fewer deficiencies per inspection than a typical Utah nursing home (1.6 vs. UT avg 4.7).↓ 66% better |
Inspections
| This Facility | UT Average | vs. UT Avg |
|---|---|---|---|
|
Total inspections
| 7 | 3 | This facility has had 133% more total inspections than the Utah average (7 vs. UT avg 3). More inspections can mean more regulatory scrutiny rather than worse care.↑ 133% more |
|
Inspections with deficiencies
| 1 | 2 | This facility has 50% fewer inspections with deficiencies than a typical Utah nursing home (1 vs. UT avg 2).↓ 50% better |
|
Inspection deficiency rate
| 14% | 67% | This facility has 53 percentage points lower inspection deficiency rate than a typical Utah nursing home (14% vs. UT avg 67%).↓ 53% better |
Inspection Reports Summary
An editor-reviewed summary of the themes and findings across this facility's recent inspection reports.
- The most recent inspection on January 22, 2025, found deficiencies in staff training, resident assessments, medication administration, and emergency preparedness. Earlier inspections were not provided for comparison, so the broader inspection pattern is unclear from the available data. Inspectors cited issues mainly related to staff competency, medication management, and facility maintenance, including housekeeping and safety measures. No complaint investigations or enforcement actions were listed in the available reports. Without prior reports for context, it is not possible to determine a clear trend in compliance over time.
What does this home offer?
Pets Allowed
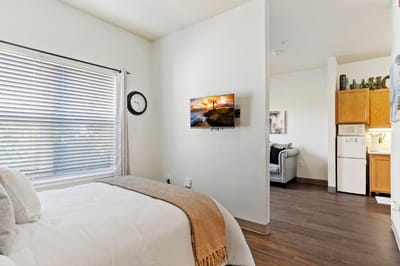
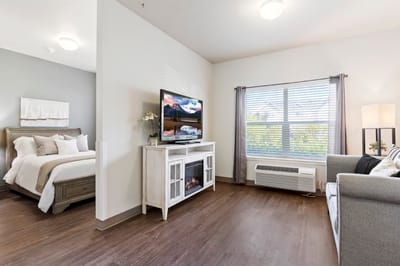
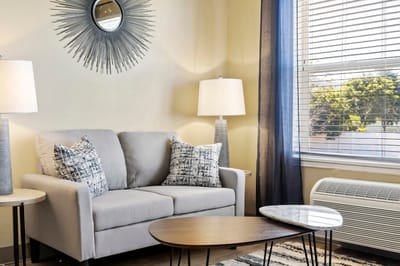
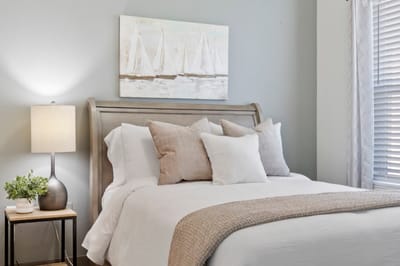
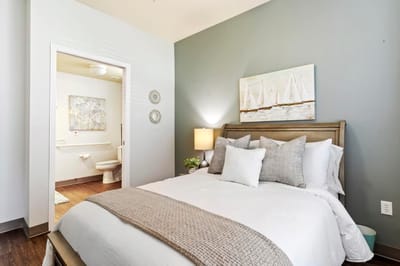
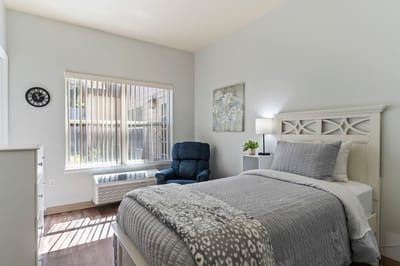
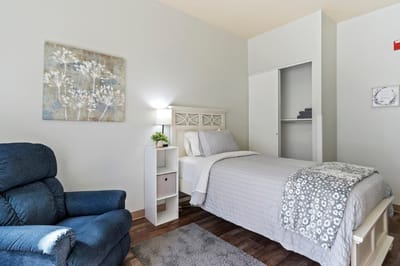
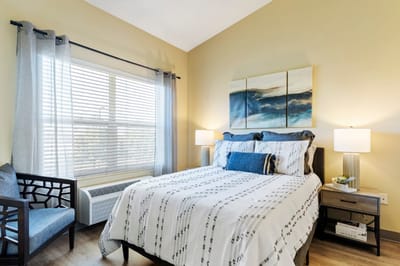
Living Spaces & Floor Plans for Avamere at Mountain Ridge
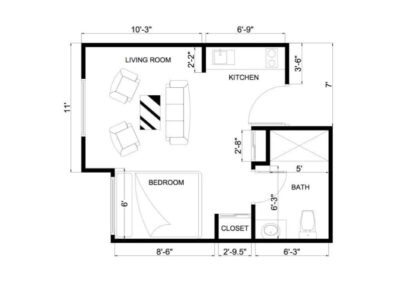

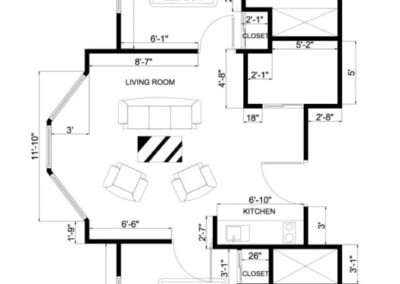

Studio
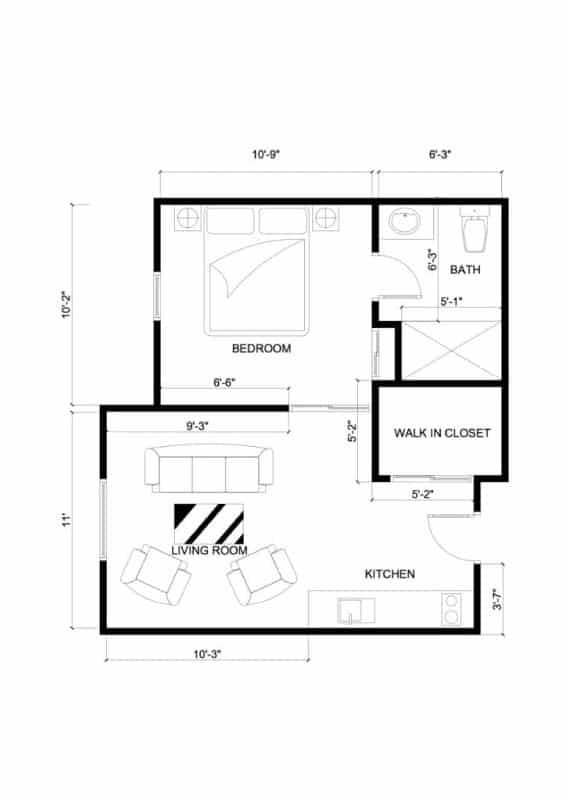
1 Bedroom

2 bedroom
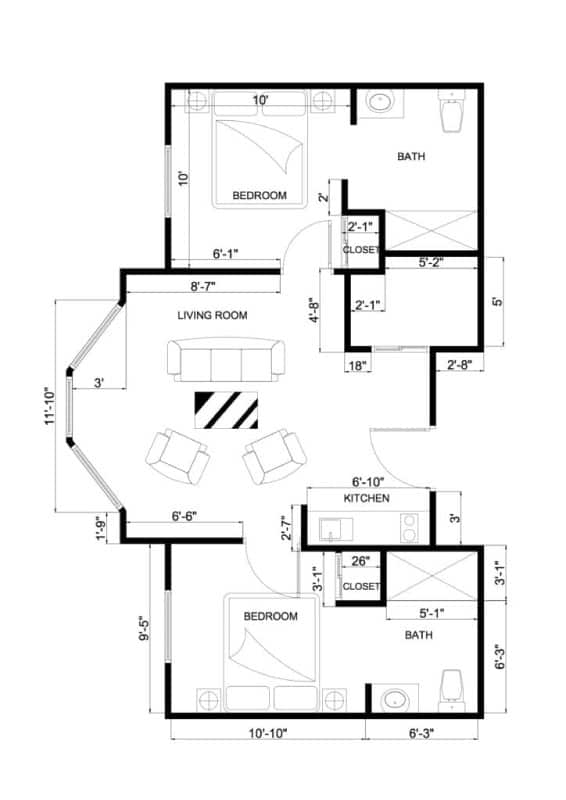
2 bedroom

1 Bedroom
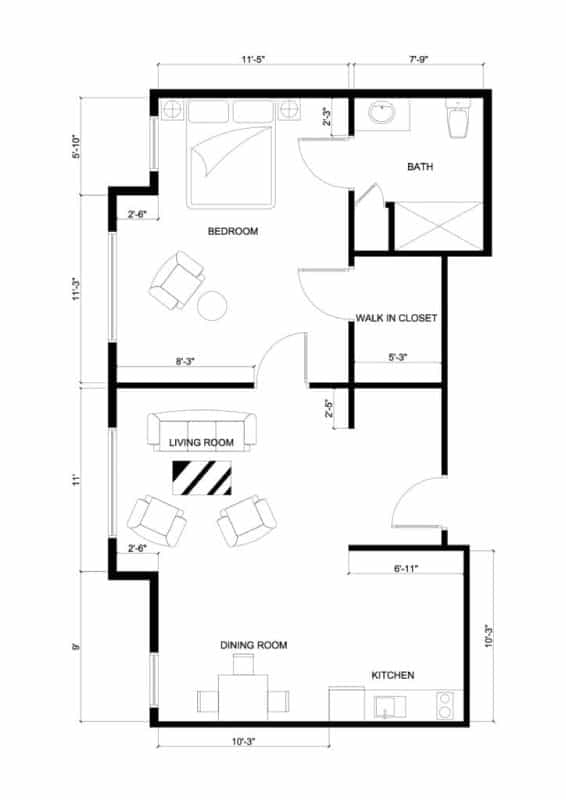
1 Bedroom
Places of interest near Avamere at Mountain Ridge
![]() 2.1 miles from city center
2.1 miles from city center
![]() Estimated distance in miles from South Ogden's city center to Avamere at Mountain Ridge's address, calculated via Google Maps.
Estimated distance in miles from South Ogden's city center to Avamere at Mountain Ridge's address, calculated via Google Maps.
Calculate Travel Distance to Avamere at Mountain Ridge
Add your location
Financial Assistance for
Assisted Living in Utah
Avamere at Mountain Ridge is located in South Ogden, Utah.
Here are the financial assistance programs available to residents in Utah.
Frequently Asked Questions about Avamere at Mountain Ridge
Is Avamere at Mountain Ridge in a walkable area?
Avamere at Mountain Ridge has a walk score of 56. Moderately walkable. Some errands can be accomplished on foot, with a mix of nearby amenities.
How long has Avamere at Mountain Ridge been in business?
Avamere at Mountain Ridge has been operating for approximately 23 years, based on available licensing and registration records.
Does Avamere at Mountain Ridge have different floorplan options?
Yes — see the floorplan options available at Avamere at Mountain Ridge on this page.
Are pets allowed at Avamere at Mountain Ridge?
Yes, Avamere at Mountain Ridge allows residents to bring their pets.
Does Avamere at Mountain Ridge operate as a for-profit or non-profit?
Avamere at Mountain Ridge is registered as a for-profit in UT.
How many beds does Avamere at Mountain Ridge have?
Avamere at Mountain Ridge has 119 beds.
Are there photos of Avamere at Mountain Ridge?
Yes — there are 56 photos of Avamere at Mountain Ridge in the photo gallery on this page.
Guides for Better Senior Living
Care Cost Calculator: See Prices in Your Area
Nursing Home Data Explorer
Don’t Wait Too Long: 7 Red Flag Signs Your Parent Needs Assisted Living Now
The True Cost of Assisted Living in 2025 – And How Families Are Paying For It
Understanding Senior Living Costs: Pricing Models, Discounts & Financial Assistance
Updated on
