Avamere Rehabilitation at Park West
Nursing Home · Seattle, WA
CMS overall rating Info The Overall CMS Rating is scored from 1 to 5 stars and combines results from health inspections, staffing levels, and quality measures. Health inspections carry the most weight. Staffing and quality scores can increase or decrease the final rating based on performance compared to state and national standards.

Avamere Rehabilitation at Park West

Nursing Home · Seattle, WA
CMS overall rating Info The Overall CMS Rating is scored from 1 to 5 stars and combines results from health inspections, staffing levels, and quality measures. Health inspections carry the most weight. Staffing and quality scores can increase or decrease the final rating based on performance compared to state and national standards.
Calculator: See prices in your area
Avamere Rehabilitation at Park West accepts Medicare, Medicaid, and private pay.

Overview of Avamere Rehabilitation at Park West

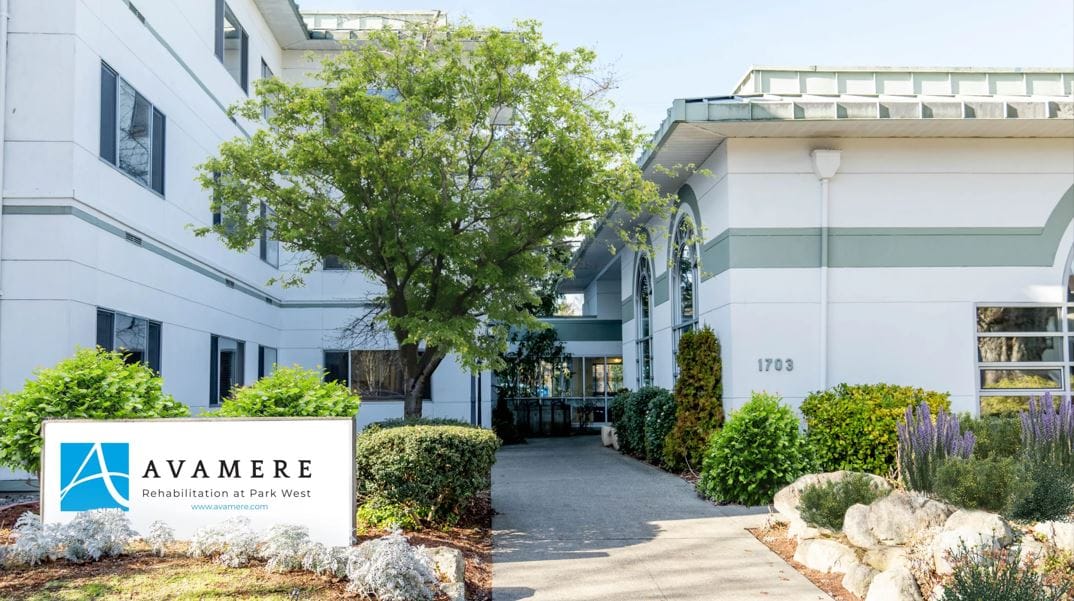
Seattle, Washington is fortunate to have Avamere Rehabilitation at Park West, a facility renowned for its exceptional professionalism and competence in the field of senior care. They provide an array of services including skilled nursing, long-term care, and rehabilitation, ensuring the highest quality outcomes for their residents. Additionally, they offer short-term and respite care, demonstrating their commitment to comprehensive and flexible support.
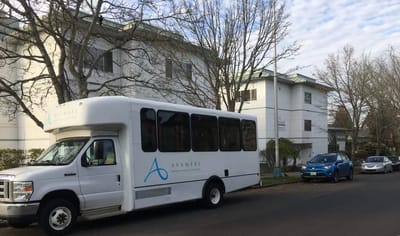
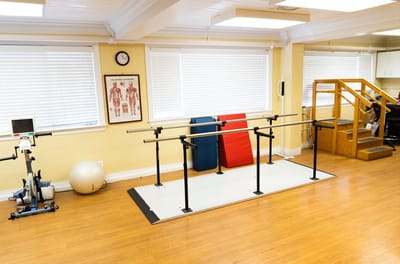
With an on-site therapy gym and telemedicine assistance, residents receive state-of-the-art care right at their doorstep. Avamere Rehabilitation at Park West also goes the extra mile by providing transportation assistance and installing nurse call systems and safety features in every room, ensuring residents’ safety and peace of mind. Moreover, the seamless collaboration between the dedicated staff and overseeing physicians creates an environment where residents can effortlessly regain their strength and independence, making Avamere Rehabilitation at Park West the go-to choice for top-notch care in the area.

(206) 937-9750

Quality ratings

Measured by Centers for Medicare & Medicaid Services (CMS)

Overall rating Info The Overall CMS Rating combines results from health inspections, staffing levels and quality measures. Health inspections carry the most weight. Staffing and quality scores can increase or decrease the final rating based on performance compared to state and national standards.
▼ 38.0% Below WA avg.
Health Inspection Info Based on the results of the facility's three most recent standard inspections and any complaint investigations. CMS reviews the number, scope, and severity of deficiencies, with more recent findings weighted more heavily.
▼ 29.0% Below WA avg.
Staffing Info Measures average nursing staff hours per resident per day, including Registered Nurses (RNs) and total nursing staff. Ratings are adjusted based on the level of care residents require and are compared to state and national benchmarks.
▼ 12.4% Below WA avg.
Quality Measures Info Based on clinical and physical health indicators reported to CMS, such as hospital readmissions, falls, pressure ulcers, and improvements in mobility. These measures reflect how well residents' health needs are being managed.
▲ 1.7% Above WA avg.

Staffing hours breakdown

Info Daily nursing hours per resident by staff type, reported to CMS. Higher is generally better — compare this facility to state and national averages to see where staffing stands.

Hours per resident per day — compared to Washington state averages

Total nursing care / resident Info This home is ranked 24th out of 59 homes in Washington.

Total adjusted nursing hours per resident per day, combining RN, LPN, and aide time. CMS adjusts this for case-mix so facilities can be fairly compared.
4h 18m per day
Rank #24 / 59Nurse hours — state benchmarkedThis home is ranked 24th out of 59 homes in Washington.Shows adjusted nurse hours per resident per day benchmarked to the Washington average, with a ranking across 59 Washington SNFs. More hours mean more direct care. The national average is about 3.5 hrs; below 3.0 is a red flag.
This facility Washington avg (4h 13m per day)
vs Washington avg
+2%

5 of 6 metrics below state avg

Standout metric LPN / LVN is +43% above state avg
Staff typeHours / dayvs state avg
Registered Nurse (RN) Info RNs hold the highest nursing license and can assess residents, interpret test results, and direct care plans. More RN hours per day often signals stronger clinical oversight and faster response to health changes. 29m per day ▼ 45% State avg: 53m per day · National avg: 41m per day
LPN / LVN Info Licensed Practical Nurses (LPNs) or Licensed Vocational Nurses (LVNs) deliver routine hands-on care — medication administration, wound dressing, and monitoring vital signs. They work under RN supervision and make up a large share of daily bedside care. 1h 10m per day ▲ 43% State avg: 49m per day · National avg: 52m per day
Nurse Aide Info Certified Nurse Aides (CNAs) provide the most direct day-to-day assistance: bathing, dressing, feeding, and mobility. Nurse aide hours are typically the largest staffing category and directly affect residents' quality of life. 2h 29m per day ▼ 7% State avg: 2h 41m per day · National avg: 2h 21m per day
Total Nursing (Weekend) Info Combined nursing hours (RN + LPN + Nurse Aide) per resident per day on weekends. Staffing often drops on weekends — this figure reveals whether the facility maintains adequate coverage outside of weekday hours. 3h 37m per day ▼ 5% State avg: 3h 47m per day · National avg: 3h 26m per day
Physical Therapist Info Hours per resident per day provided by licensed Physical Therapists (PTs) or PT Assistants. PT services help residents recover mobility after injury or illness and are especially important for post-acute (short-stay) rehabilitation. 3m per day ▼ 40% State avg: 5m per day · National avg: 4m per day
RN (Weekend) Info Registered nurse hours specifically on weekends. Facilities sometimes reduce RN presence on Saturdays and Sundays — a low weekend RN figure compared to weekday hours can indicate reduced clinical oversight when most administrative staff are absent. 20m per day ▼ 47% State avg: 38m per day · National avg: 29m per day

Capacity and availability

This home usually has availability

Occupancy lower than 85% suggests more openings may be available.

Lower occupancy than the Washington average: 72.5%
Occupancy rate 62.1% Rank #44 / 62Occupancy rate — state benchmarkedThis home is ranked 44th out of 62 homes in Washington.Shows this facility's occupancy rate versus the Washington average, with its statewide rank out of 62. Higher occupancy signals strong local demand and financial stability.
Avg. Length of Stay 98 days
Occupancy rate
62.1% Rank #44 / 62Occupancy rate — state benchmarkedThis home is ranked 44th out of 62 homes in Washington.Shows this facility's occupancy rate versus the Washington average, with its statewide rank out of 62. Higher occupancy signals strong local demand and financial stability.
Avg. Length of Stay
98 days

Who this home usually serves

TYPE OF STAY

Mostly short-term rehab stays

Most residents typically stay for a few weeks or months before returning home or moving on.

Breakdown by payment type

Medicare

61% of new residents, usually for short-term rehab.

Typical stay 17 days

Private pay

25% of new residents, often for short stays.

Typical stay 2 months

Medicaid

14% of new residents, often for long-term daily care.

Typical stay 1 years

Finances and operations

Privately-owned community
Home revenue
$12.4M
Operating loss
-$1.7M
Privately-owned community
Home revenue
$12.4M Rank #34 / 62Revenue — state benchmarkedThis home is ranked 34th out of 62 homes in Washington.Shows this facility's annual revenue compared to the Washington SNF average. Higher revenue generally means more resources for staffing and capital — read alongside Payroll %.
Operating loss
-$1.7M
Payroll costs Info The portion of the home's budget spent on staff, including nurses, caregivers, and other employees who support care and operations. Rank #32 / 62Payroll — state benchmarkedThis home is ranked 32nd out of 62 homes in Washington.Shows total annual staff payroll benchmarked to the Washington average. Higher payroll investment relative to peers often signals better staffing and less reliance on cheaper contract labor.
$6.8M
54.7% of revenue Rank #20 / 62Payroll % — state benchmarkedThis home is ranked 20th out of 62 homes in Washington.Shows payroll as a percentage of revenue versus the Washington average. Well-run SNFs often land around 55–65%. Below 25% may signal understaffing or heavy agency use — read with Staffing ratings.
Other operating costs Info All remaining costs needed to run the home, such as food, utilities, building maintenance, supplies and administrative expenses.
$7.4M
Total costs $14.2M
Walk Score
Walk Score: 71 / 100 Rank #12 / 55Walk Score — state benchmarkedThis home is ranked 12th out of 55 homes in Washington.Shows how walkable this facility's neighborhood is compared to the average Walk Score across Washington SNFs. Higher scores benefit residents, families, and staff.
Very walkable. Most errands can be accomplished on foot, and many essentials are within a short walk.

Contact Avamere Rehabilitation at Park West

Health Inspection History

Inspections
Total health inspections 8

Washington average 7.8


Last Health inspection on Jul 2025

Total health citations
60 Rank #40 / 59Health citations — state benchmarkedThis home is ranked 40th out of 59 homes in Washington.Shows this facility's total health deficiency citations benchmarked to the Washington state average, with a ranking across all 59 WA SNFs. Lower citation counts earn a better rank.

Washington average 48.9

Citations per inspection
7.5 Rank #37 / 59Citations per inspection — state benchmarkedThis home is ranked 37th out of 59 homes in Washington.Shows average deficiency citations per CMS inspection for this facility versus the Washington mean across 59 SNFs with citation data. Lower is better.

Washington average 6.92


Health citations are formal notices following inspections when they fail to comply with safety and care standards.

50 of 60 citations resulted from standard inspections; and 7 of 60 resulted from complaint investigations.

Breakdown of citation severity (last 3 years)
Critical Health citations More info
2
567% worse than Washington average

Washington average: 0.3


Serious Health citations More info 2
18% worse than Washington average

Washington average: 1.7

2 critical citations More info Washington average: 0.3

2 serious citations More info Washington average: 1.7

56 moderate citations More info Washington average: 46.3

0 minor citations More info Washington average: 0.5
Citations history (last 3 years)
Abuse/Neglect moderate citation Info Issues related to protecting resident's from harm, including abuse, neglect, or mistreatment. Jul 29, 2025
Corrected

Abuse/Neglect moderate citation Info Issues related to protecting resident's from harm, including abuse, neglect, or mistreatment. Jul 29, 2025
Corrected

Infection Control moderate citation Info Issues related to preventing and controlling infections, including hygiene practices and safety protocols. Jul 29, 2025
Corrected

Infection Control moderate citation Info Issues related to preventing and controlling infections, including hygiene practices and safety protocols. Jul 29, 2025
Corrected

Financial Assistance for
Nursing Home in Washington

Avamere Rehabilitation at Park West is located in Seattle, Washington.
Here are the financial assistance programs available to residents in Washington.

Get Financial aid guidance

Community Options Program Entry System (COPES)

WA Medicaid COPES

Age 65+ or disabled
General Washington resident, Medicaid-eligible, nursing home-level care need.
Income Limits (2025) ~$2,829/month 300% FBR, individual
Asset Limits $2,000 (individual), $3,000 (couple).
WA

High demand in urban areas (e.g., Seattle).

Benefits
Personal care (5-7 hours/day) Respite (240 hours/year) Adult day care ($70/day) Home modifications ($1,500 avg.)

Washington Family Caregiver Support Program

WA NFCSP

Age Caregiver of someone 60+ (or with dementia)
General Washington resident.
Income Limits No strict limit; prioritizes low-income.
Asset Limits Not applicable.
WA

High urban demand; rural outreach.

Benefits
In-home respite (4-6 hours/day) Adult day care (~$70/day) Short-term facility care (up to 5 days)

Community First Choice (CFC)

Washington Community First Choice

Age 65+ (or disabled 18+)
General WA resident, Medicaid-eligible, need help with 2+ ADLs/IADLs.
Income Limits (2025) ~$2,829/month; QIT optional.
Asset Limits $2,000 (individual), $3,000 (couple).
WA

Broader than COPES; serves ~20,000; self-directed option.

Benefits
Personal care (4-6 hours/day) Respite (~240 hours/year) Assistive devices Training Transportation

Older Americans Act (OAA) Services

Washington OAA Services

Age 60+
General WA resident; no income/asset limits.
Income Limits (2025) None; donations encouraged.
Asset Limits Not assessed.
WA

13 AAAs; includes Meals on Wheels; rural focus.

Benefits
Meals (~$5-$7/meal) Transportation Homemaker services (~4 hours/week) Respite (~5 days/year) Legal aid

Medicare Savings Program (MSP)

Washington Medicare Savings Program

Age 65+ or disabled
General WA resident, Medicare Part A/B.
Income Limits (2025) ~$2,510/month (QMB), ~$3,380/month (SLMB), ~$3,598/month (QI)—individual.
Asset Limits $9,430 (individual), $14,130 (couple).
WA

Includes Extra Help for Part D; no waitlist.

Benefits
Covers Part B premiums ($174.70/month) Deductibles ($240/year) Copays (~20%)

VA Aid and Attendance (A&A) and Housebound Benefits

Washington VA Aid and Attendance/Housebound

Age 65+ or disabled veteran/spouse
General WA resident, wartime service, ADL help (A&A) or homebound.
Income Limits (2025) Net income < ~$1,984/month (veteran with dependent, A&A); pension offsets income.
Asset Limits ~$155,356 net worth
WA

High veteran use; supports rural/urban needs.

Benefits
Cash (~$1,433-$2,642/month veteran, ~$951-$1,318 spouse) for care costs

Senior Citizens Property Tax Exemption

Washington Senior Property Tax Exemption

Age 61+ or disabled retiree
General WA resident, homeowner, income-based.
Income Limits (2025) ~$45,000-$70,000/year varies by county, e.g., King: $70,000
Asset Limits Not assessed; home value cap varies ~$250,000-$400,000
WA

Saves ~$500-$1,500/year; offered statewide.

Benefits
Tax exemption (~$500-$1,500/year depending on county)

Senior Farmers’ Market Nutrition Program (SFMNP)

Washington SFMNP

Age 60+
General WA resident, low-income.
Income Limits (2025) ~$2,322/month 185% FPL
Asset Limits Not assessed.
WA

Vouchers (~$80/season); serves ~20,000 via AAAs.

Benefits
Vouchers (~$80/season) for produce at farmers’ markets

Places of interest near Avamere Rehabilitation at Park West

Address 2.8 miles from city center Info Estimated distance in miles from Seattle's city center to Avamere Rehabilitation at Park West's address, calculated via Google Maps. — 2.91 miles to nearest hospital (Seattle Dermatology Center)

Calculate Travel Distance to Avamere Rehabilitation at Park West

Add your location

Address

Staffing Data (Q2 2025)

This data corresponds to Q2 2025 and is based on CMS Payroll-Based Journal.

Total staff 135
Employees 120
Contractors 15
Staff to resident ratio 1.45:1
22% worse than Washington average

Washington average ratio: 1.85:1

Avg staff/day 51
Average shift 8.5 hours
5% better than Washington average

Washington average: 8.1 hours

Total staff hours (quarter) 39,414

Nursing staff breakdown

Registered Nurse

Manages medical care and health needs.

Total count 12
Average shift length Info Average shift length. Calculated as total hours divided by days worked and average staff per day. 9.8 hours

No contractors work on this role.

Licensed Practical Nurse

Assists with medical care and medications.

Total count 30
Average shift length Info Average shift length. Calculated as total hours divided by days worked and average staff per day. 10 hours

This role is partially covered by contractors.

Certified Nursing Assistant

Helps with daily care and mobility.

Total count 67
Average shift length Info Average shift length. Calculated as total hours divided by days worked and average staff per day. 8.3 hours

This role is partially covered by contractors.

Contractor staffing

Total hours from contractors

1%

380 contractor hours this quarter

Certified Nursing Assistant: 8 Licensed Practical Nurse: 5 Medical Director: 1 Occupational Therapy Assistant: 1

Staff by category

Certified Nursing Assistant5986719,53491100%8.3
Licensed Practical Nurse255308,81191100%10
Registered Nurse120123,48791100%9.8
Nurse Aide in Training6061,2118998%7.8
RN Director of Nursing1016306571%9.7
Mental Health Service Worker1016006470%9.4
Clinical Nurse Specialist1015486369%8.7
Nurse Practitioner1015126470%8
Dietitian1014996875%7.3
Other Dietary Services Staff1014996167%8.2
Administrator1014725965%8
Dental Services Staff1014725965%8
Qualified Social Worker1014616369%7.3
Speech Language Pathologist1014326470%6.8
Physical Therapy Aide1013636066%6.1
Respiratory Therapy Technician3033425763%6
Physical Therapy Assistant3033236167%5.3
Occupational Therapy Aide1011045763%1.8
Occupational Therapy Assistant011681112%6.1
Medical Director011481213%4
67 Certified Nursing Assistant
% of Days 100%
30 Licensed Practical Nurse
% of Days 100%
12 Registered Nurse
% of Days 100%
6 Nurse Aide in Training
% of Days 98%
1 RN Director of Nursing
% of Days 71%
1 Mental Health Service Worker
% of Days 70%
1 Clinical Nurse Specialist
% of Days 69%
1 Nurse Practitioner
% of Days 70%
1 Dietitian
% of Days 75%
1 Other Dietary Services Staff
% of Days 67%
1 Administrator
% of Days 65%
1 Dental Services Staff
% of Days 65%
1 Qualified Social Worker
% of Days 69%
1 Speech Language Pathologist
% of Days 70%
1 Physical Therapy Aide
% of Days 66%
3 Respiratory Therapy Technician
% of Days 63%
3 Physical Therapy Assistant
% of Days 67%
1 Occupational Therapy Aide
% of Days 63%
1 Occupational Therapy Assistant
% of Days 12%
1 Medical Director
% of Days 13%

Facility Characteristics

Source: CMS Long-Term Care Facility Characteristics (Data as of Jan 2026)

Total residents 93
Medicare
16
17.2% of residents
Medicaid
64
68.8% of residents
Private pay or other
13
14% of residents
Programs & Services
Residents Group

Residents meet regularly to discuss policies, care quality, and activities

Active Resident Council

Organized group of residents that meets regularly to discuss facility policies, quality of life, and activities.

Quality of care over time

These measures show how residents usually do over time at this home, based on health outcomes and preventive care.

High-risk clinical events score Info A composite score based on pressure ulcers, falls with injury, weight loss, walking ability decline, and activities of daily living decline. 9.1
9% better than Washington average

Washington average: 10.0

Functional decline score Info A composite score based on activities of daily living decline, walking ability decline, and incontinence. 14.4
31% better than Washington average

Washington average: 20.9

Long-stay resident measures
Above average Washington avg: 3.6 Info CMS star rating based on long-stay quality measure performance. 5 stars = significantly above average, 1 star = significantly below average.
Need for Help with Daily Activities Increased Info Percent of long-stay residents whose need for help with daily activities has increased 12.6%
23% better than Washington average

Washington average: 16.4%

Walking Ability Worsened Info Percent of long-stay residents whose ability to move independently worsened 19.7%
10% better than Washington average

Washington average: 21.8%

Low Risk Residents with Bowel/Bladder Incontinence Info Percent of low risk long-stay residents who lose control of their bowels or bladder 11.0%
55% better than Washington average

Washington average: 24.3%

Falls with Major Injury Info Percent of long-stay residents experiencing one or more falls with major injury 1.5%
41% better than Washington average

Washington average: 2.6%

High Risk Residents with Pressure Ulcers Info Percent of long-stay high risk residents with pressure ulcers 6.9%
40% worse than Washington average

Washington average: 4.9%

Urinary Tract Infection Info Percent of long-stay residents with a urinary tract infection 1.3%
28% better than Washington average

Washington average: 1.7%

Lost Too Much Weight Info Percent of long-stay residents who lose too much weight 4.9%
15% better than Washington average

Washington average: 5.8%

Depressive Symptoms Info Percent of long-stay residents who have depressive symptoms 9.5%
41% better than Washington average

Washington average: 16.2%

Antipsychotic Use Info Percent of long-stay residents who received an antipsychotic medication 15.7%
9% worse than Washington average

Washington average: 14.5%

Pneumococcal Vaccine Info Percent of long-stay residents assessed and appropriately given the pneumococcal vaccine 95.4%
In line with Washington average

Washington average: 96.2%

Influenza Vaccine Info Percent of long-stay residents assessed and appropriately given the seasonal influenza vaccine 95.5%
In line with Washington average

Washington average: 93.8%

Hospitalizations per 1,000 days Info Number of hospitalizations per 1,000 long-stay resident days. 1.43
In line with Washington average

Washington average: 1.38

ED visits per 1,000 days Info Number of outpatient emergency department visits per 1,000 long-stay resident days. 0.54
64% better than Washington average

Washington average: 1.51

Short-stay resident measures
Average Washington avg: 3.6 Info CMS star rating based on short-stay quality measure performance. 5 stars = much above average, 1 star = much below average.
Pneumococcal Vaccine Info Percent of short-stay residents assessed and appropriately given the pneumococcal vaccine 91.4%
In line with Washington average

Washington average: 88.1%

Antipsychotic medication increase Info Percent of short-stay residents who newly received an antipsychotic medication 1.1%
25% better than Washington average

Washington average: 1.4%

Influenza Vaccine Info Percent of short-stay residents assessed and appropriately given the seasonal influenza vaccine 84.0%
In line with Washington average

Washington average: 82.0%

Re-hospitalized after SNF stay Info Percentage of short-stay residents who were re-hospitalized after their nursing home admission. 26.5%
33% worse than Washington average

Washington average: 19.9%

Emergency department visits Info Percentage of short-stay residents who had an outpatient emergency department visit. 14.4%
9% worse than Washington average

Washington average: 13.2%

Falls with major injury Info Percentage of SNF residents who experience falls with major injury during their stay. 0.0%
100% better than Washington average

Washington average: 0.8%

Ability to care for self at discharge Info Percentage of residents at or above expected ability to care for themselves at discharge. 44.2%
18% worse than Washington average

Washington average: 53.7%

Successful return to home or community Info Rate of successful return to home or community from a skilled nursing facility. 60.9%
21% better than Washington average

Washington average: 50.6%

Penalties and fines

Federal penalties imposed by CMS for regulatory violations, including civil money penalties (fines) and denials of payment for new Medicare/Medicaid admissions.

Source: CMS Penalties Database (Data as of Jan 2026)

Total fines amount $78K
5% lower than Washington average

Washington average: $82K

Number of fines 2
8% more fines than Washington average

Washington average: 1.8

Payment Denials Info Serious action where Medicare and/or Medicaid temporarily stops payments for new residents until issues are fixed. 0
100% fewer payment denials than Washington average

Washington average: 0.3

Fines amount comparison
This facility $78K
Washington average $82K
Penalty History

Penalties are imposed by CMS for violations of federal nursing home regulations.

1 penalty in the past 3 years

Feb 6, 2024 · $30K

Civil Money Penalty Info Fines imposed for noncompliance, which can be assessed per day or per instance of violation. Feb 6, 2024
$30K

Last updated: Jan 2026

Guides for Better Senior Living

Care Cost Calculator: See Prices in Your Area

Nursing Home Data Explorer

Don’t Wait Too Long: 7 Red Flag Signs Your Parent Needs Assisted Living Now

The True Cost of Assisted Living in 2025 – And How Families Are Paying For It

Understanding Senior Living Costs: Pricing Models, Discounts & Financial Assistance

Frequently Asked Questions about Avamere Rehabilitation at Park West

What neighborhood is Avamere Rehabilitation at Park West in?

Avamere Rehabilitation at Park West is in the North Admiral neighborhood.

Is Avamere Rehabilitation at Park West in a walkable area?

Avamere Rehabilitation at Park West has a walk score of 71. Very walkable. Most errands can be accomplished on foot, and many essentials are within a short walk.

What is the phone number of Avamere Rehabilitation at Park West?

(206) 937-9750 will put you in contact with the team at Avamere Rehabilitation at Park West.

Is Avamere Rehabilitation at Park West Medicare or Medicaid certified?

Yes — Avamere Rehabilitation at Park West is a CMS-certified provider of Medicare and Medicaid.

Explore Open Rooms
1 Contact details
2 What type of senior care service are you looking for?
3 What budget do you have in mind for senior care?
4 How soon do you need to find care?
5 Additional details

Thank you for your interest!

Our team will be in touch shortly to help with next steps.