Nursing Home

Avantara Evergreen Park

Nursing Home

Avantara Evergreen Park

10124 S Kedzie Ave, Evergreen Park, IL 60805 View map
Overview of Avantara Evergreen Park

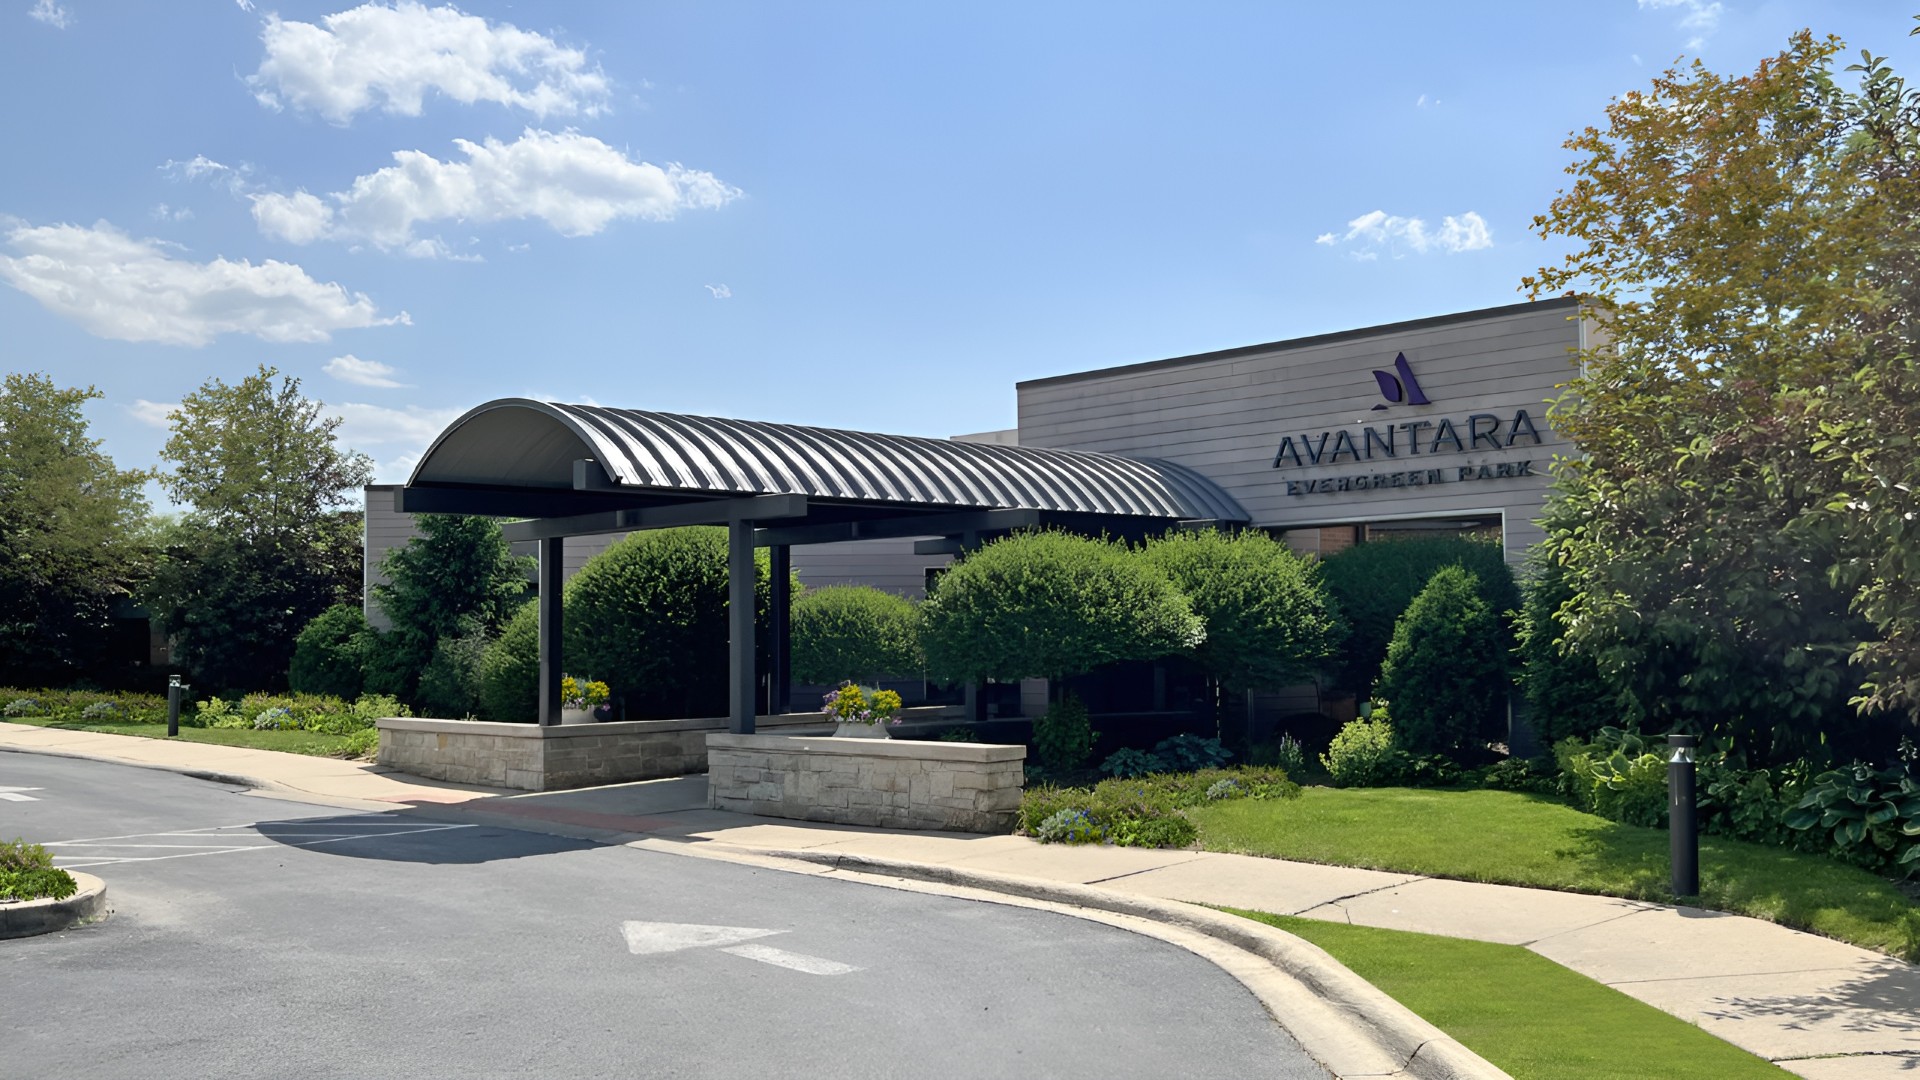
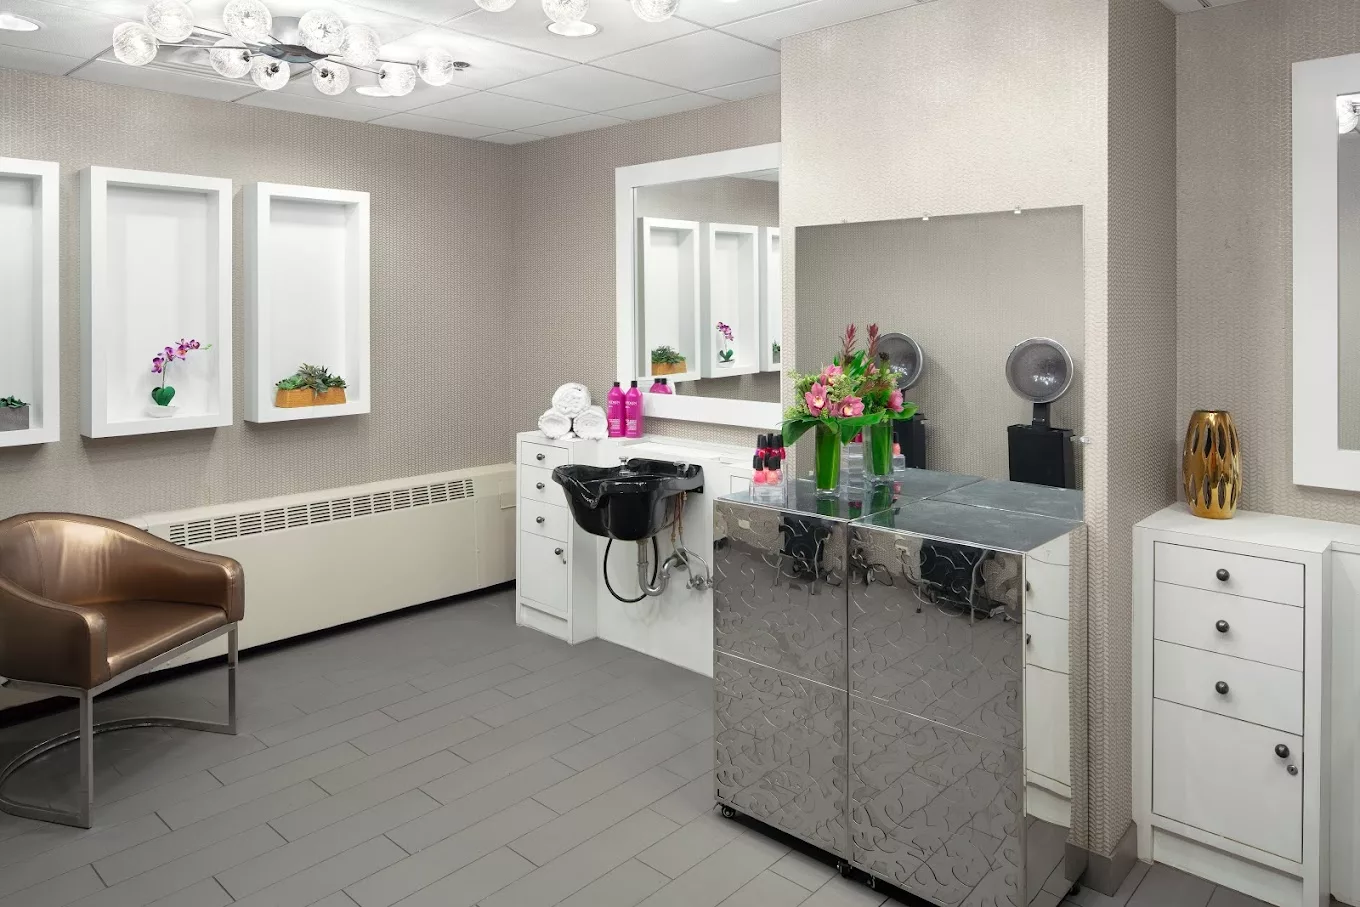
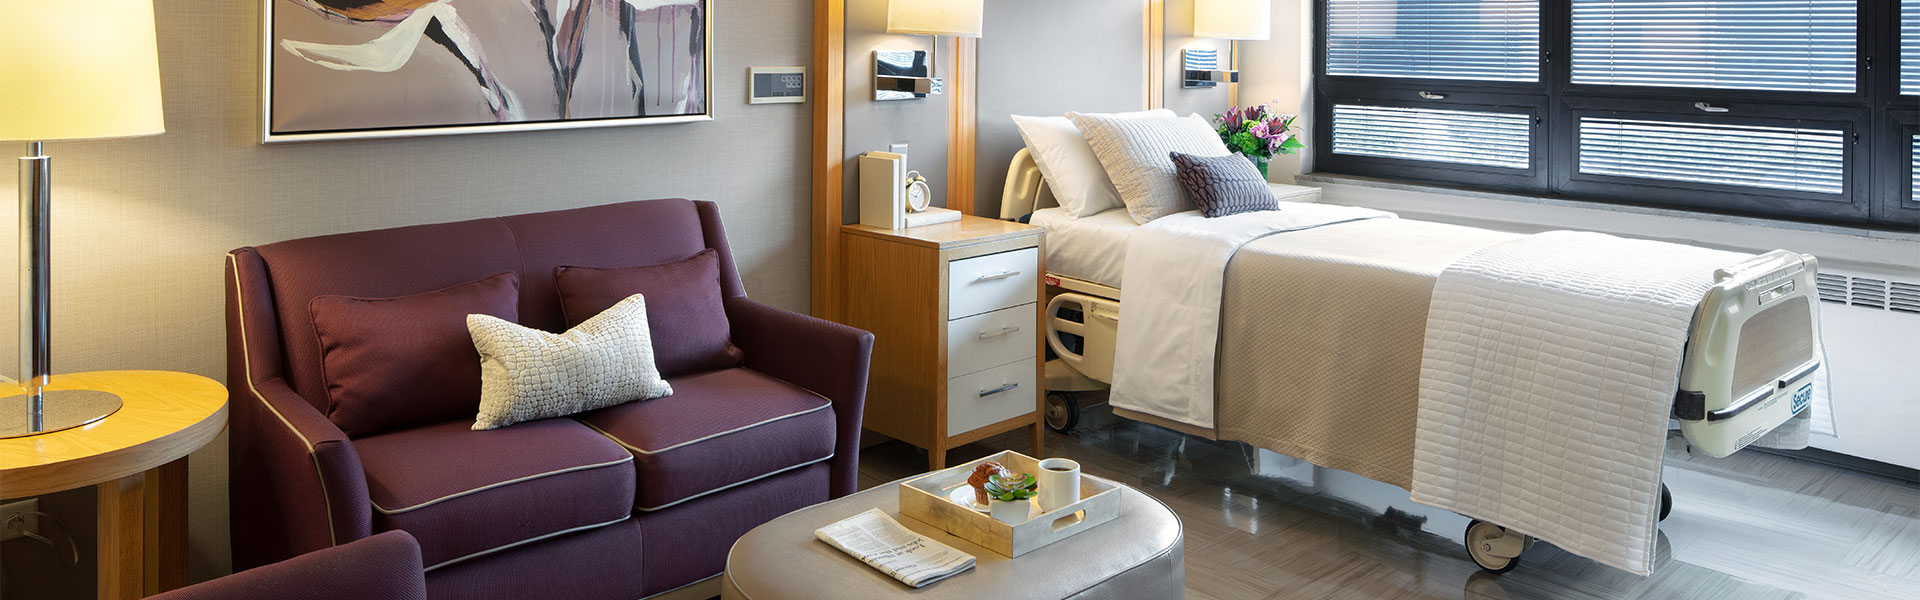
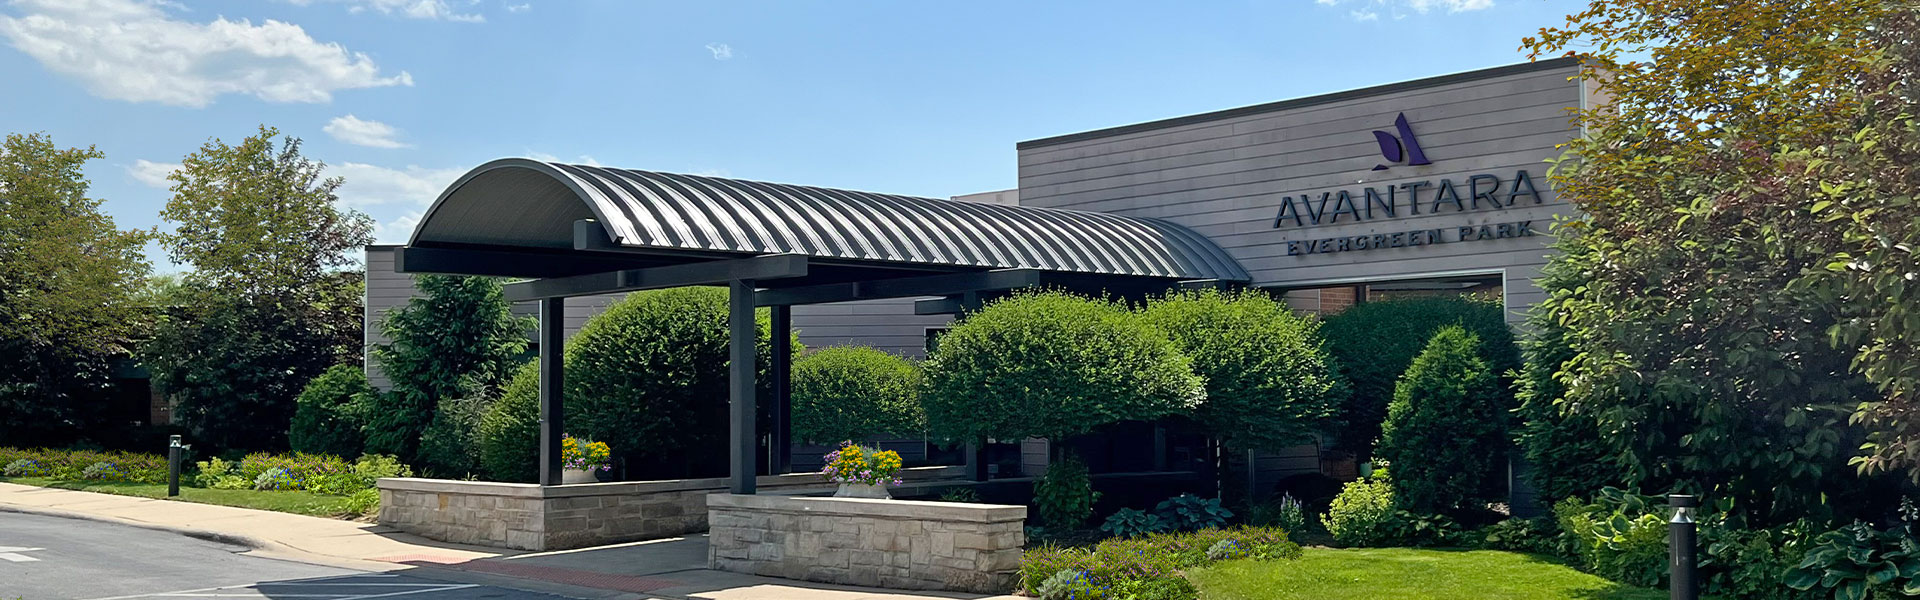
Avantara Evergreen Park boasts its one-of-a-kind superior care that creates an atmosphere of comfort and security for a distinct living focused on relaxation and recovery. As one of Illinois’ most trusted nursing homes, there is a merit of an incomparable level of care that provokes quality service delivered by only the best team of professionals who offer tailored personal care plans for each unique individual.

Avantara Evergreen Park has the privilege of maximizing advanced medical services that lead to an enhanced caliber of life. 
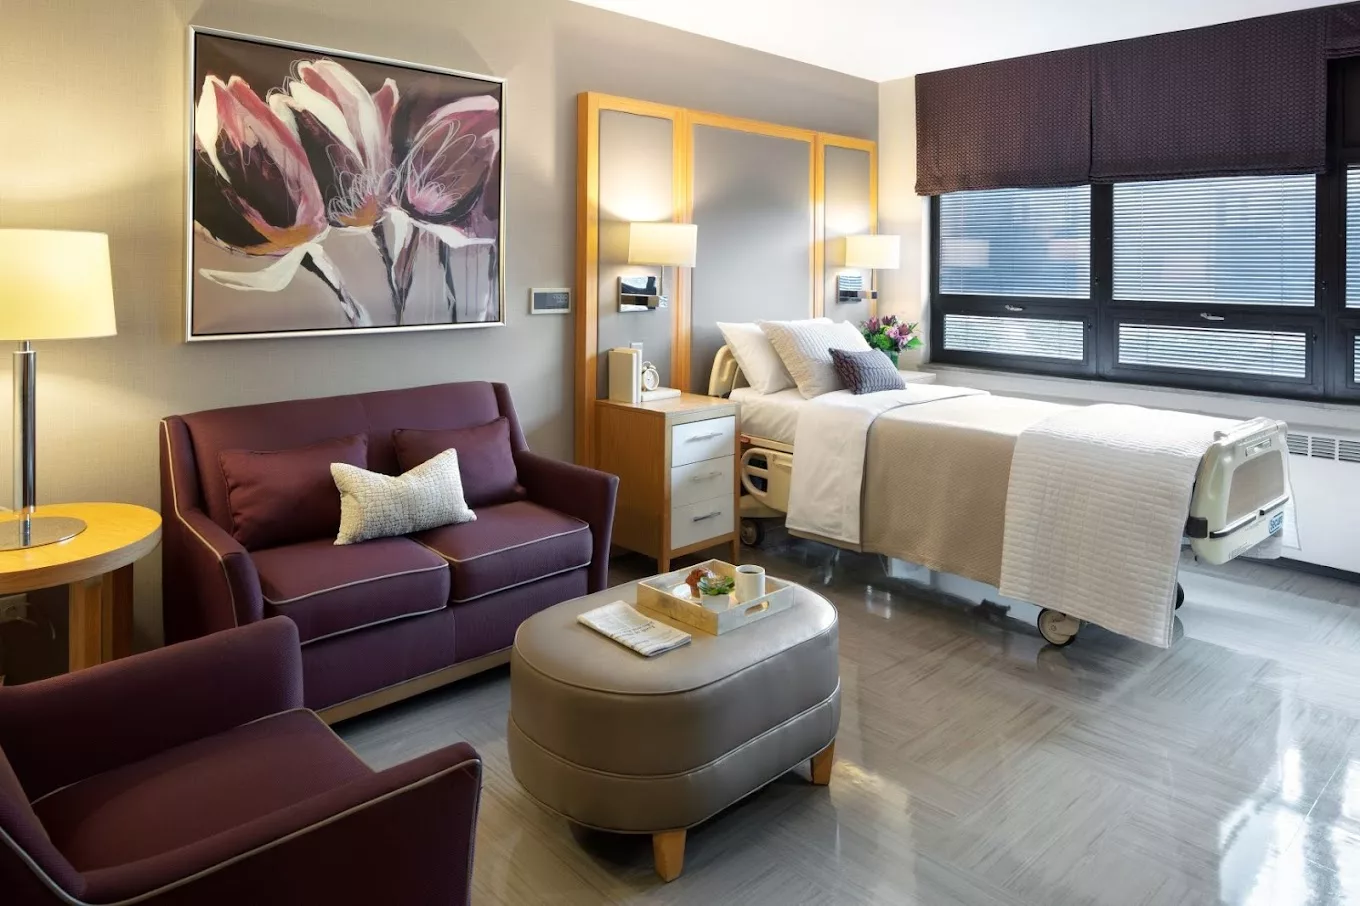
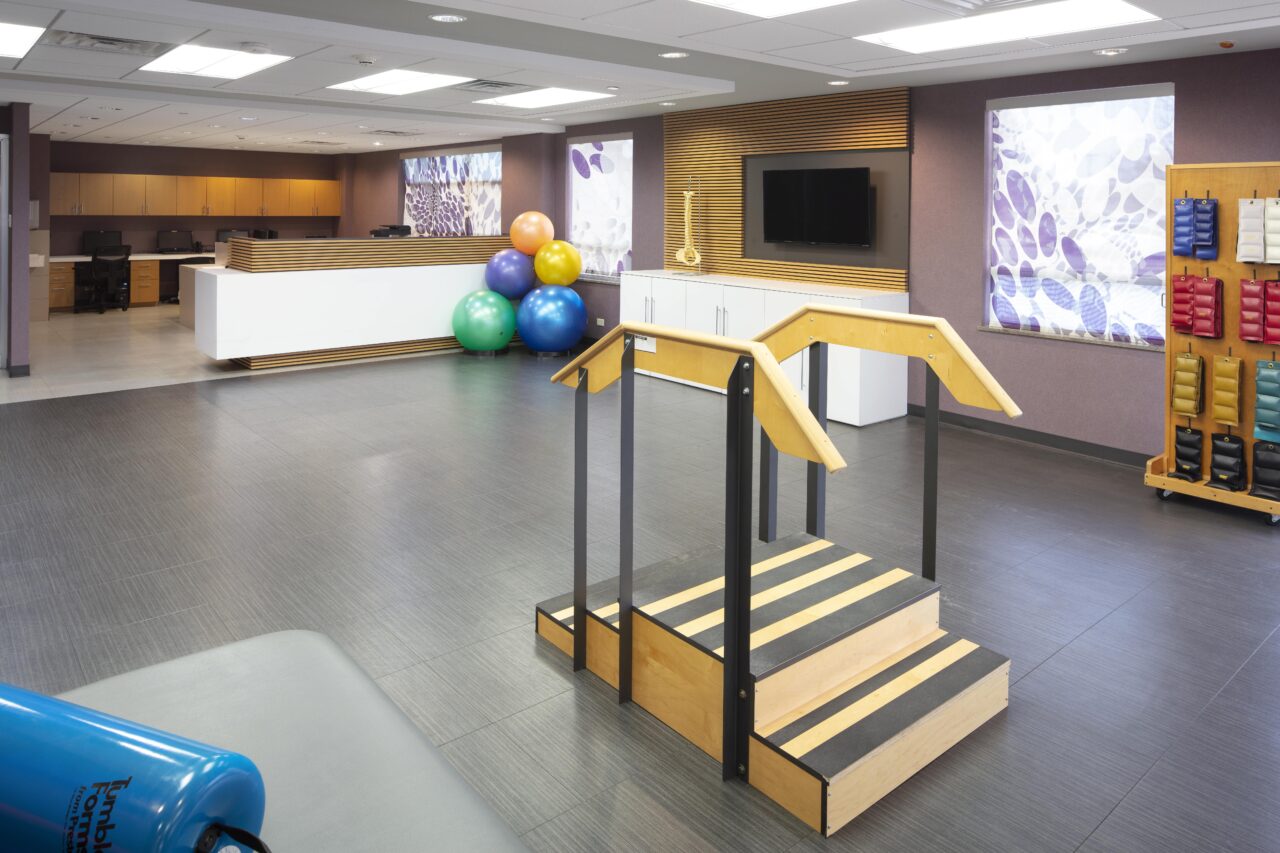
The areas of excellence are found in the range of an array of specialized services such as; cardiac care, bariatric care, G-tube, IV therapy, orthopedic care, oncology care, stroke recovery, wound care, and memory care. The list of accommodations extends to the comprehensive care plan physical therapy equipment, a team of  full-time therapists on-site, and a home assessment completed. 

(708) 907-7000

Quality ratings

Measured by Centers for Medicare & Medicaid Services (CMS)

Overall rating Info Official CMS rating based on health inspections, staffing and quality measures.
1/5
Illinois average: 3.2/5
Health Inspection Info Official CMS rating based on deficiencies found during state health inspections.
2/5
Illinois average: 3.0/5
Staffing Info Official CMS rating based on nurse staffing hours per resident per day.
1/5
Illinois average: 3.3/5
Quality Measures Info Official CMS rating based on clinical outcomes for residents.
2/5
Illinois average: 3.2/5

Nursing care per resident

Info Average daily nursing hours per resident (adjusted for acuity). Higher values indicate more nursing time per resident.
2h 40m per day

This home provides 32% less nursing time per resident than the Illinois average.

Illinois average: 3h 57m per day

Staffing hours breakdown

Info Hours of care per resident per day, broken down by staff type. Data from CMS Medicare.
Staff type Facility State avg National avg
Registered Nurse (RN) Info Registered nurse hours per resident per day. 49m per day 44m per day 41m per day
Nurse Aide Info Nurse aide hours per resident per day. 1h 56m per day 2h 8m per day 2h 21m per day
Total Nursing (Weekend) Info Total number of nurse staff hours per resident per day on weekends. 3h 25m per day 3h 5m per day 3h 26m per day
Physical Therapist Info Physical therapist staff hours per resident per day. 3m per day 3m per day 4m per day
RN (Weekend) Info Registered nurse hours per resident per day on weekends. 46m per day 34m per day 29m per day

Capacity and availability

High-capacity home

May provide extensive amenities, services and programs.

Total beds 242

This home usually has availability

Lower occupancy suggests more openings may be available.

Lower demand than the Illinois average
Occupancy rate 61.6%
Residents per day (avg) 174
Occupancy rate
61.6%
Residents per day (avg)
174

Who this home usually serves

TYPE OF STAY

Primarily short stays

Residents typically stay for brief periods, with frequent admissions and discharges throughout the year.

Might be optimal for
Post-acute recovery Temporary care Transitional stays

Breakdown by payment type

Medicare

25% of new residents, usually for short-term rehab.

Typical stay 19 days

Private pay

66% of new residents, often for short stays.

Typical stay 1 - 2 months

Medicaid

9% of new residents, often for long-term daily care.

Typical stay 4 - 5 months

Finances and operations

Privately-owned community
Home revenue
$35.5M
Operating loss
-$1.3M
Privately-owned community
Home revenue
$35,479,216.00
Operating loss
$-1,289,579.00
Payroll costs Info The portion of the home's budget spent on staff, including nurses, caregivers, and other employees who support care and operations.
$6.1M
17.3% of revenue
Other operating costs Info All remaining costs needed to run the home, such as food, utilities, building maintenance, supplies and administrative expenses.
$30.6M
Total costs $36.8M
Years in operation
12 years in operation
A community with a solid operating history and experience delivering ongoing care.
Walk Score
Walk Score: 67 / 100
Moderately walkable. Some errands can be accomplished on foot, with a mix of nearby amenities.

About this community

Additional licensing details

CMS Certification Number: 145734
Accreditations: Gold Seal of Approval® Certification for Post-Acute Care and Accreditation for Nursing Care from The Joint Commission

Staffing

Key information about the people who lead and staff this community.

Leadership

Contact: Mr. Chaim Rajchenbach, Managing Member

Care Services

Nursing Services
Rehabilitation Services
Memory Care
Skilled Nursing

Amenities & Lifestyle

Private and Semi-Private Suites
Community Spaces
Concierge Services
High-Speed Wi-Fi
On-Site Salon Services

Programs & Activities

Specific Programs
On-site Dialysis, Cardiac Care, Memory Care, Orthopedic Rehabilitation, Short-Term Rehabilitation, Stroke Recovery, Wound Care

Dining & Nutrition

Food Description
All meals are carefully served using fresh ingredients and healthy recipes, ensuring that all meals are nutritionally balanced.
Meals Included
Yes

Types of Care at Avantara Evergreen Park

Skilled Nursing
Contact Avantara Evergreen Park

Inspection History

In Illinois, the Department of Public Health, Office of Health Care Regulation conducts annual unannounced surveys to assess compliance with state and federal healthcare facility standards.

Health Inspection History

Inspections
Total health inspections 19

Illinois average 10.4


Last Health inspection on Sep 2025

Total health citations 65
Citations per inspection
3.42

Health citations are formal notices following inspections when they fail to comply with safety and care standards.

30 of 65 citations resulted from standard inspections; 33 of 65 resulted from complaint investigations; and 2 of 65 came from combined inspections (standard and complaint).

Breakdown of citation severity (last 3 years)
Critical Health citations More info 0
100% better than Illinois average

Illinois average: 0.7


Serious Health citations More info 13
261% worse than Illinois average

Illinois average: 3.6

0 critical citations More info Illinois average: 0.7

13 serious citations More info Illinois average: 3.6

52 moderate citations More info Illinois average: 32

0 minor citations More info Illinois average: 0.5
Citations history (last 3 years)
Quality of Care serious citation Sep 07, 2025
Corrected

Environmental moderate citation Jun 24, 2025
Corrected

Resident Rights moderate citation Jun 24, 2025
Corrected

Environmental moderate citation May 23, 2025
Corrected

Compare Nursing Homes around Chicago

The information below is reported by the Illinois Department of Public Health, Office of Health Care Regulation.
Astoria Place
SNF

Nursing Homes 24/7 care needed

Chicago (West Ridge)
164
92
DAVIS, PATRICIA
90.1%
$23,284,188.00
$5,156,347.00
22.1%
149
3/5
2.3724
3/5
3/5
4/5
1
31
2
+35%
-23%
+30%
All American Village Nursing and Rehabilitation Center
SNF

Nursing Homes 24/7 care needed

Chicago (Edgewater)
145
95
-
95.2%
$10,501,225.00
$5,518,981.00
52.6%
137.60
2/5
1.5145
2/5
1/5
5/5
-
32
-
-64%
-51%
+37%
Avantara Evergreen Park
SNF

Nursing Homes 24/7 care needed

Evergreen Park
242
67
BERGER, MENACHEM
61.6%
$35,088,632.00
$6,147,983.00
17.5%
174
1/5
2.6668
2/5
1/5
2/5
7
65
13
+71%
-14%
-11%
Chalet Living and Rehab
MC

Memory Care Specialized care for those with Memory Loss, Alzheimer's, or dementia, ensuring safety and support.

SNF

Nursing Homes 24/7 care needed

Chicago (Rogers Park)
219
84
-
87.5%
$27,244,701.00
$7,409,858.00
27.2%
193.30
1/5
1.8689
2/5
1/5
2/5
3
49
3
-23%
-40%
+26%
Buckingham Pavilion Nursing and Rehabilitation
AL

Assisted Living For seniors needing help with daily tasks but not full-time nursing.

IL

Independent Living For self-sufficient seniors seeking community and minimal assistance.

MC

Memory Care Specialized care for those with Memory Loss, Alzheimer's, or dementia, ensuring safety and support.

SNF

Nursing Homes 24/7 care needed

Chicago (West Ridge)
235
83
-
-
-
-
-
-
-
-
-
-
-
-
-
-
-
-
-

Places of interest near Avantara Evergreen Park

Address 16.2 miles from city center — 1.03 miles to nearest hospital (OSF Little Company of Mary Medical Center)

Address 10124 S Kedzie Ave, Evergreen Park, IL 60805

Calculate Travel Distance to Avantara Evergreen Park

Add your location

Address

Staffing Data

Source: CMS Payroll-Based Journal (Q2 2025)

523
Total Staff
190
Employees
333
Contractors
67,871
Total Hours (Quarter)
106
Avg Staff/Day
7
Avg Shift (hrs)
Nursing Staff Breakdown
Role Count Avg Shift (hrs) Uses Contractors?
Registered Nurse1267.9 Yes
Licensed Practical Nurse897.5 Yes
Certified Nursing Assistant2587.2 Yes
Staff by Category
Administration
1 staff
5.7hs shift avg
Nursing Staff
483 staff
7.2hs shift avg
Physicians & Practitioners
8 staff
5.9hs shift avg
Therapy Services
18 staff
7.2hs shift avg
Activities & Recreation
0 staff
0hs shift avg
Social Services
3 staff
6.1hs shift avg
Dietary Services
7 staff
6.5hs shift avg
Other Services
3 staff
5.7hs shift avg
Contractor Analysis
24.4%
of total hours from contractors
16,573 contractor hours this quarter
Certified Nursing Assistant: 146 Speech Language Pathologist: 5 Respiratory Therapy Technician: 4 Physical Therapy Aide: 5 Physical Therapy Assistant: 4 Licensed Practical Nurse: 58 Registered Nurse: 108 Qualified Social Worker: 3
Role Employees Contractors Total Staff Total Hours Days Worked % of Days Avg Shift (hrs)
Certified Nursing Assistant11214625830,33191100%7.2
Licensed Practical Nurse31588911,26291100%7.5
Registered Nurse181081269,31491100%7.9
RN Director of Nursing100103,25391100%5.8
Clinical Nurse Specialist7072,66591100%5.9
Physical Therapy Aide0552,1128796%7.2
Speech Language Pathologist0551,8137684%7.3
Other Dietary Services Staff6061,79891100%6.8
Dental Services Staff20298991100%5.7
Respiratory Therapy Technician0449808189%7.5
Physical Therapy Assistant0447797481%6.7
Qualified Social Worker0335708189%6.1
Administrator1015129099%5.7
Nurse Practitioner1015129099%5.7
Mental Health Service Worker1015129099%5.7
Dietitian1014718492%5.6

Facility Characteristics

Source: CMS Long-Term Care Facility Characteristics (Data as of Jan 2026)

Total census
167 residents
Residents by payment source
Medicare
20 residents (12%)
Medicaid
115 residents (68.9%)
Private pay or other
32 residents (19.2%)
Programs & Services
Residents' Group

Residents meet regularly to discuss policies, care quality, and activities

Active Resident Council

Organized group of residents that meets regularly to discuss facility policies, quality of life, and activities.

Quality of care over time

These measures show how residents usually do over time at this home, based on health outcomes and preventive care.

High-risk clinical events score Info A composite score based on pressure ulcers, falls with injury, weight loss, walking ability decline, and activities of daily living decline. 13.0
34% worse than Illinois average

Illinois average: 9.7

Functional decline score Info A composite score based on activities of daily living decline, walking ability decline, and incontinence. 25.1
35% worse than Illinois average

Illinois average: 18.6

Long-stay resident measures
Below average Illinois avg: 3.6 Info CMS star rating based on long-stay quality measure performance. 5 stars = significantly above average, 1 star = significantly below average.
Need for Help with Daily Activities Increased Info Percent of long-stay residents whose need for help with daily activities has increased 12.9%
17% better than Illinois average

Illinois average: 15.5%

Walking Ability Worsened Info Percent of long-stay residents whose ability to move independently worsened 30.2%
64% worse than Illinois average

Illinois average: 18.4%

Low Risk Residents with Bowel/Bladder Incontinence Info Percent of low risk long-stay residents who lose control of their bowels or bladder 32.3%
49% worse than Illinois average

Illinois average: 21.6%

Falls with Major Injury Info Percent of long-stay residents experiencing one or more falls with major injury 1.6%
53% better than Illinois average

Illinois average: 3.4%

High Risk Residents with Pressure Ulcers Info Percent of long-stay high risk residents with pressure ulcers 7.3%
38% worse than Illinois average

Illinois average: 5.3%

Urinary Tract Infection Info Percent of long-stay residents with a urinary tract infection 1.1%
37% better than Illinois average

Illinois average: 1.8%

Lost Too Much Weight Info Percent of long-stay residents who lose too much weight 13.0%
99% worse than Illinois average

Illinois average: 6.5%

Depressive Symptoms Info Percent of long-stay residents who have depressive symptoms 95.7%
99% worse than Illinois average

Illinois average: 48.1%

Antipsychotic Use Info Percent of long-stay residents who received an antipsychotic medication 4.5%
78% better than Illinois average

Illinois average: 20.2%

Pneumococcal Vaccine Info Percent of long-stay residents assessed and appropriately given the pneumococcal vaccine 73.8%
17% worse than Illinois average

Illinois average: 89.2%

Influenza Vaccine Info Percent of long-stay residents assessed and appropriately given the seasonal influenza vaccine 73.2%
20% worse than Illinois average

Illinois average: 91.6%

Hospitalizations per 1,000 days Info Number of hospitalizations per 1,000 long-stay resident days. 1.83
11% better than Illinois average

Illinois average: 2.05

ED visits per 1,000 days Info Number of outpatient emergency department visits per 1,000 long-stay resident days. 2.81
25% worse than Illinois average

Illinois average: 2.25

Short-stay resident measures
Significantly below average Illinois avg: 2.0 Info CMS star rating based on short-stay quality measure performance. 5 stars = much above average, 1 star = much below average.
Pneumococcal Vaccine Info Percent of short-stay residents assessed and appropriately given the pneumococcal vaccine 38.0%
44% worse than Illinois average

Illinois average: 68.3%

Antipsychotic medication increase Info Percent of short-stay residents who newly received an antipsychotic medication 2.0%
17% better than Illinois average

Illinois average: 2.3%

Influenza Vaccine Info Percent of short-stay residents assessed and appropriately given the seasonal influenza vaccine 26.6%
58% worse than Illinois average

Illinois average: 63.0%

Re-hospitalized after SNF stay Info Percentage of short-stay residents who were re-hospitalized after their nursing home admission. 29.4%
12% worse than Illinois average

Illinois average: 26.2%

Emergency department visits Info Percentage of short-stay residents who had an outpatient emergency department visit. 20.0%
43% worse than Illinois average

Illinois average: 14.0%

Falls with major injury Info Percentage of SNF residents who experience falls with major injury during their stay. 0.0%
100% better than Illinois average

Illinois average: 0.8%

Ability to care for self at discharge Info Percentage of residents at or above expected ability to care for themselves at discharge. 17.1%
68% worse than Illinois average

Illinois average: 53.7%

Successful return to home or community Info Rate of successful return to home or community from a skilled nursing facility. 57.3%
13% better than Illinois average

Illinois average: 50.6%

Penalties and fines

Federal penalties imposed by CMS for regulatory violations, including civil money penalties (fines) and denials of payment for new Medicare/Medicaid admissions.

Source: CMS Penalties Database (Data as of Jan 2026)

Total fines amount $353K
148% higher than Illinois average

Illinois average: $143K

Number of fines 7
136% more fines than Illinois average

Illinois average: 3.0

Payment Denials Info Serious action where Medicare and/or Medicaid temporarily stops payments for new residents until issues are fixed. 1
6% fewer payment denials than Illinois average

Illinois average: 1.1

Fines amount comparison
This facility $353K
Illinois average $143K
Penalty History

Penalties are imposed by CMS for violations of federal nursing home regulations.

Civil Money Penalty Info Fines imposed for noncompliance, which can be assessed per day or per instance of violation. Sep 27, 2024
$90K
Civil Money Penalty Info Fines imposed for noncompliance, which can be assessed per day or per instance of violation. May 17, 2024
$30K
Civil Money Penalty Info Fines imposed for noncompliance, which can be assessed per day or per instance of violation. Sep 28, 2023
$13K
Civil Money Penalty Info Fines imposed for noncompliance, which can be assessed per day or per instance of violation. Sep 5, 2023
$5K

Last updated: Jan 2026

Guides for Better Senior Living

Care Cost Calculator: See Prices in Your Area

Nursing Home Data Explorer

Don’t Wait Too Long: 7 Red Flag Signs Your Parent Needs Assisted Living Now

The True Cost of Assisted Living in 2025 – And How Families Are Paying For It

Understanding Senior Living Costs: Pricing Models, Discounts & Financial Assistance

Financial Aid for Illinois Seniors

Get financial aid guidance

Community Care Program

Illinois CCP

Age 60+, Illinois resident, at risk of nursing home placement.

~$1,215/month (individual).

$17,500 (individual, excludes home, car).

High demand in urban areas; waitlists possible.

Illinois Respite Program

IL Respite (via NFCSP)

Caregiver of someone 60+ (or with dementia), Illinois resident.

No strict limit; prioritizes low-income.

Not applicable.

Limited slots; urban/rural balance.

Supportive Living Program (SLP)

Illinois Medicaid Supportive Living Program

Age 65+ or 22-64 with disability, Illinois resident, Medicaid-eligible, needs moderate assistance (not nursing home-level).

~$2,829/month (300% FBR, individual); QIT allowed.

$2,000 (individual), $3,000 (couple) (excludes home, car).

~200 SLP sites statewide; room/board not covered.

Persons Who Are Elderly Waiver

Illinois Medicaid Elderly Waiver

Age 65+, Illinois resident, Medicaid-eligible, nursing home-level care need.

~$2,829/month (300% FBR, individual).

$2,000 (individual), $3,000 (couple).

Part of HealthChoice Illinois; consumer-directed options available.

Medicare Savings Program (MSP)

Illinois Medicare Savings Program

Age 65+ or disabled, Illinois resident, Medicare Part A/B.

~$2,510/month (QMB), ~$3,380/month (SLMB), ~$3,598/month (QI)—individual.

$9,430 (individual), $14,130 (couple).

Three tiers; no waitlist.

Senior Community Service Employment Program (SCSEP)

Illinois SCSEP

Age 55+, unemployed, low-income, Illinois resident.

~$1,983/month (125% FPL).

Not specified; income-focused.

Priority for veterans, rural residents.

Optional State Supplementation (OSS)

Illinois Optional State Supplementation

Age 65+ or disabled, Illinois resident, in approved facility, SSI recipient or low-income.

~$1,004/month (including SSI).

$2,000 (individual), $3,000 (couple).

~$50-$500/month based on facility type.

VA Aid and Attendance (A&A) and Housebound Benefits

Illinois VA Aid and Attendance/Housebound

Age 65+ or disabled veteran/spouse, Illinois resident, wartime service, need for ADL help (A&A) or homebound.

Net income < ~$1,984/month (veteran with dependent, A&A); pension offsets income.

~$155,356 (net worth limit).

High veteran demand in urban/rural areas.

Tour Icon
Planning a tour? Check our touring checklist.
Chat Icon
Thinking of living here? We can help you speak to a current resident